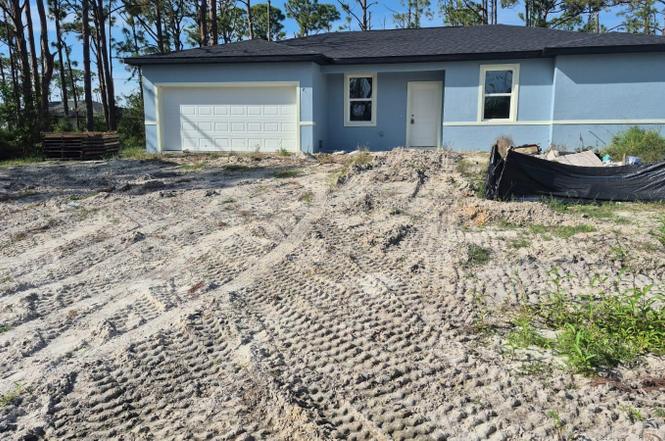
 🏗️ New Construction
5229 Chaney Ter · North Port, FL
Flood risk 9/10 · Severe
- FEMA flood zone
- X (shaded)
- Chance of flooding over 30 yrs
- 0.99%
- Est. flood insurance / yr
- $507 – $1,088
Fire risk 1/10 · Minimal
- Est. fire insurance / yr
- $947 – $1,759
Heat risk 10/10 · Severe
- Hot days now (above 107°F)
- 7 days/yr
- Hot days in 30 yrs
- 29 days/yr
Wind risk 10/10 · Severe
- Chance of severe wind over 30 yrs
- 99.0%
Air-quality risk 3/10 · Minor
- Unhealthy air days now
- 2 days/yr
- Unhealthy air days in 30 yrs
- 3 days/yr
Risk factors via First Street. Map © Google.
Why this score? — see what drove the C grade
The composite is a weighted blend of 9 inputs, each scored 0–100. Each bar is that input's sub-score; the figure is the points it added to the 100-point composite (weight × sub-score).
- Cash flow +24.8/30.0
- DSCR +8.0/10.0
- ARV discount +7.5/15.0
- 1% rule +5.1/10.0
- Schools +4.6/10.0
- Rent growth +3.8/5.0
- Livability +3.8/5.0
- Condition / age +2.5/5.0
- Appreciation +0.0/10.0
$252,000
🖨 Deal sheet 📄 Offer letter ✓ Due diligence
Listing remarks
Under Construction. The property’s price is based on the current stage of construction, which is 0.83/100 of completion. This property has an active and transferable building permit. Electrical, plumbing, and HVAC systems are already completed, and the structure is in an advanced stage of construction—ready to be finished to the new owner’s specifications. If the buyer wants to finish the construction with our builder we have a preferred lender to provide financing and the remaining cost is $53,575. This stunning new home will feature 4 bedrooms and 2 bathrooms in a peaceful, well-located neighborhood, with an attached 2-car garage and elegant paver driveway. The smart two
Key facts
- Open-concept kitchen
- Stylish backsplash
- Granite countertops
Tags
Property features AI
Finance
- Other: Lot size about 0.23 acres (approximately 929 m²); Zoning: RSF3.5
- Financial info: No CDD; Not homesteaded
Exterior
- Parking: Attached 2-car garage
- Utilities: Public water; Other sewer; Other utilities
- Home design: Single-family residence; New construction (under construction, projected completion March 31, 2026); One story; South-facing
- Construction: Block construction; Shingle roof; Slab foundation; Building area about 2,079 total (living area about 1,636); Estimated building area in metric units available
- Exterior features: Other exterior features; Paved road access
Interior
- Kitchen: No appliances included
- Bedrooms: 4 bedrooms
- Flooring: Other flooring
- Bathrooms: 2 full bathrooms
- Heating & cooling: Other heating; Other cooling
- Interior features: Other interior features
- Laundry & utility: Dedicated laundry room
Neighborhood map
What this means for you Summary
Snapshot
- This is a 4-bed/2.0-bath land listed at $252k.
Deal economics
- At list price, monthly cash flow is $465 ($6k/yr) — positive.
- The deal already cash-flows at list — no discount required.
- Meets the 1% rule at list price ($3k rent vs $252k).
- Recommended offer: $222k (12.0% below list) — sets the bar for market timing.
- Cap rate 8.8% vs local median 3.6% in North Port — top-decile yield for the area; either an underpriced asset or a hidden risk that comps aren't pricing in. Stress-test before assuming the spread holds.
Location & tenants
- Location reads 75/100 on livability (#252 in FL, #3,975 nationally) — a middle-class / working-renter tenant base. Strengths: crime A+, housing A+, health & safety A+; Watch: amenities F, commute F.
- Charlotte (suburban): math 54% / reading 54% proficiency, ranked #22 of 73 in FL (top 30%) — acceptable for families but not a draw, mixed tenant base, ~2y average lease.
- Market conditions: Rents rising fast (+5.3%/yr); 2188 active listings in the ZIP; 19 comparable units currently listed for rent nearby; rentals at typical pace (median 21d on market — plan ~3-4 weeks tenant-placement turnaround); solid renter incomes; 4,585 units permitted in Charlotte County in 2024 (703 in 5+ unit buildings).
- This rent runs 36% of the median local income ($84k/yr) — at the standard rent-burdened threshold; future hikes will face affordability resistance.
Forward outlook
- Local home prices are declining (-3.0%/yr); year-one equity from $2k of loan paydown is wiped out by about $8k of value loss. Plan a longer hold.
- Charlotte County population projected at +24% by 2050 — long-run rental-demand tailwind backs the buy-and-hold thesis.
- At projected returns (-3.0% appreciation + 5.3% rent growth), your $71k cash investment doubles in ~10 years — after that, you're playing with house money.
Negotiation context
- It's been on market 385 days — a 12% lower offer ($222k) is reasonable based on typical stale-listing flexibility.
- Current owner paid $84k; list at $252k implies a 200% gain — meaningful room to come down on a strong offer.
Risks & watch-outs
- Watch-outs: flood insurance adds $66/mo.
- Climate carrying-cost: severe flood risk; severe wind risk, 99% chance of damaging wind over 30y; extreme-heat days projected 7→29/yr by 2055 (HVAC capex compounding) — expect insurance premiums to compound above CPI over the hold.
Questions for the listing agent
- It's been on market 385 days. Have you received any prior offers? Is the seller open to a 12% concession, seller financing, or rate buy-down credit?
- What's the actual annual flood-insurance premium (NFIP or private), and is the property in a SFHA with mandatory coverage?
- Why hasn't it sold? Are there any deal-killer items the seller is aware of (foundation, flood, title, zoning, code violations)?
- Is there a deadline driving the sale (1031 exchange, divorce, estate, relocation)? That informs how much negotiation room exists.
- Schools are B-rated — typically a magnet for longer-tenancy family renters. What's the average tenant stay here, and is there a school-zone premium baked into asking?
- What's the average days-on-market for RENTAL listings here right now (not sales)? A rising rental-DOM trend means longer vacancies and softer asking-rent achievability than the comps imply.
- What's the recent tenant-quality profile in this submarket — average credit score on applications, eviction rate, late-payment / NSF rate, and stable-employment percentage? A property-management company in the area should have these aggregated.
- How much new for-sale + rental construction is in the pipeline within 1–3 miles? Heavy new supply typically softens prices + rents 12–24 months out; constrained supply supports both.
Investment metrics
- 1% rule
- 1.01% ✓
- Cap rate
- 8.82%
- Cash-on-cash
- 9.03%
- DSCR
- 1.40
- GRM
- 8.3
CMA / ARV
No comps found within radius.
Projected returns pro-forma
-3.0% appreciation · 5.29% rent growth · sell at horizon
- IRR
- -2.0%
- Equity multiple
- 0.92×
- Total profit
- $-5,352
- Equity at exit
- $37,574
- IRR
- 9.8%
- Equity multiple
- 1.83×
- Total profit
- $58,777
- Equity at exit
- $21,788
Cash invested: $70,560 (down + closing). Projections, not guarantees.
Landlord ↔ Tenant lean methodology
- Overall (STATE)
- 87 Strongly Landlord-Friendly
- State Florida
- 87 Strongly Landlord-Friendly · R+3
- County
- — inherits STATE
- City
- — inherits STATE
ZIP-level market 33981
- Home prices YoY
- -7.5%
- Rents YoY
- 5.3%
- Active inventory
- 2188
- Price-to-rent
- 8.3×
Monthly cashflow live
- Estimated rent
- $2,534 high interval (Pro) →
- Mortgage (P&I)
- −$1,322
- Tax from tax record
- −$44 /mo · $527/yr
- Insurance
- −$105
- Flood insurance flood zone
- −$66 /mo · $798/yr
- HOA
- −$0
- Vacancy / Maint / Mgmt
- −$532
- Net cashflow
- $465
Break-even live
UW: 25.0% down · 7.5% · 30yr · 1.5% tax · 5.0% vac · 8.0% maint · 8.0% mgmt
Financing live
Cash to close
- Down payment
- $63,000
- Closing costs
- $7,560
- Reserves months
- —
- Total cash needed
- —
Loan-product check · same deal, 3 products live
Conventional
25% down · 7.5% · 30yr
- Down + closing
- —
- Monthly P&I
- —
- Monthly cashflow
- —
- DSCR
- —
- Eligible?
- —
Personal DTI + credit; lowest rate.
DSCR
20% down · 8.5% · 30yr
- Down + closing
- —
- Monthly P&I
- —
- Monthly cashflow
- —
- DSCR
- —
- Eligible?
- —
No personal income docs; deal must DSCR.
Hard money
10% down · 12.0% · 12mo
- Down + closing
- —
- Monthly P&I
- —
- Monthly cashflow
- —
- DSCR
- —
- Eligible?
- —
Short-term bridge; refi at stabilization.
Rent comps 19 comps
| Address | Beds | Baths | Sqft | Rent | $/sqft | DOM | Units | Dist |
|---|---|---|---|---|---|---|---|---|
| 13280 Foresman Blvd Port Charlotte, FL | 3.0 | 2.0 | 1500 | $2,800 | $1.87 | 13d | 1 | 0.65mi |
| 13184 Eureka Cir Port Charlotte, FL | 3.0 | 2.0 | 1640 | $2,300 | $1.40 | 21d | 1 | 0.67mi |
| 5496 Brussels Ter Port Charlotte, FL | 3.0 | 2.0 | 1400 | $3,900 | $2.79 | 21d | 1 | 0.71mi |
| 6464 David Blvd Port Charlotte, FL | 3.0 | 2.0 | 1613 | $1,716 | $1.06 | 21d | 1 | 0.72mi |
| 5311 Levy Ln Port Charlotte, FL | 3.0 | 2.0 | 1192 | $1,850 | $1.55 | 13d | 1 | 0.74mi |
| 13349 Buckett Cir Port Charlotte, FL | 3.0 | 3.0 | 1560 | $2,795 | $1.79 | 21d | 1 | 0.93mi |
| 5201 Forbes Ter Port Charlotte, FL | 4.0 | 2.0 | 1664 | $3,200 | $1.92 | 21d | 1 | 1.00mi |
| 12129 Grosspoint Ave Port Charlotte, FL | 3.0 | 2.0 | 1388 | $2,300 | $1.66 | 21d | 1 | 1.10mi |
| 6248 Drucker Cir Port Charlotte, FL | 3.0 | 2.0 | 1414 | $1,810 | $1.28 | 13d | 1 | 1.15mi |
| 6351 Coniston St Port Charlotte, FL | 3.0 | 2.0 | 1200 | $1,950 | $1.62 | 21d | 1 | 1.15mi |
| 6628 Thorman Rd Port Charlotte, FL | 3.0 | 2.0 | 1116 | $1,800 | $1.61 | 21d | 1 | 1.15mi |
| 12884 Bacchus Rd Port Charlotte, FL | 3.0 | 2.0 | 1092 | $2,300 | $2.11 | 21d | 1 | 1.15mi |
| 13288 Fowler Ave Port Charlotte, FL | 3.0 | 2.0 | 1203 | $2,500 | $2.08 | 21d | 1 | 1.17mi |
| 12174 Terkelsen Ave Port Charlotte, FL | 3.0 | 2.0 | 1400 | $3,200 | $2.29 | 21d | 1 | 1.18mi |
| 12223 Maltz Ave Unit 12225" Port Charlotte, FL | 3.0 | 2.0 | 1162 | $1,649 | $1.42 | 21d | 1 | 1.31mi |
| 12223 Maltz Ave Unit 12223 Port Charlotte, FL | 3.0 | 2.0 | 1162 | $1,647 | $1.42 | 21d | 1 | 1.31mi |
| 6551 Coliseum Blvd Port Charlotte, FL | 3.0 | 2.0 | 1386 | $1,850 | $1.33 | 13d | 1 | 1.33mi |
| 4604 Club Dr Port Charlotte, FL | 3.0 | 2.0 | 2041 | $2,795 | $1.37 | 21d | 1 | 1.35mi |
| 12032 Edwards Rd Port Charlotte, FL | 3.0 | 2.0 | 1723 | $1,869 | $1.08 | 13d | 1 | 1.49mi |
Listing history 20 events
-
2026-06-18days on market $252,000 Active 385 DOM
-
2026-06-17days on market $252,000 Active 384 DOM
-
2026-06-16days on market $252,000 Active 383 DOM
-
2026-06-15days on market $252,000 Active 382 DOM
-
2026-06-14days on market $252,000 Active 380 DOM
-
2026-06-13days on market $252,000 Active 379 DOM
-
2026-06-10days on market $252,000 Active 377 DOM
-
2026-06-09days on market $252,000 Active 376 DOM
-
2026-06-08days on market $252,000 Active 375 DOM
-
2026-06-05days on market $252,000 Active 371 DOM
-
2026-06-02days on market $252,000 Active 369 DOM
-
2026-06-01days on market $252,000 Active 368 DOM
-
2026-05-31days on market $252,000 Active 367 DOM
-
2026-05-30days on market $252,000 Active 366 DOM
-
2026-03-01price $252,000
-
2025-09-17price $262,000
-
2025-05-29$299,000 Active
-
2022-07-18soldstatus $84,000
-
2022-06-17soldstatus $56,000
-
2022-04-15soldstatus $33,000
ⓘ Source: listings_history table (triggers on properties + properties_extension) + one-shot
backfill from property_details.listing_events for pre-trigger history.
Tax reassessment forecast FL · Resets to sale price
- Current annual tax
- $527 · $44/mo
- Projected year-2 tax
- $2,092 · $174/mo
- Expected delta
- +$1,565/yr (+$130/mo · 296.9%)
ⓘ Screening estimate from a state-policy table — verify with the county assessor before closing.
Climate risk First Street
- Flood 9/10 Extreme FEMA zone X (shaded) · 99% chance over 30 yrs
- Wildfire 1/10 Low
- Heat 10/10 Extreme 7 d/yr ≥107°F today · 29 d/yr by 30 yrs out
- Wind 10/10 Extreme 99% chance of damaging wind over 30 yrs
- Air quality 3/10 Moderate 2 unhealthy d/yr today · 3 by 30 yrs out
Nearby sold comps map
Loading sold comps map…
Walkable amenities ~0.75 mi
Loading nearby amenities…
Taxation est. · year 1
- Rental income
- $30,404
- − Mortgage interest
- −$14,116
- − Property taxes
- −$527
- − Insurance
- −$2,058
- − Repairs & maintenance
- −$2,432
- − Management
- −$2,432
- − Depreciation
- −$7,331
- Taxable income
- $1,508
- Est. tax owed @ 24.0%
- −$362
- After-tax cash flow
- $5,215/yr
For passive investors: Depreciation is non-cash, so a rental often shows a tax loss while cash-flowing — sheltering income. Rental losses are passive: they offset passive income freely, and up to $25,000/yr can offset ordinary (W-2) income if you actively participate and your MAGI is under $100k (phasing out to $0 by $150k); unused losses carry forward. On sale, claimed depreciation is recaptured at up to 25%, and gains may owe capital-gains tax (a 1031 exchange can defer both). Figures are a year-1 estimate at your 24.0% rate — not tax advice; consult a CPA.
Schools (NCES district)
- District
- Charlotte
- NCES district ID
- 1200240
- Math proficiency
- 54% ▼ -6.00%
- Reading proficiency
- 54% ▼ -1.00%
- Median HH income
- $44,864
- Composite
- 45.62/100
- National rank
- #2586
- State rank
- #22 of 73 in FL
Livability — North Port
- Score
- 75/100
- State rank
- #252
- US rank
- #3975
Category grades
Schools grade is shown separately in the Schools card above.
Census & demographics
- County
- Charlotte County · 196,994 people
- City population
- 75,324
- Metro
- Punta Gorda, FL
- Population (ZIP)
- 15,622
- Household income
- $84,098
- Rent vs Own
- Severe rent burden
- 105.0
Population outlook (Charlotte County) Hauer SSP2
- Today (2025)
- 198,646 people
- By 2030
- 210,507 · +6.0%
- By 2040
- 230,857 · +16.2%
- By 2050
- 247,148 · +24.4%
- By 2075
- 281,777 · +41.8%
- By 2100
- 293,609 · +47.8%
Race, ethnicity, and origin ACS 2023
- Neighborhood character
- Predominantly White (89%)
- Race & ethnicity
- White 89% Two or more races 4% Hispanic / Latino 4% Black 2% Asian 1%
- Common ancestry
- Romanian 4% Lithuanian 3% Italian 2%
- Foreign-born
- 6% · Canada
- Languages at home
- 96% English-only · Spanish 1% German/W. Germanic 1% Tagalog/Filipino 1%
Political lean MEDSL · Charlotte
- 2024 margin
- Solid R (+34.0) · D 32.7% · R 66.7%
- 2008→2024 swing
- -26.7pp toward R · 2008: -7.2pp · 2024: -34.0pp
- All cycles
- 2024: R+34.0 2020: R+26.6 2016: R+27.8 2012: R+14.3 2008: R+7.2
Not yet ingested
- Civics
- —
Market trends
- HPI YoY
- ▼ -28.09%
- Current HPI
- 346.5247
- Rent YoY
- ▲ 5.29%
- Metro
- Punta Gorda, FL
- State GDP YoY
- ▲ 3.28%
- F500 in state
- 36
Industry mix (Fortune 500 HQ in FL)
| Industry | F500 HQs | Revenue |
|---|---|---|
| Industrial Technology | 2 | $29B |
|
||
| Insurance | 2 | $17B |
|
||
| Retail | 1 | $60B |
|
||
| Technology Distribution | 1 | $58B |
|
||
| Homebuilding | 1 | $35B |
|
||
| Technology Manufacturing | 1 | $35B |
|
||
Price history
+663.6% since first listed6 events — show timeline
- 2026-03-01 Price Changed $252,000 Stellar MLS as Distributed by MLS Grid
- 2025-09-17 Price Changed $262,000 Stellar MLS as Distributed by MLS Grid
- 2025-05-29 Listed $299,000 Stellar MLS as Distributed by MLS Grid
- 2022-07-18 Sold (Public Records) $84,000 Public Records
- 2022-06-17 Sold (Public Records) $56,000 Public Records
- 2022-04-15 Sold (Public Records) $33,000 Public Records
Property tax history
-1.2%/yrLatest (2025): $527 · +0.9% YoY. Source: county tax records.
Cash-flow waterfall
monthlySold comps — $/sqft
last 12 mo · ≤1 miLoading sold comps…