 🏗️ New Construction
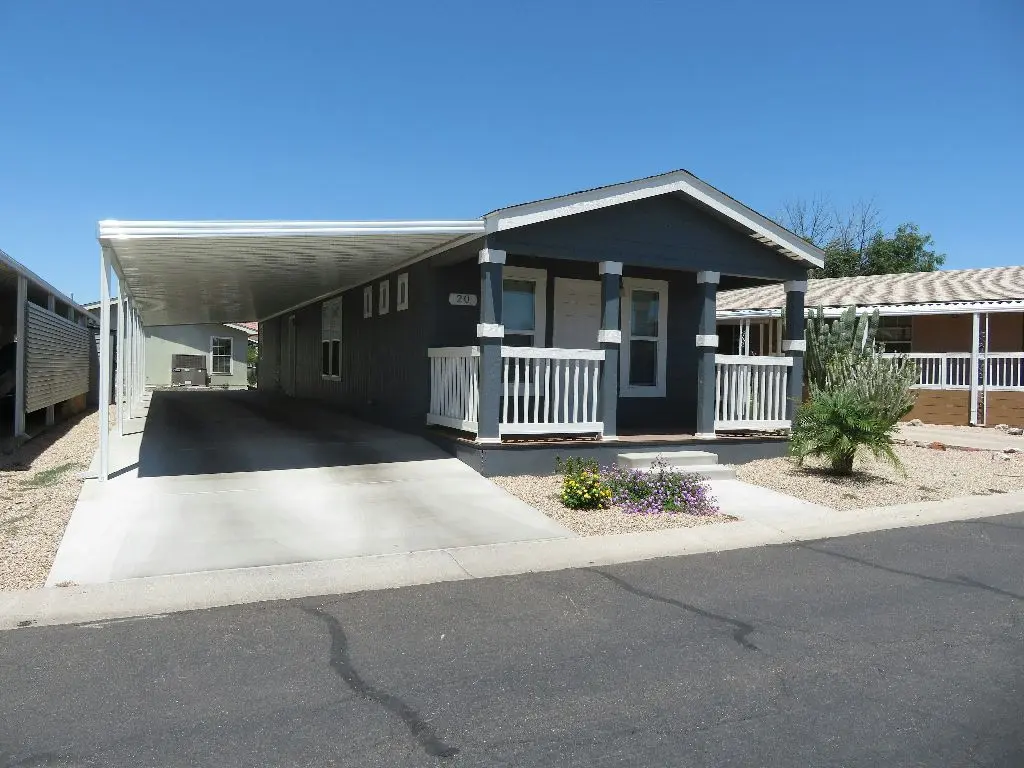
Cholla Plan · Peoria, AZ
Flood risk 1/10 · Minimal
- FEMA flood zone
- X (shaded)
- Chance of flooding over 30 yrs
- 0.0%
- Est. flood insurance / yr
- $507 – $1,088
Fire risk 1/10 · Minimal
- Est. fire insurance / yr
- $610 – $1,132
Heat risk 9/10 · Severe
- Hot days now (above 112°F)
- 6 days/yr
- Hot days in 30 yrs
- 17 days/yr
Wind risk 1/10 · Minimal
- Chance of severe wind over 30 yrs
- —
Air-quality risk 3/10 · Minor
- Unhealthy air days now
- 3 days/yr
- Unhealthy air days in 30 yrs
- 3 days/yr
Risk factors via First Street. Map © Google.
Why this score? — see what drove the B grade
The composite is a weighted blend of 9 inputs, each scored 0–100. Each bar is that input's sub-score; the figure is the points it added to the 100-point composite (weight × sub-score).
- Cash flow +30.0/30.0
- 1% rule +10.0/10.0
- DSCR +10.0/10.0
- ARV discount +7.5/15.0
- Livability +3.8/5.0
- Condition / age +3.8/5.0
- Schools +3.5/10.0
- Rent growth +2.2/5.0
- Appreciation +0.0/10.0
$74,000
🖨 Deal sheet 📄 Offer letter ✓ Due diligence
Listing remarks
55+ age qualified community. Come tour our new spacious two bedroom, two bathroom home. The kitchen feels large and open with plenty of counter space and cabinets for storage. The kitchen is outfitted with brand new energy efficient appliances, and is open to both the living and dining room. Both the master suite, featuring a walk-in closet and en suite bathroom, and additional bedroom are generously proportioned. Come by today and make this home yours!
Key facts
- En suite bathroom
- Walk-in closet
- Listed 13 days
Tags
Property features AI
Finance
- Financial info: Listed price $74,000
Exterior
- Home design: Single-story plan home; North street prefix (N)
- Exterior features: Living area of 1,056
Interior
- Bedrooms: 2 bedrooms
- Bathrooms: 2 bathrooms
- Interior features: Plan home (Cholla)
Neighborhood map
What this means for you Summary
Snapshot
- This is a 2-bed/2.0-bath manufactured listed at $74k. Condition is rated good.
Deal economics
- At list price, monthly cash flow is $1k ($13k/yr) — positive.
- The deal already cash-flows at list — no discount required.
- Meets the 1% rule at list price ($2k rent vs $74k).
- Cap rate 31.3% vs local median 3.3% in Peoria — top-decile yield for the area; either an underpriced asset or a hidden risk that comps aren't pricing in. Stress-test before assuming the spread holds.
Location & tenants
- Location reads 76/100 on livability (#14 in AZ, #3,603 nationally) — a middle-class / working-renter tenant base. Strengths: housing A+, commute A, employment A; Watch: cost of living C-, amenities D, health & safety F.
- Peoria Unified School District (4237) (suburban): math 36% / reading 42% proficiency, ranked #64 of 249 in AZ (top 26%) — families likely to look elsewhere, expect single-tenant / working-renter base with shorter leases.
- Market conditions: Rents soft (-1.3%/yr); 125 active listings in the ZIP; 30 comparable units currently listed for rent nearby; rentals at typical pace (median 25d on market — plan ~3-4 weeks tenant-placement turnaround); solid renter incomes; 36,011 units permitted in Maricopa County in 2024 (12,801 in 5+ unit buildings).
Forward outlook
- Local home prices are declining (-3.0%/yr); year-one equity from $358 of loan paydown is wiped out by about $2k of value loss. Plan a longer hold.
- Maricopa County population projected at +38% by 2050 — long-run rental-demand tailwind backs the buy-and-hold thesis.
- At projected returns (-3.0% appreciation + 0.0% rent growth), your $14k cash investment doubles in ~2 years — after that, you're playing with house money.
Negotiation context
- Only 14 days on market — expect competitive offers; lowballing is unlikely to land.
Risks & watch-outs
- Climate carrying-cost: extreme-heat days projected 6→17/yr by 2055 (HVAC capex compounding) — expect insurance premiums to compound above CPI over the hold.
Questions for the listing agent
- Is there a deadline driving the sale (1031 exchange, divorce, estate, relocation)? That informs how much negotiation room exists.
- Schools are B-rated — typically a magnet for longer-tenancy family renters. What's the average tenant stay here, and is there a school-zone premium baked into asking?
- What's the average days-on-market for RENTAL listings here right now (not sales)? A rising rental-DOM trend means longer vacancies and softer asking-rent achievability than the comps imply.
- What's the recent tenant-quality profile in this submarket — average credit score on applications, eviction rate, late-payment / NSF rate, and stable-employment percentage? A property-management company in the area should have these aggregated.
- How much new for-sale + rental construction is in the pipeline within 1–3 miles? Heavy new supply typically softens prices + rents 12–24 months out; constrained supply supports both.
Investment metrics
- 1% rule
- 3.52% ✓
- Cap rate
- 31.35%
- Cash-on-cash
- 89.48%
- DSCR
- 4.98
- GRM
- 2.4
CMA / ARV
- ARV (on-the-fly)
- $51,744
- Comps found
- 12
Show comp detail 12 sales within ~0.75 mi
| Address | Dist | Beds/Ba | Sqft | Sold | Price | $/sf | Match |
|---|---|---|---|---|---|---|---|
| 10960 N 67th Ave #223 | 0.01mi | 2/2.0 | 1,056 (0%) | 10mo | $66,000 | $63 | 91 |
| 10960 N 67th Ave #33 | 0.00mi | 2/2.0 | 980 (-7%) | 2mo | $33,000 | $34 | 87 |
| 10960 N 67th Ave #72 | 0.01mi | 2/2.0 | 1,096 (+4%) | 11mo | $41,000 | $37 | 84 |
| 10960 N 67th Ave #11 | 0.00mi | 2/2.0 | 980 (-7%) | 5mo | $15,000 | $15 | 84 |
| 6960 W Peoria Ave #181 | 0.33mi | 2/2.0 | 1,056 (0%) | 2mo | $77,000 | $73 | 83 |
| 10960 N 67th Ave #227 | 0.01mi | 2/2.0 | 1,150 (+9%) | 11mo | $72,000 | $63 | 75 |
| 10960 N 67th Ave #180 | 0.01mi | 2/2.0 | 1,152 (+9%) | 12mo | $50,000 | $43 | 74 |
| 6960 W Peoria Ave #49 | 0.33mi | 2/2.0 | 980 (-7%) | 6mo | $21,000 | $21 | 68 |
| 6960 W Peoria Ave #44 | 0.43mi | 2/2.0 | 952 (-10%) | 1mo | $25,000 | $26 | 63 |
| 6960 W Peoria Ave #166 | 0.43mi | 2/2.0 | 1,152 (+9%) | 4mo | $72,000 | $63 | 62 |
| 6960 W Peoria Ave #59 | 0.31mi | 2/2.0 | 1,188 (+12%) | 7mo | $74,000 | $62 | 59 |
| 6960 W Peoria Ave #171 | 0.42mi | 2/2.0 | 924 (-12%) | 7mo | $45,000 | $49 | 54 |
Match score weights: distance 35% · size 25% · config 20% · recency 20%. Top-matched comps best support the ARV.
Projected returns pro-forma
-3.0% appreciation · 0.0% rent growth · sell at horizon
- IRR
- 86.7%
- Equity multiple
- 4.80×
- Total profit
- $55,116
- Equity at exit
- $7,715
- IRR
- 89.1%
- Equity multiple
- 9.01×
- Total profit
- $116,092
- Equity at exit
- $4,474
Cash invested: $14,488 (down + closing). Projections, not guarantees.
Landlord ↔ Tenant lean methodology
- Overall (STATE)
- 87 Strongly Landlord-Friendly
- State Arizona
- 87 Strongly Landlord-Friendly · R+3
- County
- — inherits STATE
- City
- — inherits STATE
ZIP-level market 85304
- Rents YoY
- -1.3%
- Active inventory
- 125
- Price-to-rent
- 3.4×
Monthly cashflow live
- Estimated rent
- $1,820 high interval (Pro) →
- Mortgage (P&I)
- −$271
- Tax est. 1.5%
- −$65 /mo · $776/yr
- Insurance
- −$22
- HOA
- −$0
- Vacancy / Maint / Mgmt
- −$382
- Net cashflow
- $1,080
Break-even live
UW: 25.0% down · 7.5% · 30yr · 1.5% tax · 5.0% vac · 8.0% maint · 8.0% mgmt
Financing live
Cash to close
- Down payment
- $12,936
- Closing costs
- $1,552
- Reserves months
- —
- Total cash needed
- —
Loan-product check · same deal, 3 products live
Conventional
25% down · 7.5% · 30yr
- Down + closing
- —
- Monthly P&I
- —
- Monthly cashflow
- —
- DSCR
- —
- Eligible?
- —
Personal DTI + credit; lowest rate.
DSCR
20% down · 8.5% · 30yr
- Down + closing
- —
- Monthly P&I
- —
- Monthly cashflow
- —
- DSCR
- —
- Eligible?
- —
No personal income docs; deal must DSCR.
Hard money
10% down · 12.0% · 12mo
- Down + closing
- —
- Monthly P&I
- —
- Monthly cashflow
- —
- DSCR
- —
- Eligible?
- —
Short-term bridge; refi at stabilization.
Rent comps 30 comps
| Address | Beds | Baths | Sqft | Rent | $/sqft | DOM | Units | Dist |
|---|---|---|---|---|---|---|---|---|
| 6605 W Mescal St Glendale, AZ | 3.0 | 2.0 | 1369 | $1,895 | $1.38 | 5d | 1 | 0.15mi |
| 6960 W Peoria Ave #90 Peoria, AZ | 2.0 | 1.0 | 704 | $1,320 | $1.88 | 24d | 1 | 0.40mi |
| 10013 N 66th Ln Glendale, AZ | 3.0 | 2.0 | 1063 | $1,999 | $1.88 | 24d | 1 | 0.65mi |
| 6325 W Cheryl Dr Glendale, AZ | 2.0 | 2.0 | 1092 | $2,100 | $1.92 | 24d | 1 | 0.65mi |
| 10654 N 60th Ave Glendale, AZ | 1.0–2.0 | 1.0–2.0 | 732 | $1,475 | $2.01 | 2d | 27 | 0.79mi |
| 7027 W Palo Verde Ave Peoria, AZ | 3.0 | 2.0 | 1500 | $1,999 | $1.33 | 44d | 1 | 1.01mi |
| 6421 W Carol Ave Glendale, AZ | 3.0 | 2.0 | 1243 | $1,799 | $1.45 | 18d | 1 | 1.02mi |
| 9914 N 73rd Ave Peoria, AZ | 3.0 | 1.5 | 1312 | $1,716 | $1.31 | 44d | 1 | 1.03mi |
| 7102 W Palo Verde Ave Peoria, AZ | 3.0 | 2.0 | 1360 | $2,000 | $1.47 | 44d | 1 | 1.03mi |
| 9350 N 67th Ave Unit B1 Glendale, AZ | 2.0 | 1.0 | 842 | $1,070 | $1.27 | 24d | 1 | 1.07mi |
| 9350 N 67th Ave Unit B2 Glendale, AZ | 2.0 | 2.0 | 970 | $1,250 | $1.29 | 44d | 1 | 1.07mi |
| 9350 N 67th Ave Glendale, AZ | 2.0 | 2.0 | 970 | $1,385 | $1.43 | 13d | 1 | 1.08mi |
| 9350 N 67th Ave Glendale, AZ | 2.0 | 2.0 | 970 | $1,429 | $1.47 | 44d | 1 | 1.08mi |
| 11600 N 75th Ave Peoria, AZ | 2.0 | 2.0 | 814 | $1,325 | $1.63 | 2d | 4 | 1.12mi |
| 7102 W Carol Ave Peoria, AZ | 3.0 | 2.0 | 1288 | $1,970 | $1.53 | 5d | 1 | 1.12mi |
| 9160 N 67th Ave Peoria, AZ | 2.0 | 2.0 | 1100 | $2,065 | $1.88 | 44d | 6 | 1.18mi |
| 9160 N 67th Ave Unit 212 Peoria, AZ | 2.0 | 2.0 | 992 | $1,680 | $1.69 | 24d | 1 | 1.18mi |
| 11807 N 76th Ave Peoria, AZ | 3.0 | 2.0 | 1228 | $1,995 | $1.62 | 44d | 1 | 1.20mi |
| 9121 N 68th Ave Peoria, AZ | 2.0 | 2.0 | 1126 | $1,699 | $1.51 | 44d | 1 | 1.20mi |
| 7040 W Olive Ave #12 Peoria, AZ | 2.0 | 2.0 | 900 | $1,445 | $1.61 | 24d | 1 | 1.23mi |
| 11851 N 76th Dr Peoria, AZ | 3.0 | 2.0 | 1266 | $1,899 | $1.50 | 5d | 1 | 1.27mi |
| 9022 N 63rd Dr Glendale, AZ | 3.0 | 2.0 | 1401 | $2,195 | $1.57 | 13d | 1 | 1.28mi |
| 7040 W Olive Ave Peoria, AZ | 2.0 | 2.0 | 953 | $1,465 | $1.54 | 5d | 1 | 1.34mi |
| 5625 W Sunnyside Dr Glendale, AZ | 3.0 | 2.0 | 1192 | $1,850 | $1.55 | 5d | 1 | 1.38mi |
| 8938 N 64th Ln Glendale, AZ | 3.0 | 2.0 | 1256 | $2,095 | $1.67 | 1d | 1 | 1.39mi |
| 6201 W Olive Ave Unit B1 Glendale, AZ | 2.0 | 1.0 | 759 | $1,225 | $1.61 | 1d | 1 | 1.43mi |
| 9903 N 77th Ave Peoria, AZ | 3.0 | 2.0 | 1446 | $1,895 | $1.31 | 4d | 1 | 1.43mi |
| 5648 W Mountain View Rd Glendale, AZ | 3.0 | 2.0 | 1380 | $2,095 | $1.52 | 13d | 1 | 1.46mi |
| 9205 N 59th Ave Unit 108 Glendale, AZ | 2.0 | 2.0 | 1238 | $1,600 | $1.29 | 44d | 1 | 1.47mi |
| 6201 W Olive Ave Glendale, AZ | 2.0 | 1.0 | 759 | $1,445 | $1.90 | 22d | 1 | 1.49mi |
Listing history 10 events
-
2026-06-18days on market $74,000 Active 14 DOM
-
2026-06-17days on market $74,000 Active 13 DOM
-
2026-06-16days on market $74,000 Active 12 DOM
-
2026-06-15days on market $74,000 Active 11 DOM
-
2026-06-13days on market $74,000 Active 9 DOM
-
2026-06-13days on market $74,000 Active 8 DOM
-
2026-06-09days on market $74,000 Active 5 DOM
-
2026-06-08days on market $74,000 Active 4 DOM
-
2026-06-07remarks 457-char remark
-
2026-06-07$74,000 Active 3 DOM
ⓘ Source: listings_history table (triggers on properties + properties_extension) + one-shot
backfill from property_details.listing_events for pre-trigger history.
Climate risk First Street
- Flood 1/10 Low FEMA zone X (shaded) · 0% chance over 30 yrs
- Wildfire 1/10 Low
- Heat 9/10 Extreme 6 d/yr ≥112°F today · 17 d/yr by 30 yrs out
- Wind 1/10 Low
- Air quality 3/10 Moderate 3 unhealthy d/yr today · 3 by 30 yrs out
Nearby sold comps map
Loading sold comps map…
Walkable amenities ~0.75 mi
Loading nearby amenities…
Taxation est. · year 1
- Rental income
- $21,842
- − Mortgage interest
- −$2,898
- − Property taxes
- −$776
- − Insurance
- −$259
- − Repairs & maintenance
- −$1,747
- − Management
- −$1,747
- − Depreciation
- −$1,505
- Taxable income
- $12,909
- Est. tax owed @ 24.0%
- −$3,098
- After-tax cash flow
- $9,866/yr
For passive investors: Depreciation is non-cash, so a rental often shows a tax loss while cash-flowing — sheltering income. Rental losses are passive: they offset passive income freely, and up to $25,000/yr can offset ordinary (W-2) income if you actively participate and your MAGI is under $100k (phasing out to $0 by $150k); unused losses carry forward. On sale, claimed depreciation is recaptured at up to 25%, and gains may owe capital-gains tax (a 1031 exchange can defer both). Figures are a year-1 estimate at your 24.0% rate — not tax advice; consult a CPA.
Condition & rehab AI · 14 photos
The home is in good condition with a well-maintained exterior and interior. It has a good foundation and structure, and the HVAC and mechanical systems appear to be in good condition. The home is move-in ready and has a good curb appeal.
Value-add opportunities
- Resale Paint the exterior — Painting the exterior can enhance the home's curb appeal and make it more attractive to potential buyers.
- Both Upgrade the flooring — Upgrading the flooring can improve the home's overall appearance and increase its value for both resale and rental.
Renovation cost estimate screening
Value-add ROI direction
- Resale Paint the exterior — Painting the exterior can enhance the home's curb appeal and make it more attractive to potential buyers. ↑
- Both Upgrade the flooring — Upgrading the flooring can improve the home's overall appearance and increase its value for both resale and rental. ↑
ⓘ Cost ranges are severity-bucket heuristics (US national rule-of-thumb). Get contractor quotes + a written scope before underwriting a rehab budget.
Schools (NCES district)
- District
- Peoria Unified School District (4237)
- NCES district ID
- 0406250
- Math proficiency
- 36% ▼ -14.00%
- Reading proficiency
- 42% ▼ -8.00%
- Median HH income
- $60,171
- Composite
- 34.62/100
- National rank
- #5152
- State rank
- #64 of 249 in AZ
Livability — Peoria
- Score
- 76/100
- State rank
- #14
- US rank
- #3603
Category grades
Schools grade is shown separately in the Schools card above.
Census & demographics
- Census place
- Peoria, AZ
- County
- Maricopa County · 4,537,380 people
- City population
- 206,687
- Metro
- Phoenix-Mesa-Chandler, AZ
- Population (ZIP)
- 29,861
- Household income
- $86,927
- Rent vs Own
- Severe rent burden
- 640.0
Population outlook (Maricopa County) Hauer SSP2
- Today (2025)
- 4,979,203 people
- By 2030
- 5,378,229 · +8.0%
- By 2040
- 6,156,598 · +23.6%
- By 2050
- 6,872,376 · +38.0%
- By 2075
- 8,401,270 · +68.7%
- By 2100
- 9,247,439 · +85.7%
Race, ethnicity, and origin ACS 2023
- Neighborhood character
- Majority White (61%)
- Race & ethnicity
- White 61% Hispanic / Latino 30% Two or more races 16% Black 2% Asian 2% Native American 2%
- Hispanic origin (detail)
- Mexican 24%
- Common ancestry
- Lithuanian 3% Romanian 2% Portuguese 2%
- Foreign-born
- 7% · Canada, Vietnam, China
- Languages at home
- 83% English-only · Spanish 14% Other Indo-European 1% Vietnamese 1%
Political lean MEDSL · Maricopa
- 2024 margin
- Toss-up / Even · D 47.7% · R 51.2% · Other 1.1%
- 2008→2024 swing
- +7.1pp toward D · 2008: -10.6pp · 2024: -3.5pp
- All cycles
- 2024: R+3.5 2020: D+2.2 2016: R+3.5 2012: R+12.0 2008: R+10.6
Not yet ingested
- Civics
- —
Market trends
- HPI YoY
- ▼ -259.68%
- Current HPI
- 310.0679
- Rent YoY
- ▼ -1.30%
- Metro
- Phoenix-Mesa-Chandler, AZ
- State GDP YoY
- ▲ 4.54%
- F500 in state
- 20
Industry mix (Fortune 500 HQ in AZ)
| Industry | F500 HQs | Revenue |
|---|---|---|
| Technology | 2 | $13B |
|
||
| Mining / Metals | 1 | $23B |
|
||
| Environmental Services | 1 | $16B |
|
||
| Metals / Steel | 1 | $14B |
|
||
| Technology Distribution | 1 | $9B |
|
||
| Homebuilding | 1 | $8B |
|
||
Cash-flow waterfall
monthlySold comps — $/sqft
last 12 mo · ≤1 miLoading sold comps…