8811 Canoga Park Ave #512 · Los Angeles, CA
Flood risk 4/10 · Minor
- FEMA flood zone
- X (unshaded)
- Chance of flooding over 30 yrs
- 0.22%
- Est. flood insurance / yr
- $507 – $1,088
Fire risk 5/10 · Moderate
- Est. fire insurance / yr
- $659 – $1,223
Heat risk 5/10 · Moderate
- Hot days now (above 103°F)
- 7 days/yr
- Hot days in 30 yrs
- 19 days/yr
Wind risk 1/10 · Minimal
- Chance of severe wind over 30 yrs
- —
Air-quality risk 4/10 · Minor
- Unhealthy air days now
- 5 days/yr
- Unhealthy air days in 30 yrs
- 7 days/yr
Risk factors via First Street. Map © Google.
Why this score? — see what drove the B grade
The composite is a weighted blend of 9 inputs, each scored 0–100. Each bar is that input's sub-score; the figure is the points it added to the 100-point composite (weight × sub-score).
- Cash flow +30.0/30.0
- ARV discount +12.9/15.0
- 1% rule +10.0/10.0
- DSCR +10.0/10.0
- Schools +3.6/10.0
- Livability +3.4/5.0
- Condition / age +2.2/5.0
- Rent growth +1.7/5.0
- Appreciation +0.0/10.0
$185,000
🖨 Deal sheet 📄 Offer letter ✓ Due diligence
Listing remarks
A BIT OF TLC AND YOU’VE GOT YOUR HOME SWEET HOME! OPEN FLOOR PLAN WITH ABUNDANT SPACE FEATURES INCLUDE: A bright welcome into the grand living room which flows seamlessly into the formal dining room, exhibiting a lovely built-in display with buffet. The roomy kitchen with generous counter space and cabinetry invites more than one cook to this kitchen. Built in Shelving flanks the wall of the Large Den/(Bonus) Room with a welcomed purpose. Primary and Guest Bedrooms are abundantly spacious. Guest Bedroom has a large walk-in closet. The Primary Bath presents with a soaking tub, dual vanities, while the guest Bath has a large double walk in shower. The Enclosed Porch/Sun Room. Can al
Key facts
- Open floor plan
- Built in display
- Large den
Tags
Property features AI
Finance
- Other: Park name: Canoga Mobile Estates; Pets allowed with breed restrictions
- Financial info: Monthly land lease: $1,111.11
- HOA & community: Senior community; Land lease (park) with monthly amount
Exterior
- Parking: 2 covered carport spaces (attached); 2 garage spaces; Total of 4 parking spaces; Paved road access; Located in Canoga Mobile Estates
- Utilities: Public sewer; District/public water
- Home design: Single-story; Mobile home (24 ft x 60 ft); Mobile home remains on site; Has a view; Urban community
- Construction: Vinyl construction material; Metal/other roof; Quake bracing and pier jacks foundation; Property condition: repairs cosmetic
- Exterior features: In-ground community pool; Shed (2); Vinyl skirt
Interior
- Kitchen: Microwave; Refrigerator; Gas range
- Bedrooms: All bedrooms on the main level
- Bathrooms: 2 full bathrooms
- Heating & cooling: Central heating (furnace); Central cooling
- Interior features: Sliding glass door(s); Closed-circuit TV; Carbon monoxide detector(s); Smoke detector; Resident manager; Community spa
- Laundry & utility: Inside laundry room; Washer and dryer included; Washer hookup; Gas dryer hookup; Individual laundry room
Neighborhood map
What this means for you Summary
Snapshot
- This is a 2-bed/2.0-bath manufactured listed at $185k. Condition is rated fair.
Deal economics
- At list price, monthly cash flow is $1k ($15k/yr) — positive.
- The deal already cash-flows at list — no discount required.
- Meets the 1% rule at list price ($3k rent vs $185k).
- Recommended offer: $182k (1.5% below list) — sets the bar for market timing.
- Cap rate 14.6% vs local median 2.1% in Los Angeles — top-decile yield for the area; either an underpriced asset or a hidden risk that comps aren't pricing in. Stress-test before assuming the spread holds.
Location & tenants
- Location reads 68/100 on livability (#273 in CA) — a middle-class / working-renter tenant base. Strengths: amenities A+, commute A+, employment B; Watch: health & safety C-, schools D+, crime F.
- Los Angeles Unified (urban): math 29% / reading 54% proficiency, ranked #223 of 517 in CA (top 43%) — families likely to look elsewhere, expect single-tenant / working-renter base with shorter leases; 67% free/reduced lunch — lower-income household profile, screen leases tightly.
- Market conditions: Rents falling (-3.2%/yr); 122 active listings in the ZIP; 40 comparable units currently listed for rent nearby; rentals at typical pace (median 25d on market — plan ~3-4 weeks tenant-placement turnaround); solid renter incomes; 19,697 units permitted in Los Angeles County in 2024 (9,426 in 5+ unit buildings).
- This rent runs 40% of the median local income ($90k/yr) — at the standard rent-burdened threshold; future hikes will face affordability resistance.
Forward outlook
- Local home prices are declining (-3.0%/yr); year-one equity from $1k of loan paydown is wiped out by about $6k of value loss. Plan a longer hold.
- Los Angeles County population projected at +9% by 2050 — modest demand growth; plan on rents tracking national, not racing it.
- At projected returns (-3.0% appreciation + 0.0% rent growth), your $52k cash investment doubles in ~5 years — after that, you're playing with house money.
Negotiation context
- It's been on market 28 days — a 2% lower offer ($182k) is reasonable based on typical stale-listing flexibility.
Risks & watch-outs
- Climate carrying-cost: moderate wildfire risk; extreme-heat days projected 7→19/yr by 2055 (HVAC capex compounding) — expect insurance premiums to compound above CPI over the hold.
Questions for the listing agent
- Have any recent inspections been done? Can we get a copy of the seller's disclosures and any deferred-maintenance estimates?
- Built in 1971 — when were the roof, HVAC, electrical panel, plumbing, and water heater last replaced?
- Is there a deadline driving the sale (1031 exchange, divorce, estate, relocation)? That informs how much negotiation room exists.
- Schools are D-rated, which usually means shorter tenancies and higher turnover. Who's the typical renter profile here, and what's been the actual vacancy rate?
- Crime grade is F in this area — have there been break-ins, vandalism, or insurance claims at this property in the last 3 years? What carrier currently insures it and at what premium?
- What's the average days-on-market for RENTAL listings here right now (not sales)? A rising rental-DOM trend means longer vacancies and softer asking-rent achievability than the comps imply.
- What's the recent tenant-quality profile in this submarket — average credit score on applications, eviction rate, late-payment / NSF rate, and stable-employment percentage? A property-management company in the area should have these aggregated.
- How much new for-sale + rental construction is in the pipeline within 1–3 miles? Heavy new supply typically softens prices + rents 12–24 months out; constrained supply supports both.
Investment metrics
- 1% rule
- 1.62% ✓
- Cap rate
- 14.57%
- Cash-on-cash
- 29.57%
- DSCR
- 2.32
- GRM
- 5.2
CMA / ARV
- ARV (on-the-fly)
- $210,240
- Comps found
- 12
Show comp detail 12 sales within ~0.75 mi
| Address | Dist | Beds/Ba | Sqft | Sold | Price | $/sf | Match |
|---|---|---|---|---|---|---|---|
| 8811 Canoga Ave #106 | 0.00mi | 2/2.0 | 1,440 (0%) | 9mo | $190,000 | $132 | 93 |
| 8811 Canoga Ave #208 | 0.00mi | 2/2.0 | 1,400 (-3%) | 8mo | $205,000 | $146 | 89 |
| 8811 Canoga Ave #383 | 0.00mi | 2/2.0 | 1,344 (-7%) | 2mo | $165,000 | $123 | 87 |
| 8801 Eton Ave #53 | 0.29mi | 2/2.0 | 1,440 (0%) | 2mo | $193,500 | $134 | 85 |
| 8811 Canoga Ave #371 | 0.00mi | 2/2.0 | 1,344 (-7%) | 6mo | $220,000 | $164 | 84 |
| 8901 Eton Ave #5 | 0.32mi | 2/2.0 | 1,440 (0%) | 7mo | $190,125 | $132 | 79 |
| 8811 Canoga Ave #543 | 0.00mi | 3/2.0 (+1) | 1,568 (+9%) | 5mo | $180,000 | $115 | 76 |
| 8801 Eton #99 #99 | 0.29mi | 2/2.0 | 1,536 (+7%) | 0mo | $273,000 | $178 | 75 |
| 8801 Eton Ave #123 | 0.26mi | 3/2.0 (+1) | 1,500 (+4%) | 7mo | $382,201 | $255 | 70 |
| 8800 Eton Ave #39 | 0.30mi | 2/2.0 | 1,344 (-7%) | 9mo | $155,000 | $115 | 67 |
| 8801 Eton #131 | 0.26mi | 2/2.0 | 1,300 (-10%) | 8mo | $223,000 | $172 | 64 |
| 11401 Topanga #73 | 0.57mi | 3/2.0 (+1) | 1,265 (-12%) | 6mo | $229,000 | $181 | 43 |
Match score weights: distance 35% · size 25% · config 20% · recency 20%. Top-matched comps best support the ARV.
Projected returns pro-forma
-3.0% appreciation · 0.0% rent growth · sell at horizon
- IRR
- 20.9%
- Equity multiple
- 1.82×
- Total profit
- $42,495
- Equity at exit
- $27,584
- IRR
- 27.1%
- Equity multiple
- 3.08×
- Total profit
- $107,549
- Equity at exit
- $15,995
Cash invested: $51,800 (down + closing). Projections, not guarantees.
Landlord ↔ Tenant lean methodology
- Overall (CITY)
- 0 Strongly Tenant-Friendly
- State California
- 18 Strongly Tenant-Friendly · D+13
- County
- — inherits STATE
- City Los Angeles
- 0 Strongly Tenant-Friendly · D+22
ZIP-level market 91304
- Rents YoY
- -3.2%
- Active inventory
- 122
- Price-to-rent
- 5.2×
Monthly cashflow live
- Estimated rent
- $2,989 high interval (Pro) →
- Mortgage (P&I)
- −$970
- Tax from tax record
- −$37 /mo · $446/yr
- Insurance
- −$77
- HOA
- −$0
- Vacancy / Maint / Mgmt
- −$628
- Net cashflow
- $1,277
Break-even live
UW: 25.0% down · 7.5% · 30yr · 1.5% tax · 5.0% vac · 8.0% maint · 8.0% mgmt
Financing live
Cash to close
- Down payment
- $46,250
- Closing costs
- $5,550
- Reserves months
- —
- Total cash needed
- —
Loan-product check · same deal, 3 products live
Conventional
25% down · 7.5% · 30yr
- Down + closing
- —
- Monthly P&I
- —
- Monthly cashflow
- —
- DSCR
- —
- Eligible?
- —
Personal DTI + credit; lowest rate.
DSCR
20% down · 8.5% · 30yr
- Down + closing
- —
- Monthly P&I
- —
- Monthly cashflow
- —
- DSCR
- —
- Eligible?
- —
No personal income docs; deal must DSCR.
Hard money
10% down · 12.0% · 12mo
- Down + closing
- —
- Monthly P&I
- —
- Monthly cashflow
- —
- DSCR
- —
- Eligible?
- —
Short-term bridge; refi at stabilization.
Rent comps 40 comps
| Address | Beds | Baths | Sqft | Rent | $/sqft | DOM | Units | Dist |
|---|---|---|---|---|---|---|---|---|
| 8750 Topanga Canyon Blvd Unit 6 Canoga Park, CA | 2.0 | 2.0 | 900 | $2,195 | $2.44 | 16d | 1 | 0.17mi |
| 8601 International Ave Canoga Park, CA | 2.0–3.0 | 2.0 | 980 | $2,300 | $2.35 | 24d | 2 | 0.27mi |
| 21350 Parthenia St Unit 108 Canoga Park, CA | 2.0 | 2.0 | 1000 | $2,495 | $2.50 | 16d | 1 | 0.29mi |
| 21731 Bryant St Canoga Park, CA | 3.0 | 2.0 | 1400 | $4,150 | $2.96 | 12d | 1 | 0.29mi |
| 8719 Variel Ave Canoga Park, CA | 1.0–3.0 | 1.0–2.0 | 948 | $2,532 | $2.67 | 7d | 3 | 0.43mi |
| 21040 Parthenia St #29 Canoga Park, CA | 2.0 | 2.5 | 1065 | $2,700 | $2.54 | 43d | 1 | 0.50mi |
| 21031 Parthenia St Canoga Park, CA | 1.0–2.0 | 1.0–2.0 | 905 | $2,584 | $2.86 | 2d | 9 | 0.50mi |
| 8865 Independence Ave #26 Canoga Park, CA | 3.0 | 2.5 | 1651 | $3,595 | $2.18 | 43d | 1 | 0.50mi |
| 9101 Topanga Canyon Blvd Chatsworth, CA | 2.0 | 2.0 | 1022 | $2,620 | $2.56 | 7d | 1 | 0.55mi |
| 8710 Independence Ave #301 Canoga Park, CA | 2.0 | 2.0 | 1134 | $2,250 | $1.98 | 24d | 1 | 0.57mi |
| 21000 Bryant St #6 Canoga Park, CA | 2.0 | 2.0 | 992 | $2,600 | $2.62 | 24d | 1 | 0.59mi |
| 8414 Owensmouth Ave Canoga Park, CA | 3.0 | 2.0 | 1341 | $3,995 | $2.98 | 24d | 1 | 0.59mi |
| 8761 De Soto Ave Canoga Park, CA | 1.0–3.0 | 1.5–2.5 | 1025 | $2,920 | $2.85 | 2d | 8 | 0.65mi |
| 20909 Parthenia St Canoga Park, CA | 1.0–2.0 | 1.0–1.5 | 745 | $2,438 | $3.27 | 1d | 6 | 0.66mi |
| 8409 Topanga Canyon Blvd West Hills, CA | 3.0 | 3.0 | 1144 | $5,000 | $4.37 | 43d | 1 | 0.70mi |
| 8700 De Soto Ave Canoga Park, CA | 1.0–2.0 | 1.0–2.0 | 775 | $2,695 | $3.48 | 1d | 2 | 0.70mi |
| 21019 Hackney St Canoga Park, CA | 3.0 | 2.0 | 1590 | $4,200 | $2.64 | 3d | 1 | 0.73mi |
| 21535 Roscoe Blvd Canoga Park, CA | 2.0–3.0 | 2.0 | 1309 | $3,024 | $2.31 | 1d | 3 | 0.73mi |
| 21501 Roscoe Blvd Canoga Park, CA | 2.0 | 2.0 | 1240 | $2,775 | $2.24 | 2d | 2 | 0.74mi |
| 20957 Community St Unit A Canoga Park, CA | 2.0 | 1.0 | 1002 | $3,200 | $3.19 | 24d | 1 | 0.81mi |
| 21809 Lanark St Canoga Park, CA | 2.0 | 1.5–2.0 | 900 | $1,920 | $2.13 | 20d | 2 | 0.91mi |
| 20645 Roscoe Blvd Unit E Winnetka, CA | 3.0 | 3.0 | 1586 | $4,800 | $3.03 | 43d | 1 | 1.18mi |
| 9733 Topanga Canyon Blvd Chatsworth, CA | 2.0–3.0 | 2.0 | 1204 | $2,935 | $2.44 | 2d | 4 | 1.19mi |
| 22337 Cantara St Canoga Park, CA | 3.0 | 2.0 | 1431 | $3,950 | $2.76 | 43d | 1 | 1.19mi |
| 20432 Gresham St Winnetka, CA | 3.0 | 2.0 | 1313 | $3,795 | $2.89 | 43d | 1 | 1.22mi |
| 7900 Topanga Canyon Blvd #15 Canoga Park, CA | 2.0 | 3.0 | 1558 | $3,550 | $2.28 | 2d | 1 | 1.24mi |
| 8605 Delco Ave Winnetka, CA | 3.0 | 3.0 | 1130 | $4,200 | $3.72 | 43d | 1 | 1.25mi |
| 8603 Delco Ave Winnetka, CA | 3.0 | 2.5 | 1130 | $3,500 | $3.10 | 43d | 1 | 1.25mi |
| 7948 De Soto Ave Canoga Park, CA | 3.0 | 3.0 | 1383 | $3,750 | $2.71 | 43d | 1 | 1.28mi |
| 7826 Topanga Canyon Blvd Canoga Park, CA | 2.0 | 2.0 | 920 | $2,675 | $2.91 | 24d | 2 | 1.28mi |
| 8015 McNulty Ave Winnetka, CA | 3.0 | 2.0 | 1447 | $4,250 | $2.94 | 3d | 1 | 1.32mi |
| 8220 Kentland Ave West Hills, CA | 3.0 | 2.0 | 1370 | $4,500 | $3.28 | 43d | 1 | 1.34mi |
| 8220 Kentland Ave West Hills, CA | 3.0 | 2.0 | 1370 | $4,500 | $3.28 | 24d | 1 | 1.34mi |
| 21700 Septo St Unit D108 Chatsworth, CA | 2.0 | 2.0 | 1200 | $2,495 | $2.08 | 43d | 1 | 1.37mi |
| 21700 Septo St Chatsworth, CA | 2.0 | 2.0 | 1200 | $2,545 | $2.12 | 15d | 4 | 1.37mi |
| 21700 Septo St Unit D207 Chatsworth, CA | 2.0 | 2.0 | 1200 | $2,595 | $2.16 | 16d | 1 | 1.37mi |
| 7744 Vassar Ave Canoga Park, CA | 2.0 | 2.5 | 1142 | $3,750 | $3.28 | 24d | 1 | 1.38mi |
| 7800 Topanga Canyon Blvd Canoga Park, CA | 2.0 | 2.0 | 1036 | $2,500 | $2.41 | 24d | 1 | 1.40mi |
| 9950 California 27 Unit 26 Chatsworth, CA | 3.0 | 2.5 | 1474 | $3,550 | $2.41 | 19d | 1 | 1.41mi |
| 9950 California 27 Unit 26 Chatsworth, CA | 3.0 | 2.5 | 1474 | $3,550 | $2.41 | 43d | 1 | 1.41mi |
Listing history 15 events
-
2026-06-18days on market $185,000 Active 28 DOM
-
2026-06-17days on market $185,000 Active 27 DOM
-
2026-06-16days on market $185,000 Active 26 DOM
-
2026-06-16price $185,000 Active 25 DOM
-
2026-06-15days on market $189,500 Active 25 DOM
-
2026-06-13days on market $189,500 Active 23 DOM
-
2026-06-09days on market $189,500 Active 19 DOM
-
2026-06-08days on market $189,500 Active 18 DOM
-
2026-06-07days on market $189,500 Active 17 DOM
-
2026-06-04days on market $189,500 Active 14 DOM
-
2026-06-03days on market $189,500 Active 13 DOM
-
2026-06-02days on market $189,500 Active 12 DOM
-
2026-06-01days on market $189,500 Active 11 DOM
-
2026-05-31days on market $189,500 Active 10 DOM
-
2026-05-21$189,500 Active
ⓘ Source: listings_history table (triggers on properties + properties_extension) + one-shot
backfill from property_details.listing_events for pre-trigger history.
Tax reassessment forecast CA · Resets to sale price
- Current annual tax
- $446 · $37/mo
- Projected year-2 tax
- $1,406 · $117/mo
- Expected delta
- +$960/yr (+$80/mo · 215.2%)
ⓘ Screening estimate from a state-policy table — verify with the county assessor before closing.
Climate risk First Street
- Flood 4/10 Moderate FEMA zone X (unshaded) · 22% chance over 30 yrs
- Wildfire 5/10 Major
- Heat 5/10 Major 7 d/yr ≥103°F today · 19 d/yr by 30 yrs out
- Wind 1/10 Low
- Air quality 4/10 Moderate 5 unhealthy d/yr today · 7 by 30 yrs out
Nearby sold comps map
Loading sold comps map…
Walkable amenities ~0.75 mi
Loading nearby amenities…
Taxation est. · year 1
- Rental income
- $35,863
- − Mortgage interest
- −$10,363
- − Property taxes
- −$446
- − Insurance
- −$925
- − Repairs & maintenance
- −$2,869
- − Management
- −$2,869
- − Depreciation
- −$5,382
- Taxable income
- $13,009
- Est. tax owed @ 24.0%
- −$3,122
- After-tax cash flow
- $12,197/yr
For passive investors: Depreciation is non-cash, so a rental often shows a tax loss while cash-flowing — sheltering income. Rental losses are passive: they offset passive income freely, and up to $25,000/yr can offset ordinary (W-2) income if you actively participate and your MAGI is under $100k (phasing out to $0 by $150k); unused losses carry forward. On sale, claimed depreciation is recaptured at up to 25%, and gains may owe capital-gains tax (a 1031 exchange can defer both). Figures are a year-1 estimate at your 24.0% rate — not tax advice; consult a CPA.
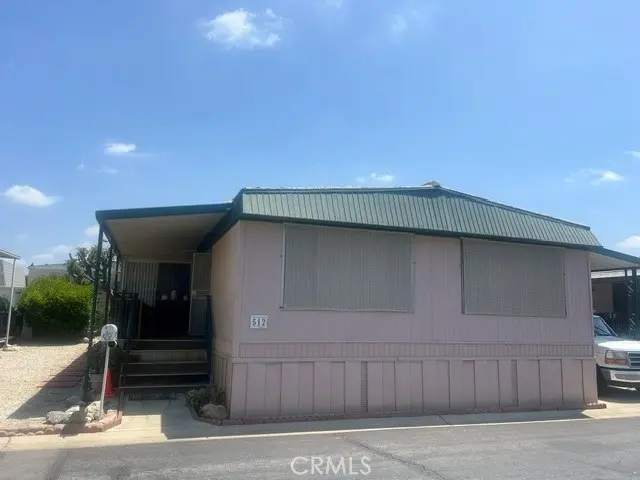
Condition & rehab AI · 1 photo
The home requires moderate exterior repairs and some interior touch-ups to improve its curb appeal and value.
Repairs flagged
- Moderate exterior siding — Significant weathering and discoloration
- Minor interior walls — Some discoloration
Value-add opportunities
- Both paint exterior siding — Enhances curb appeal and resale value
- Both paint interior walls — Improves interior appearance and rental appeal
Renovation cost estimate screening
| Repair item | Severity | Est. cost |
|---|---|---|
| exterior siding · Significant weathering and discoloration | Moderate | $3,000–15,000 |
| interior walls · Some discoloration | Minor | $500–3,000 |
| Total estimated repair cost · 2 items | $3,500–18,000 |
Value-add ROI direction
- Both paint exterior siding — Enhances curb appeal and resale value ↑
- Both paint interior walls — Improves interior appearance and rental appeal ↑
ⓘ Cost ranges are severity-bucket heuristics (US national rule-of-thumb). Get contractor quotes + a written scope before underwriting a rehab budget.
Schools (NCES district)
- District
- Los Angeles Unified
- NCES district ID
- 0622710
- Math proficiency
- 29% ▼ -4.00%
- Reading proficiency
- 54% ▲ 10.00%
- Median HH income
- $50,403
- Composite
- 35.67/100
- National rank
- #4875
- State rank
- #223 of 517 in CA
Livability — Los Angeles
- Score
- 68/100
- State rank
- #273
- US rank
- #9237
Category grades
Schools grade is shown separately in the Schools card above.
Census & demographics
- Census place
- Los Angeles, CA
- County
- Los Angeles County · 9,444,647 people
- City population
- 3,838,149
- Metro
- Los Angeles-Long Beach-Anaheim, CA
- Population (ZIP)
- 52,474
- Household income
- $90,007
- Rent vs Own
- Severe rent burden
- 2821.0
Population outlook (Los Angeles County) Hauer SSP2
- Today (2025)
- 10,940,515 people
- By 2030
- 11,256,481 · +2.9%
- By 2040
- 11,729,929 · +7.2%
- By 2050
- 11,948,407 · +9.2%
- By 2075
- 11,818,114 · +8.0%
- By 2100
- 10,842,928 · -0.9%
Race, ethnicity, and origin ACS 2023
- Neighborhood character
- Diverse neighborhood (Simpson 0.69)
- Race & ethnicity
- Hispanic / Latino 42% White 32% Asian 17% Two or more races 11% Black 4%
- Hispanic origin (detail)
- Mexican 26%
- Common ancestry
- Scotch-Irish 2% Romanian 2% Slovak 1%
- Foreign-born
- 38% · Canada, Vietnam, China
- Languages at home
- 45% English-only · Spanish 34% Other Indo-European 8% Tagalog/Filipino 4%
Political lean MEDSL · Los Angeles
- 2024 margin
- Solid D (+32.9) · D 64.8% · R 31.9% · Other 3.3%
- 2008→2024 swing
- -7.4pp toward R · 2008: 40.4pp · 2024: 32.9pp
- All cycles
- 2024: D+32.9 2020: D+44.2 2016: D+48.0 2012: D+40.0 2008: D+40.4
Not yet ingested
- Civics
- —
Market trends
- HPI YoY
- ▼ -805.65%
- Current HPI
- 351.4216
- Rent YoY
- ▼ -3.21%
- Metro
- Los Angeles-Long Beach-Anaheim, CA
- State GDP YoY
- ▲ 3.21%
- F500 in state
- 116
Industry mix (Fortune 500 HQ in CA)
| Industry | F500 HQs | Revenue |
|---|---|---|
| Technology | 27 | $1,492B |
|
||
| Financial Services | 3 | $174B |
|
||
| Retail | 3 | $44B |
|
||
| Insurance | 3 | $26B |
|
||
| Media / Entertainment | 2 | $115B |
|
||
| Pharmaceuticals / Biotech | 2 | $62B |
|
||
Price history
1 event — show timeline
- 2026-05-21 Listed $189,500 CRMLS
Property tax history
+24.6%/yrLatest (2025): $446 · +24.6% YoY. Source: county tax records.
Cash-flow waterfall
monthlySold comps — $/sqft
last 12 mo · ≤1 miLoading sold comps…