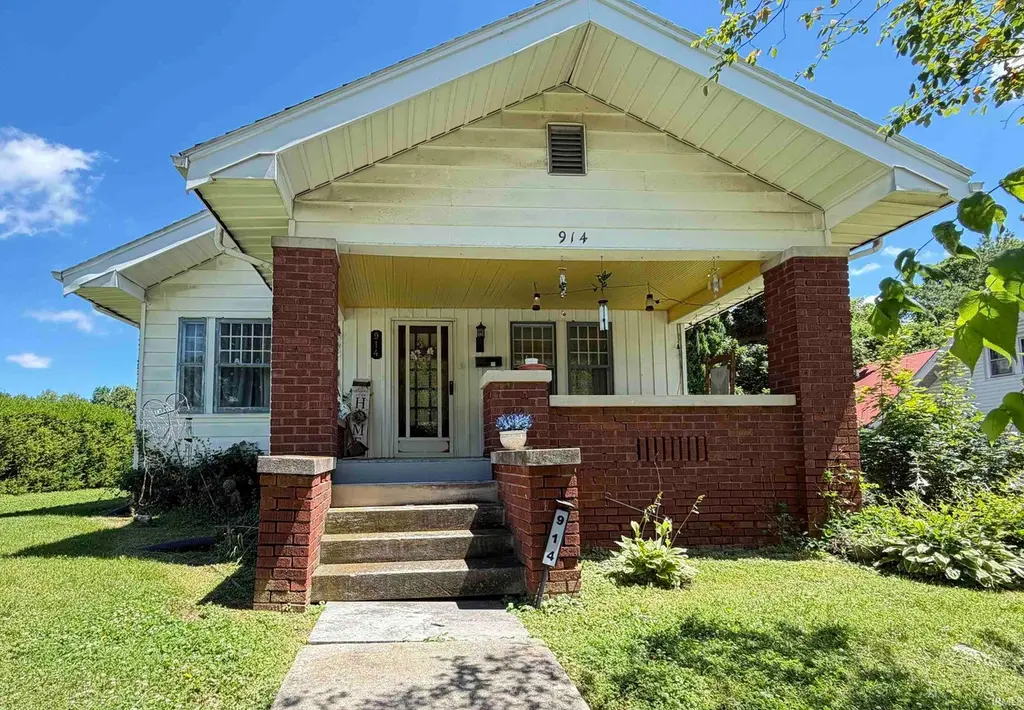
914 W Main St · Ellettsville, IN
Flood risk 1/10 · Minimal
- FEMA flood zone
- X (unshaded)
- Chance of flooding over 30 yrs
- 0.0%
- Est. flood insurance / yr
- $473 – $860
Fire risk 2/10 · Minimal
- Est. fire insurance / yr
- $717 – $1,331
Heat risk 4/10 · Minor
- Hot days now (above 104°F)
- 7 days/yr
- Hot days in 30 yrs
- 18 days/yr
Wind risk 2/10 · Minimal
- Chance of severe wind over 30 yrs
- 1.0%
Air-quality risk 1/10 · Minimal
- Unhealthy air days now
- 0 days/yr
- Unhealthy air days in 30 yrs
- 0 days/yr
Risk factors via First Street. Map © Google.
Why this score? — see what drove the C grade
The composite is a weighted blend of 9 inputs, each scored 0–100. Each bar is that input's sub-score; the figure is the points it added to the 100-point composite (weight × sub-score).
- Cash flow +20.4/30.0
- ARV discount +15.0/15.0
- DSCR +6.5/10.0
- 1% rule +4.7/10.0
- Schools +4.0/10.0
- Livability +3.5/5.0
- Rent growth +2.5/5.0
- Condition / age +2.5/5.0
- Appreciation +0.0/10.0
$139,900
🖨 Deal sheet (PDF) 📄 Offer letter ✓ Due diligence
Listing remarks
Bring your vision and restore the charm of this classic bungalow located in the heart of Ellettsville. Offering 2 bedrooms, 1 bath, a detached garage, full basement, and a spacious lot, this home is filled with character and opportunity. Inside, you'll find original hardwood floors, built-in shelving, generous living and dining spaces, and a cozy reading nook that showcases the home's vintage appeal. The covered front porch provides the perfect spot to relax and enjoy small-town living. While the property does need TLC and updating, it offers solid potential for investors, renovators, or buyers looking to create a home of their own. Conveniently located near schools, parks, shopping, and di
Key facts
- 0.28 acre lot
- Garage
- Built 1927
Property features AI
Exterior
- Parking: Detached garage with gravel and concrete access; Garage door opener; 1 garage space
- Utilities: Public water; Public sewer
- Home design: Single-family residence (site-built); One story
- Construction: Aluminum siding and brick exterior; Shingle roof; Stone foundation; Built as a site-built home
- Exterior features: Covered, enclosed porch; Sidewalks (community)
Interior
- Kitchen: Microwave; Refrigerator; Gas range
- Bedrooms: Bedrooms located on main level
- Flooring: Hardwood; Carpet
- Bathrooms: 1 full bathroom on the main level
- Heating & cooling: Natural gas forced-air heating; Ceiling fans; Window air conditioning units
- Interior features: Ceiling fans; Eat-in kitchen; Living room fireplace (1)
- Laundry & utility: Washer hookup on main level; Electric dryer hookup
Neighborhood map
What this means for you Summary
Snapshot
- This is a 2-bed/1.0-bath single-family listed at $140k.
Deal economics
- At list price, monthly cash flow is $182 ($2k/yr) — positive.
- The deal already cash-flows at list — no discount required.
- To meet the 1% rule (rent ≥ 1% of price), the offer needs to be $135k (3.4% below list).
- Recommended offer: $135k (3.4% below list) — sets the bar for 1% rule.
- Cap rate 7.9% vs local median 3.3% in Ellettsville — top-decile yield for the area; either an underpriced asset or a hidden risk that comps aren't pricing in. Stress-test before assuming the spread holds.
Location & tenants
- Location reads 70/100 on livability (#153 in IN) — a middle-class / working-renter tenant base. Strengths: cost of living A+, housing A+, crime A-; Watch: amenities F, commute F, health & safety F.
- Richland-Bean Blossom Community School Corporation (suburban): math 41% / reading 52% proficiency, ranked #82 of 301 in IN (top 27%) — families likely to look elsewhere, expect single-tenant / working-renter base with shorter leases.
- Zoned schools: Edgewood Primary School (650 students, 38% FRL); Edgewood Junior High School (math 30% / reading 51%, grade F, #117 of 330 statewide, top 36%, 603 students, 40% FRL); Edgewood High School (math 42% / reading 77%, grade C+, #49 of 369 statewide, top 16%, 820 students, 33% FRL).
- Market conditions: 64 active listings in the ZIP; 2 comparable units currently listed for rent nearby; 872 units permitted in Monroe County in 2024 (663 in 5+ unit buildings).
Forward outlook
- Local home prices are declining (-3.0%/yr); year-one equity from $967 of loan paydown is wiped out by about $4k of value loss. Plan a longer hold.
- Monroe County population projected at +29% by 2050 — long-run rental-demand tailwind backs the buy-and-hold thesis.
Negotiation context
- Only 6 days on market — expect competitive offers; lowballing is unlikely to land.
Risks & watch-outs
- Watch-outs: built in 1927 — expect roof / HVAC / electrical / plumbing capex.
Questions for the listing agent
- Built in 1927 — when were the roof, HVAC, electrical panel, plumbing, and water heater last replaced?
- Is there a deadline driving the sale (1031 exchange, divorce, estate, relocation)? That informs how much negotiation room exists.
- What's the average days-on-market for RENTAL listings here right now (not sales)? A rising rental-DOM trend means longer vacancies and softer asking-rent achievability than the comps imply.
- What's the recent tenant-quality profile in this submarket — average credit score on applications, eviction rate, late-payment / NSF rate, and stable-employment percentage? A property-management company in the area should have these aggregated.
- How much new for-sale + rental construction is in the pipeline within 1–3 miles? Heavy new supply typically softens prices + rents 12–24 months out; constrained supply supports both.
Investment metrics
- 1% rule
- 0.97% ✗
- Cap rate
- 7.85%
- Cash-on-cash
- 5.56%
- DSCR
- 1.25
- GRM
- 8.6
CMA / ARV
- ARV (on-the-fly)
- $230,862
- Comps found
- 12
Show comp detail 12 sales within ~0.75 mi
| Address | Dist | Beds/Ba | Sqft | Sold | Price | $/sf | Match |
|---|---|---|---|---|---|---|---|
| 6473 W Mcneely St | 0.30mi | 3/1.0 (+1) | 1,022 (-4%) | 2mo | $265,000 | $259 | 73 |
| 220 S Walnut St | 0.21mi | 2/2.0 | 1,142 (+8%) | 0mo | $222,000 | $194 | 73 |
| 903 W Temperance St | 0.11mi | 2/1.0 | 974 (-8%) | 10mo | $207,500 | $213 | 73 |
| 311 N Kelli Dr | 0.45mi | 3/1.5 (+1) | 1,008 (-5%) | 2mo | $170,000 | $169 | 62 |
| 338 S Poplar Dr | 0.38mi | 3/1.0 (+1) | 950 (-10%) | 1mo | $230,000 | $242 | 59 |
| 344 Poplar Dr | 0.39mi | 3/1.0 (+1) | 950 (-10%) | 3mo | $213,000 | $224 | 57 |
| 312 S Poplar Ct | 0.31mi | 3/1.0 (+1) | 925 (-13%) | 3mo | $209,900 | $227 | 57 |
| 531 N Chandler Dr | 0.47mi | 3/2.0 (+1) | 1,032 (-2%) | 11mo | $225,000 | $218 | 56 |
| 408 W Association St | 0.29mi | 2/2.0 | 1,170 (+10%) | 11mo | $165,000 | $141 | 56 |
| 392 S Cedar Dr | 0.52mi | 3/1.0 (+1) | 975 (-8%) | 3mo | $212,000 | $217 | 56 |
| 520 W Hickory Dr | 0.71mi | 3/1.0 (+1) | 975 (-8%) | 7mo | $225,000 | $231 | 43 |
| 302 E Ritter St | 0.67mi | 3/1.0 (+1) | 988 (-7%) | 13mo | $204,900 | $207 | 41 |
Match score weights: distance 35% · size 25% · config 20% · recency 20%. Top-matched comps best support the ARV.
Projected returns pro-forma
-3.0% appreciation · 3.0% rent growth · sell at horizon
- IRR
- -7.7%
- Equity multiple
- 0.72×
- Total profit
- $-11,129
- Equity at exit
- $20,860
- IRR
- 1.8%
- Equity multiple
- 1.13×
- Total profit
- $5,088
- Equity at exit
- $12,096
Cash invested: $39,172 (down + closing). Projections, not guarantees.
Landlord ↔ Tenant lean methodology
- Overall (STATE)
- 90 Strongly Landlord-Friendly
- State Indiana
- 90 Strongly Landlord-Friendly · R+11
- County
- — inherits STATE
- City
- — inherits STATE
ZIP-level market 47429
- Home prices YoY
- -26.8%
- Active inventory
- 64
- Price-to-rent
- 8.6×
Monthly cashflow live
- Estimated rent
- $1,352 medium interval (Pro) →
- Mortgage (P&I)
- −$734
- Tax from tax record
- −$94 /mo · $1,130/yr
- Insurance
- −$58
- HOA
- −$0
- Vacancy / Maint / Mgmt
- −$284
- Net cashflow
- $182
Break-even live
Sensitivity live
| Price | -10% $261 | -5% $221 | +0% $182 | +5% $142 | +10% $102 |
|---|---|---|---|---|---|
| Rent | -10% $75 | -5% $128 | +0% $182 | +5% $235 | +10% $288 |
| Rate | -1.0pp $252 | -0.5pp $217 | base $182 | +0.5pp $145 | +1.0pp $109 |
UW: 25.0% down · 7.5% · 30yr · 1.5% tax · 5.0% vac · 8.0% maint · 8.0% mgmt
Financing live
Cash to close
- Down payment
- $34,975
- Closing costs
- $4,197
- Reserves months
- —
- Total cash needed
- —
Loan-product check · same deal, 3 products live
Conventional
25% down · 7.5% · 30yr
- Down + closing
- —
- Monthly P&I
- —
- Monthly cashflow
- —
- DSCR
- —
- Eligible?
- —
Personal DTI + credit; lowest rate.
DSCR
20% down · 8.5% · 30yr
- Down + closing
- —
- Monthly P&I
- —
- Monthly cashflow
- —
- DSCR
- —
- Eligible?
- —
No personal income docs; deal must DSCR.
Hard money
10% down · 12.0% · 12mo
- Down + closing
- —
- Monthly P&I
- —
- Monthly cashflow
- —
- DSCR
- —
- Eligible?
- —
Short-term bridge; refi at stabilization.
Rent comps 2 comps
| Address | Beds | Baths | Sqft | Rent | $/sqft | DOM | Units | Dist |
|---|---|---|---|---|---|---|---|---|
| 315 W Depot St Ellettsville, IN | 2.0 | 1.0 | 1200 | $1,450 | $1.21 | 22d | 1 | 0.60mi |
| 7219 W Susan St Unit 7235 Bloomington, IN | 2.0 | 1.5 | 763 | $1,200 | $1.57 | 22d | 1 | 0.76mi |
Listing history 7 events
-
2026-06-19days on market $139,900 Active 6 DOM
-
2026-06-18days on market $139,900 Active 5 DOM
-
2026-06-17days on market $139,900 Active 4 DOM
-
2026-06-16days on market $139,900 Active 3 DOM
-
2026-06-15days on market $139,900 Active 2 DOM
-
2026-06-14remarks 699-char remark
-
2026-06-14$139,900 Active 1 DOM
ⓘ Source: listings_history table (triggers on properties + properties_extension) + one-shot
backfill from property_details.listing_events for pre-trigger history.
Tax reassessment forecast IN · Partial reset (capped growth)
- Current annual tax
- $1,130 · $94/mo
- Projected year-2 tax
- $1,159 · $97/mo
- Expected delta
- +$30/yr (+$2/mo · 2.6%)
ⓘ Screening estimate from a state-policy table — verify with the county assessor before closing.
Climate risk First Street
- Flood 1/10 Low FEMA zone X (unshaded) · 0% chance over 30 yrs
- Wildfire 2/10 Low
- Heat 4/10 Moderate 7 d/yr ≥104°F today · 18 d/yr by 30 yrs out
- Wind 2/10 Low 100% chance of damaging wind over 30 yrs
- Air quality 1/10 Low 0 unhealthy d/yr today · 0 by 30 yrs out
Nearby sold comps map
Loading sold comps map…
Walkable amenities ~0.75 mi
Loading nearby amenities…
Taxation est. · year 1
- Rental income
- $16,219
- − Mortgage interest
- −$7,837
- − Property taxes
- −$1,130
- − Insurance
- −$700
- − Repairs & maintenance
- −$1,298
- − Management
- −$1,298
- − Depreciation
- −$4,070
- Taxable loss
- −$112
- Est. tax savings @ 24.0%
- +$27
- After-tax cash flow
- $2,207/yr
For passive investors: Depreciation is non-cash, so a rental often shows a tax loss while cash-flowing — sheltering income. Rental losses are passive: they offset passive income freely, and up to $25,000/yr can offset ordinary (W-2) income if you actively participate and your MAGI is under $100k (phasing out to $0 by $150k); unused losses carry forward. On sale, claimed depreciation is recaptured at up to 25%, and gains may owe capital-gains tax (a 1031 exchange can defer both). Figures are a year-1 estimate at your 24.0% rate — not tax advice; consult a CPA.
Schools (NCES district)
- District
- Richland-Bean Blossom Community School Corporation
- NCES district ID
- 1809480
- Math proficiency
- 41% ▼ -15.00%
- Reading proficiency
- 52% ▼ -8.00%
- Median HH income
- $53,816
- Composite
- 40.21/100
- National rank
- #3780
- State rank
- #82 of 301 in IN
Livability — Ellettsville
- Score
- 70/100
- State rank
- #153
- US rank
- #7613
Category grades
Schools grade is shown separately in the Schools card above.
Census & demographics
- Census place
- Ellettsville, IN
- Population (ZIP)
- 7,402
Population outlook (Monroe County) Hauer SSP2
- Today (2025)
- 160,645 people
- By 2030
- 170,174 · +5.9%
- By 2040
- 188,326 · +17.2%
- By 2050
- 206,892 · +28.8%
- By 2075
- 256,650 · +59.8%
- By 2100
- 303,242 · +88.8%
Race, ethnicity, and origin ACS 2023
- Neighborhood character
- Predominantly White (93%)
- Race & ethnicity
- White 93% Two or more races 6% Hispanic / Latino 2%
- Common ancestry
- Italian 2% Slovak 2% Lithuanian 2%
- Foreign-born
- 1% · Canada
- Languages at home
- 98% English-only · Spanish 1%
Political lean MEDSL · Monroe
- 2024 margin
- Strong D (+27.4) · D 63.0% · R 35.5% · Other 1.5%
- 2008→2024 swing
- -4.7pp toward R · 2008: 32.2pp · 2024: 27.4pp
- All cycles
- 2024: D+27.4 2020: D+28.2 2016: D+23.7 2012: D+16.5 2008: D+32.2
Not yet ingested
- Civics
- —
Market trends
- HPI YoY
- ▼ -97.14%
- Current HPI
- 265.2863
- Rent YoY
- —
- Metro
- —
- State GDP YoY
- ▲ 2.90%
- F500 in state
- 18
Industry mix (Fortune 500 HQ in IN)
| Industry | F500 HQs | Revenue |
|---|---|---|
| Industrial Machinery | 2 | $37B |
|
||
| Healthcare | 1 | $177B |
|
||
| Pharmaceuticals | 1 | $45B |
|
||
| Metals / Steel | 1 | $18B |
|
||
| Agriculture | 1 | $17B |
|
||
| Packaging | 1 | $12B |
|
||
Price history
1 event — show timeline
- 2026-06-12 Listed $139,900 IRMLS
Property tax history
+7.7%/yrLatest (2024): $1,130 · +1.3% YoY. Source: county tax records.
Cash-flow waterfall
monthlySold comps — $/sqft
last 12 mo · ≤1 miLoading sold comps…