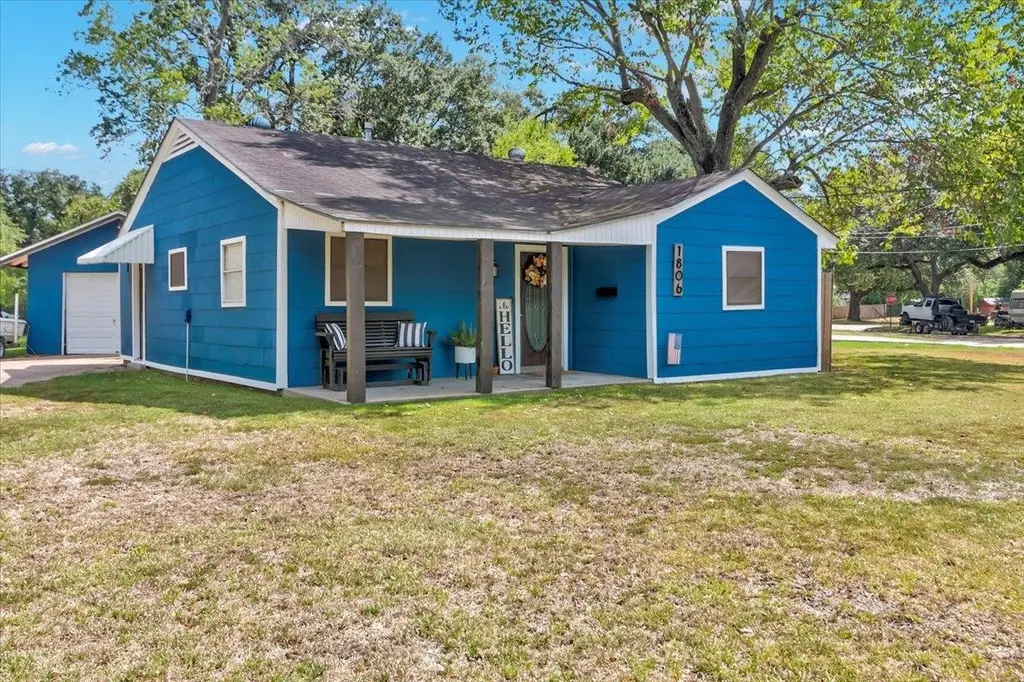
1806 Avenue D · Port Neches, TX
Flood risk 7/10 · Major
- FEMA flood zone
- X
- Chance of flooding over 30 yrs
- 0.99%
- Est. flood insurance / yr
- $507 – $1,088
Fire risk 2/10 · Minimal
- Est. fire insurance / yr
- $1,222 – $2,270
Heat risk 9/10 · Severe
- Hot days now (above 109°F)
- 7 days/yr
- Hot days in 30 yrs
- 25 days/yr
Wind risk 9/10 · Severe
- Chance of severe wind over 30 yrs
- 99.0%
Air-quality risk 2/10 · Minimal
- Unhealthy air days now
- 1 days/yr
- Unhealthy air days in 30 yrs
- 1 days/yr
Risk factors via First Street. Map © Google.
Why this score? — see what drove the D grade
The composite is a weighted blend of 9 inputs, each scored 0–100. Each bar is that input's sub-score; the figure is the points it added to the 100-point composite (weight × sub-score).
- Cash flow +17.4/30.0
- DSCR +5.4/10.0
- 1% rule +5.1/10.0
- ARV discount +4.3/15.0
- Schools +3.9/10.0
- Livability +3.8/5.0
- Rent growth +2.5/5.0
- Condition / age +2.5/5.0
- Appreciation +0.0/10.0
$169,000
🖨 Deal sheet (PDF) 📄 Offer letter ✓ Due diligence
Listing remarks
This beautifully updated 3-bedroom, 1-bath home offers comfort, style, and a layout that feels both functional and inviting. Meticulously maintained, the interior features modern updates throughout, creating a move-in-ready space you’ll love coming home to. The bathroom is thoughtfully designed with both a separate soaking tub and a walk-in shower, giving you the best of relaxation and convenience. Each bedroom provides versatility for family, guests, or a home office setup. Situated on a desirable corner lot, the property offers added outdoor space and great curb appeal, along with a detached one-car garage for extra storage or parking. Enjoy an unbeatable location just a short, less
Key facts
- Walk-in shower
- Outdoor space
- Separate soaking tub
Tags
Property features AI
Finance
- Other: Property located in the New Texas subdivision
- Financial info: Financial details not provided
- HOA & community: HOA info not provided
Exterior
- Parking: 1-car garage
- Security: Security info not provided
- Utilities: Public water; Public sewer
- Home design: Single-family residence; Single story
- Construction: Slab foundation
- Exterior features: Corner lot; Lot dimensions approximately 96.70 x 95.60
Interior
- Kitchen: Microwave; Range
- Bedrooms: Bedrooms info not provided
- Flooring: Laminate; Tile
- Bathrooms: 1 full bathroom
- Heating & cooling: Electric central heating; Central air; Ceiling fan(s)
- Interior features: Microwave; Range; Laminate flooring; Tile flooring; Ceiling fan(s); Central air
- Laundry & utility: Laundry info not provided
Neighborhood map
What this means for you Summary
Snapshot
- This is a 3-bed/1.0-bath single-family listed at $169k.
Deal economics
- At list price, monthly cash flow is $59 ($712/yr) — positive.
- The deal already cash-flows at list — no discount required.
- Meets the 1% rule at list price ($2k rent vs $169k).
- Cap rate 7.2% vs local median 4.7% in Port Neches — top-decile yield for the area; either an underpriced asset or a hidden risk that comps aren't pricing in. Stress-test before assuming the spread holds.
Location & tenants
- Location reads 75/100 on livability (#139 in TX, #3,996 nationally) — a middle-class / working-renter tenant base. Strengths: employment A+, cost of living A+, housing A+; Watch: amenities F, commute F.
- Port Neches-Groves ISD (suburban): math 42% / reading 47% proficiency, ranked #260 of 826 in TX (top 32%) — families likely to look elsewhere, expect single-tenant / working-renter base with shorter leases.
- Market conditions: 96 active listings in the ZIP; 5 comparable units currently listed for rent nearby; rentals at typical pace (median 16d on market — plan ~3-4 weeks tenant-placement turnaround); 343 units permitted in Jefferson County in 2024 (0 in 5+ unit buildings).
Forward outlook
- Local home prices are declining (-3.0%/yr); year-one equity from $1k of loan paydown is wiped out by about $5k of value loss. Plan a longer hold.
Negotiation context
- Only 13 days on market — expect competitive offers; lowballing is unlikely to land.
Risks & watch-outs
- Watch-outs: flood insurance adds $66/mo.
- Climate carrying-cost: major flood risk; severe wind risk, 99% chance of damaging wind over 30y; extreme-heat days projected 7→25/yr by 2055 (HVAC capex compounding) — expect insurance premiums to compound above CPI over the hold.
Questions for the listing agent
- Built in 1962 — when were the roof, HVAC, electrical panel, plumbing, and water heater last replaced?
- What's the actual annual flood-insurance premium (NFIP or private), and is the property in a SFHA with mandatory coverage?
- Is there a deadline driving the sale (1031 exchange, divorce, estate, relocation)? That informs how much negotiation room exists.
- Schools are B-rated — typically a magnet for longer-tenancy family renters. What's the average tenant stay here, and is there a school-zone premium baked into asking?
- The area grade is low — what's the realistic commute time and amenity access for the typical tenant pool here? Any planned neighborhood developments (good or bad) we should know about?
- What's the average days-on-market for RENTAL listings here right now (not sales)? A rising rental-DOM trend means longer vacancies and softer asking-rent achievability than the comps imply.
- What's the recent tenant-quality profile in this submarket — average credit score on applications, eviction rate, late-payment / NSF rate, and stable-employment percentage? A property-management company in the area should have these aggregated.
- How much new for-sale + rental construction is in the pipeline within 1–3 miles? Heavy new supply typically softens prices + rents 12–24 months out; constrained supply supports both.
Investment metrics
- 1% rule
- 1.01% ✓
- Cap rate
- 7.19%
- Cash-on-cash
- 3.19%
- DSCR
- 1.14
- GRM
- 8.2
CMA / ARV
- ARV (median comp)
- $157,733
- List price
- $169,000
- Delta
- 7.14%
- Verdict
- FAIR
- Comps
- 16 within 1.0 mi
Show comp detail 3 sales within ~0.75 mi
| Address | Dist | Beds/Ba | Sqft | Sold | Price | $/sf | Match |
|---|---|---|---|---|---|---|---|
| 2110 7th St | 0.41mi | 2/1.0 (-1) | 988 (+4%) | 3mo | $140,000 | $142 | 67 |
| 1802 Live Oak St | 0.37mi | 3/1.0 | 864 (-9%) | 3mo | $159,900 | $185 | 66 |
| 1122 Wagner St | 0.13mi | 2/1.0 (-1) | 1,000 (+6%) | 22mo | $105,000 | $105 | 61 |
Match score weights: distance 35% · size 25% · config 20% · recency 20%. Top-matched comps best support the ARV.
Projected returns pro-forma
-3.0% appreciation · 3.0% rent growth · sell at horizon
- IRR
- -13.8%
- Equity multiple
- 0.50×
- Total profit
- $-23,505
- Equity at exit
- $25,198
- IRR
- -4.9%
- Equity multiple
- 0.68×
- Total profit
- $-15,188
- Equity at exit
- $14,612
Cash invested: $47,320 (down + closing). Projections, not guarantees.
Landlord ↔ Tenant lean methodology
- Overall (STATE)
- 87 Strongly Landlord-Friendly
- State Texas
- 87 Strongly Landlord-Friendly · R+5
- County
- — inherits STATE
- City
- — inherits STATE
ZIP-level market 77651
- Active inventory
- 96
- Price-to-rent
- 8.2×
Monthly cashflow live
- Estimated rent
- $1,711 high interval (Pro) →
- Mortgage (P&I)
- −$886
- Tax from tax record
- −$269 /mo · $3,233/yr
- Insurance
- −$70
- Flood insurance flood zone
- −$66 /mo · $798/yr
- HOA
- −$0
- Vacancy / Maint / Mgmt
- −$359
- Net cashflow
- $59
Break-even live
Sensitivity live
| Price | -10% $155 | -5% $107 | +0% $59 | +5% $11 | +10% $-36 |
|---|---|---|---|---|---|
| Rent | -10% $-76 | -5% $-8 | +0% $59 | +5% $127 | +10% $194 |
| Rate | -1.0pp $144 | -0.5pp $102 | base $59 | +0.5pp $16 | +1.0pp $-29 |
UW: 25.0% down · 7.5% · 30yr · 1.5% tax · 5.0% vac · 8.0% maint · 8.0% mgmt
Financing live
Cash to close
- Down payment
- $42,250
- Closing costs
- $5,070
- Reserves months
- —
- Total cash needed
- —
Loan-product check · same deal, 3 products live
Conventional
25% down · 7.5% · 30yr
- Down + closing
- —
- Monthly P&I
- —
- Monthly cashflow
- —
- DSCR
- —
- Eligible?
- —
Personal DTI + credit; lowest rate.
DSCR
20% down · 8.5% · 30yr
- Down + closing
- —
- Monthly P&I
- —
- Monthly cashflow
- —
- DSCR
- —
- Eligible?
- —
No personal income docs; deal must DSCR.
Hard money
10% down · 12.0% · 12mo
- Down + closing
- —
- Monthly P&I
- —
- Monthly cashflow
- —
- DSCR
- —
- Eligible?
- —
Short-term bridge; refi at stabilization.
Rent comps 5 comps
| Address | Beds | Baths | Sqft | Rent | $/sqft | DOM | Units | Dist |
|---|---|---|---|---|---|---|---|---|
| 608 S 2nd St Nederland, TX | 3.0 | 1.0 | 936 | $1,600 | $1.71 | 15d | 1 | 0.93mi |
| 307 Avenue E Port Neches, TX | 3.0 | 2.0 | 875 | $1,550 | $1.77 | 15d | 1 | 1.06mi |
| 2140 Merriman St Port Neches, TX | 2.0 | 1.0 | 800 | $1,995 | $2.49 | 15d | 1 | 1.16mi |
| 2150 Merriman St Port Neches, TX | 2.0 | 1.0 | 800 | $1,995 | $2.49 | 15d | 1 | 1.17mi |
| 812 S 6th St Nederland, TX | 3.0 | 1.0 | 996 | $1,500 | $1.51 | 15d | 1 | 1.31mi |
Listing history 5 events
-
2026-05-16status Pending 889-char remark
-
2026-05-03$169,000 Active 889-char remark
-
2021-07-19soldstatus
-
2020-07-22soldstatus
-
2008-05-14soldstatus
ⓘ Source: listings_history table (triggers on properties + properties_extension) + one-shot
backfill from property_details.listing_events for pre-trigger history.
Tax reassessment forecast TX · Resets to sale price
- Current annual tax
- $3,233 · $269/mo
- Projected year-2 tax
- $3,233 · $269/mo
- Expected delta
- $0/yr ($0/mo · 0.0%)
ⓘ Screening estimate from a state-policy table — verify with the county assessor before closing.
Climate risk First Street
- Flood 7/10 Severe FEMA zone X · 99% chance over 30 yrs
- Wildfire 2/10 Low
- Heat 9/10 Extreme 7 d/yr ≥109°F today · 25 d/yr by 30 yrs out
- Wind 9/10 Extreme 99% chance of damaging wind over 30 yrs
- Air quality 2/10 Low 1 unhealthy d/yr today · 1 by 30 yrs out
Nearby sold comps map
Loading sold comps map…
Walkable amenities ~0.75 mi
Loading nearby amenities…
Taxation est. · year 1
- Rental income
- $20,534
- − Mortgage interest
- −$9,467
- − Property taxes
- −$3,233
- − Insurance
- −$1,642
- − Repairs & maintenance
- −$1,643
- − Management
- −$1,643
- − Depreciation
- −$4,916
- Taxable loss
- −$2,009
- Est. tax savings @ 24.0%
- +$482
- After-tax cash flow
- $1,194/yr
For passive investors: Depreciation is non-cash, so a rental often shows a tax loss while cash-flowing — sheltering income. Rental losses are passive: they offset passive income freely, and up to $25,000/yr can offset ordinary (W-2) income if you actively participate and your MAGI is under $100k (phasing out to $0 by $150k); unused losses carry forward. On sale, claimed depreciation is recaptured at up to 25%, and gains may owe capital-gains tax (a 1031 exchange can defer both). Figures are a year-1 estimate at your 24.0% rate — not tax advice; consult a CPA.
Schools (NCES district)
- District
- Port Neches-Groves ISD
- NCES district ID
- 4835430
- Math proficiency
- 42% ▼ -13.00%
- Reading proficiency
- 47% ▼ -5.00%
- Median HH income
- $54,661
- Composite
- 38.65/100
- National rank
- #4152
- State rank
- #260 of 826 in TX
Livability — Port Neches
- Score
- 75/100
- State rank
- #139
- US rank
- #3996
Category grades
Schools grade is shown separately in the Schools card above.
Census & demographics
- Census place
- Port Neches, TX
- Population (ZIP)
- 13,627
Population outlook (Jefferson County) Hauer SSP2
- Today (2025)
- 259,015 people
- By 2030
- 260,685 · +0.6%
- By 2040
- 263,309 · +1.7%
- By 2050
- 265,237 · +2.4%
- By 2075
- 270,193 · +4.3%
- By 2100
- 255,628 · -1.3%
Race, ethnicity, and origin ACS 2023
- Neighborhood character
- Predominantly White (84%)
- Race & ethnicity
- White 84% Hispanic / Latino 9% Two or more races 9% Asian 2%
- Hispanic origin (detail)
- Mexican 8%
- Common ancestry
- Lithuanian 15% Romanian 2% Italian 1%
- Foreign-born
- 5% · Canada
- Languages at home
- 92% English-only · Spanish 4% Vietnamese 2% Other Indo-European 1%
Political lean MEDSL · Jefferson
- 2024 margin
- Lean R (+8.9) · D 45.1% · R 54.0%
- 2008→2024 swing
- -11.1pp toward R · 2008: 2.2pp · 2024: -8.9pp
- All cycles
- 2024: R+8.9 2020: R+1.6 2016: R+0.5 2012: D+1.6 2008: D+2.2
Not yet ingested
- Civics
- —
Market trends
- HPI YoY
- ▼ -187.68%
- Current HPI
- 186.228
- Rent YoY
- —
- Metro
- —
- State GDP YoY
- ▲ 3.95%
- F500 in state
- 110
Industry mix (Fortune 500 HQ in TX)
| Industry | F500 HQs | Revenue |
|---|---|---|
| Energy | 16 | $1,198B |
|
||
| Technology | 5 | $198B |
|
||
| Engineering / Construction | 4 | $72B |
|
||
| Energy Services | 3 | $60B |
|
||
| Utilities | 3 | $41B |
|
||
| Healthcare | 2 | $330B |
|
||
Price history
7 events — show timeline
- 2026-06-16 Delisted — BBOR
- 2026-06-15 Sold (MLS) — BBOR
- 2026-05-16 Pending — BBOR
- 2026-05-03 Listed $169,000 BBOR
- 2021-07-19 Sold (Public Records) — Public Records
- 2020-07-22 Sold (Public Records) — Public Records
- 2008-05-14 Sold (Public Records) — Public Records
Property tax history
+7.9%/yrLatest (2025): $3,233 · +9.6% YoY. Source: county tax records.
Cash-flow waterfall
monthlySold comps — $/sqft
last 12 mo · ≤1 miLoading sold comps…