4160 Oro Ln #7 · Diamond Springs, CA
Flood risk 1/10 · Minimal
- FEMA flood zone
- X (unshaded)
- Chance of flooding over 30 yrs
- 0.0%
- Est. flood insurance / yr
- $507 – $1,088
Fire risk 9/10 · Severe
- Est. fire insurance / yr
- $659 – $1,223
Heat risk 6/10 · Moderate
- Hot days now (above 100°F)
- 7 days/yr
- Hot days in 30 yrs
- 16 days/yr
Wind risk 1/10 · Minimal
- Chance of severe wind over 30 yrs
- —
Air-quality risk 10/10 · Severe
- Unhealthy air days now
- 31 days/yr
- Unhealthy air days in 30 yrs
- 38 days/yr
Risk factors via First Street. Map © Google.
Why this score? — see what drove the D grade
The composite is a weighted blend of 9 inputs, each scored 0–100. Each bar is that input's sub-score; the figure is the points it added to the 100-point composite (weight × sub-score).
- Cash flow +15.0/30.0
- ARV discount +7.5/15.0
- 1% rule +5.0/10.0
- DSCR +5.0/10.0
- Schools +3.7/10.0
- Rent growth +2.5/5.0
- Condition / age +2.5/5.0
- Livability +2.4/5.0
- Appreciation +0.4/10.0
$21,999
🖨 Deal sheet 📄 Offer letter ✓ Due diligence
Listing remarks
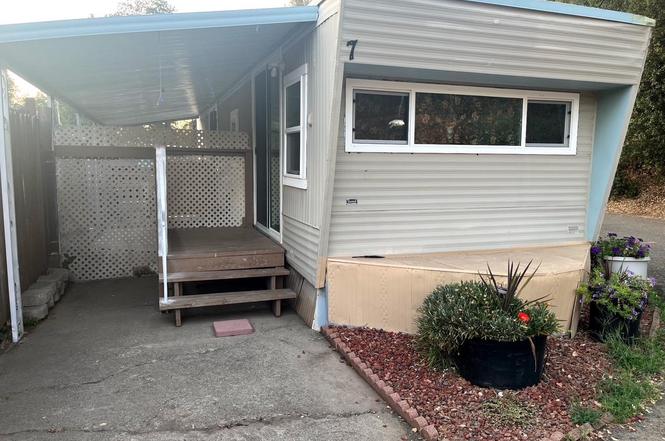
Price Reduced again! Seller says SELL IT. Nicely updated home on a corner lot. New windows, Glass sliding doors, new interior paint and Luxury Vinyl Plank floors allow you to move right in and unpack. Great corner lot towards the rear of a small park that is close to everything. Walking distance to school, and freeway close.
Key facts
- Glass sliding doors
- New interior paint
- Corner lot
Tags
Property features AI
Finance
- Other: Located at 4160 Oro Ln #7, El Dorado, CA 95623 (corner lot with directions available)
- Financial info: Land lease: No (listed land lease amount present but property is not land-lease)
- HOA & community: No association
Exterior
- Parking: Off-street parking; Attached covered parking; no enclosed garage
- Utilities: Propane service; 220 volts available in laundry; Public sewer; Public water via water district
- Home design: Manufactured home in park (single wide); Built in 1961
- Construction: Metal roof; Fleetwood manufactured home (single wide); Metal skirting
- Exterior features: Corner lot; Garden
Interior
- Kitchen: Laminate counter; Free-standing gas range; Free-standing electric range; Free-standing refrigerator
- Bedrooms: 1 bedroom
- Flooring: Vinyl flooring
- Bathrooms: 1 full bathroom with tub and shower over
- Heating & cooling: Central heating; Central cooling
- Interior features: Porch steps at the entrance; Living area with general 'other' features; Dining area with general 'other' features
- Laundry & utility: Laundry area with 220V outlet (listed as 'other' laundry feature)
Neighborhood map
What this means for you Summary
Snapshot
- This is a 1-bed/1.0-bath manufactured listed at $22k.
Deal economics
- At list price, monthly cash flow is $656 ($8k/yr) — positive.
- The deal already cash-flows at list — no discount required.
- Meets the 1% rule at list price ($1k rent vs $22k).
- Recommended offer: $19k (12.0% below list) — sets the bar for market timing.
- Cap rate 42.1% vs local median 2.3% in Diamond Springs — top-decile yield for the area; either an underpriced asset or a hidden risk that comps aren't pricing in. Stress-test before assuming the spread holds.
Location & tenants
- Location reads 47/100 on livability (#1,239 in CA) — a working-class tenant base; expect higher turnover. Strengths: housing B+; Watch: schools D, crime D-, amenities F.
- Mother Lode Union Elementary (rural): math 36% / reading 41% proficiency, ranked #726 of 1,400 in CA (top 52%) — families likely to look elsewhere, expect single-tenant / working-renter base with shorter leases.
- Market conditions: 44 active listings in the ZIP; 437 units permitted in El Dorado County in 2024 (0 in 5+ unit buildings).
Forward outlook
- Local home prices are declining (-3.0%/yr); year-one equity from $152 of loan paydown is wiped out by about $660 of value loss. Plan a longer hold.
- El Dorado County population projected to shrink 3% by 2050 — rents likely to lag national; underwrite the cash flow, not the appreciation.
- At projected returns (-3.0% appreciation + 3.0% rent growth), your $6k cash investment doubles in ~1 year — after that, you're playing with house money.
Negotiation context
- It's been on market 277 days — a 12% lower offer ($19k) is reasonable based on typical stale-listing flexibility.
Risks & watch-outs
- Climate carrying-cost: severe wildfire risk; extreme-heat days projected 7→16/yr by 2055 (HVAC capex compounding) — expect insurance premiums to compound above CPI over the hold.
Questions for the listing agent
- It's been on market 277 days. Have you received any prior offers? Is the seller open to a 12% concession, seller financing, or rate buy-down credit?
- Built in 1961 — when were the roof, HVAC, electrical panel, plumbing, and water heater last replaced?
- Why hasn't it sold? Are there any deal-killer items the seller is aware of (foundation, flood, title, zoning, code violations)?
- Is there a deadline driving the sale (1031 exchange, divorce, estate, relocation)? That informs how much negotiation room exists.
- Schools are D-rated, which usually means shorter tenancies and higher turnover. Who's the typical renter profile here, and what's been the actual vacancy rate?
- Crime grade is D in this area — have there been break-ins, vandalism, or insurance claims at this property in the last 3 years? What carrier currently insures it and at what premium?
- The area grade is low — what's the realistic commute time and amenity access for the typical tenant pool here? Any planned neighborhood developments (good or bad) we should know about?
- What's the average days-on-market for RENTAL listings here right now (not sales)? A rising rental-DOM trend means longer vacancies and softer asking-rent achievability than the comps imply.
- What's the recent tenant-quality profile in this submarket — average credit score on applications, eviction rate, late-payment / NSF rate, and stable-employment percentage? A property-management company in the area should have these aggregated.
- How much new for-sale + rental construction is in the pipeline within 1–3 miles? Heavy new supply typically softens prices + rents 12–24 months out; constrained supply supports both.
Investment metrics
- 1% rule
- 4.65% ✓
- Cap rate
- 42.10%
- Cash-on-cash
- 127.87%
- DSCR
- 6.69
- GRM
- 1.8
CMA / ARV
- ARV (on-the-fly)
- $22,000
- Comps found
- 1
Show comp detail 1 sale within ~0.75 mi
| Address | Dist | Beds/Ba | Sqft | Sold | Price | $/sf | Match |
|---|---|---|---|---|---|---|---|
| 4160 Oro Ln #7 | 0.00mi | 1/1.0 | 400 (0%) | 1mo | $21,900 | $55 | 100 |
Match score weights: distance 35% · size 25% · config 20% · recency 20%. Top-matched comps best support the ARV.
Projected returns pro-forma
-3.0% appreciation · 3.0% rent growth · sell at horizon
- IRR
- —
- Equity multiple
- 7.21×
- Total profit
- $38,257
- Equity at exit
- $3,280
- IRR
- —
- Equity multiple
- 15.16×
- Total profit
- $87,208
- Equity at exit
- $1,902
Cash invested: $6,160 (down + closing). Projections, not guarantees.
Landlord ↔ Tenant lean methodology
- Overall (STATE)
- 18 Strongly Tenant-Friendly
- State California
- 18 Strongly Tenant-Friendly · D+13
- County
- — inherits STATE
- City
- — inherits STATE
ZIP-level market 95623
- Home prices YoY
- -3.1%
- Active inventory
- 44
- Price-to-rent
- 1.8×
Monthly cashflow live
- Estimated rent
- $1,023 medium interval (Pro) →
- Mortgage (P&I)
- −$115
- Tax est. 1.5%
- −$27 /mo · $330/yr
- Insurance
- −$9
- HOA
- −$0
- Vacancy / Maint / Mgmt
- −$215
- Net cashflow
- $656
Break-even live
UW: 25.0% down · 7.5% · 30yr · 1.5% tax · 5.0% vac · 8.0% maint · 8.0% mgmt
Financing live
Cash to close
- Down payment
- $5,500
- Closing costs
- $660
- Reserves months
- —
- Total cash needed
- —
Loan-product check · same deal, 3 products live
Conventional
25% down · 7.5% · 30yr
- Down + closing
- —
- Monthly P&I
- —
- Monthly cashflow
- —
- DSCR
- —
- Eligible?
- —
Personal DTI + credit; lowest rate.
DSCR
20% down · 8.5% · 30yr
- Down + closing
- —
- Monthly P&I
- —
- Monthly cashflow
- —
- DSCR
- —
- Eligible?
- —
No personal income docs; deal must DSCR.
Hard money
10% down · 12.0% · 12mo
- Down + closing
- —
- Monthly P&I
- —
- Monthly cashflow
- —
- DSCR
- —
- Eligible?
- —
Short-term bridge; refi at stabilization.
Climate risk First Street
- Flood 1/10 Low FEMA zone X (unshaded) · 0% chance over 30 yrs
- Wildfire 9/10 Extreme
- Heat 6/10 Major 7 d/yr ≥100°F today · 16 d/yr by 30 yrs out
- Wind 1/10 Low
- Air quality 10/10 Extreme 31 unhealthy d/yr today · 38 by 30 yrs out
Nearby sold comps map
Loading sold comps map…
Walkable amenities ~0.75 mi
Loading nearby amenities…
Taxation est. · year 1
- Rental income
- $12,280
- − Mortgage interest
- −$1,232
- − Property taxes
- −$330
- − Insurance
- −$110
- − Repairs & maintenance
- −$982
- − Management
- −$982
- − Depreciation
- −$640
- Taxable income
- $8,003
- Est. tax owed @ 24.0%
- −$1,921
- After-tax cash flow
- $5,956/yr
For passive investors: Depreciation is non-cash, so a rental often shows a tax loss while cash-flowing — sheltering income. Rental losses are passive: they offset passive income freely, and up to $25,000/yr can offset ordinary (W-2) income if you actively participate and your MAGI is under $100k (phasing out to $0 by $150k); unused losses carry forward. On sale, claimed depreciation is recaptured at up to 25%, and gains may owe capital-gains tax (a 1031 exchange can defer both). Figures are a year-1 estimate at your 24.0% rate — not tax advice; consult a CPA.
Schools (NCES district)
- District
- Mother Lode Union Elementary
- NCES district ID
- 0625980
- Math proficiency
- 36% ▬ 0.00%
- Reading proficiency
- 41% ▼ -4.00%
- Median HH income
- $59,429
- Composite
- 36.63/100
- National rank
- #9251
- State rank
- #726 of 1400 in CA
Livability — Diamond Springs
- Score
- 47/100
- State rank
- #1239
- US rank
- #26264
Category grades
Schools grade is shown separately in the Schools card above.
Census & demographics
- Census place
- Diamond Springs, CA
- City population
- 6,362
- Population (ZIP)
- 4,725
Population outlook (El Dorado County) Hauer SSP2
- Today (2025)
- 191,666 people
- By 2030
- 193,662 · +1.0%
- By 2040
- 192,583 · +0.5%
- By 2050
- 185,904 · -3.0%
- By 2075
- 169,543 · -11.5%
- By 2100
- 139,623 · -27.2%
Race, ethnicity, and origin ACS 2023
- Neighborhood character
- Predominantly White (80%)
- Race & ethnicity
- White 80% Hispanic / Latino 14% Two or more races 10%
- Hispanic origin (detail)
- Mexican 11%
- Common ancestry
- Russian 3% Lithuanian 3% Slovak 2%
- Foreign-born
- 4% · Canada, China
- Languages at home
- 93% English-only · Spanish 6% German/W. Germanic 1% Chinese 1%
Political lean MEDSL · El Dorado
- 2024 margin
- R (+12.0) · D 42.6% · R 54.6% · Other 2.8%
- 2008→2024 swing
- -1.5pp toward R · 2008: -10.5pp · 2024: -12.0pp
- All cycles
- 2024: R+12.0 2020: R+8.8 2016: R+13.9 2012: R+18.2 2008: R+10.5
Not yet ingested
- Civics
- —
Market trends
- HPI YoY
- ▼ -9.23%
- Current HPI
- 292.7181
- Rent YoY
- —
- Metro
- —
- State GDP YoY
- ▲ 3.21%
- F500 in state
- 116
Industry mix (Fortune 500 HQ in CA)
| Industry | F500 HQs | Revenue |
|---|---|---|
| Technology | 27 | $1,492B |
|
||
| Financial Services | 3 | $174B |
|
||
| Retail | 3 | $44B |
|
||
| Insurance | 3 | $26B |
|
||
| Media / Entertainment | 2 | $115B |
|
||
| Pharmaceuticals / Biotech | 2 | $62B |
|
||
Cash-flow waterfall
monthlySold comps — $/sqft
last 12 mo · ≤1 miLoading sold comps…