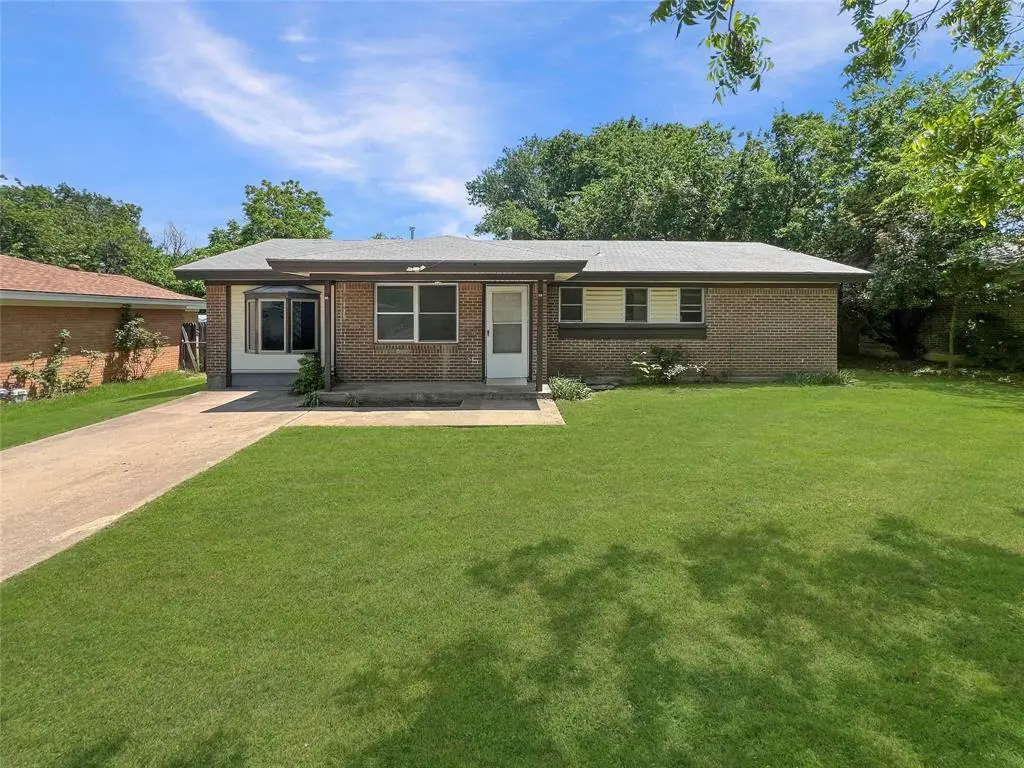
8853 Easley St · White Settlement, TX
Flood risk 1/10 · Minimal
- FEMA flood zone
- X (unshaded)
- Chance of flooding over 30 yrs
- 0.0%
- Est. flood insurance / yr
- $507 – $1,088
Fire risk 4/10 · Minor
- Est. fire insurance / yr
- $1,222 – $2,270
Heat risk 7/10 · Major
- Hot days now (above 108°F)
- 7 days/yr
- Hot days in 30 yrs
- 23 days/yr
Wind risk 4/10 · Minor
- Chance of severe wind over 30 yrs
- 24.0%
Air-quality risk 3/10 · Minor
- Unhealthy air days now
- 3 days/yr
- Unhealthy air days in 30 yrs
- 4 days/yr
Risk factors via First Street. Map © Google.
Why this score? — see what drove the B+ grade
The composite is a weighted blend of 9 inputs, each scored 0–100. Each bar is that input's sub-score; the figure is the points it added to the 100-point composite (weight × sub-score).
- Cash flow +30.0/30.0
- ARV discount +15.0/15.0
- DSCR +10.0/10.0
- 1% rule +8.9/10.0
- Livability +3.7/5.0
- Schools +3.5/10.0
- Rent growth +2.5/5.0
- Condition / age +2.5/5.0
- Appreciation +0.0/10.0
$119,950
🖨 Deal sheet 📄 Offer letter ✓ Due diligence
Listing remarks
This 4-bedroom, 1.5 -bath home situated on a spacious lot. There is plenty of room for outdoor entertaining, gardening, pets, or future improvements. The spacious yard gives you the feeling of extra privacy and freedom while still being located within a convenient area. The location is another major highlight, with easy access to Lockheed Martin, major highways for commuting, nearby schools, restaurants, shopping, and everyday conveniences. This home offers the rare opportunity to enjoy a larger lot and functional workspace while remaining close to everything the area has to offer. Whether you are looking for a property with room to work, space to enjoy the outdoors, or simply a comfortable
Key facts
- 7,841 sq ft lot
- Built 1960
- Listed 14 days
Property features AI
Finance
- Other: Property is not attached; Special listing condition: Third party approval; Possession at closing/funding; Transaction type: For Sale
- Financial info: Listing terms: Cash; Loan type: Treat as clear; No second mortgage
- HOA & community: No association
Exterior
- Parking: Driveway; On-street parking
- Utilities: City sewer; City water; Not in a municipal utility district
- Home design: Single family residence; Residential property; Built in 1960; One story
- Construction: Year built 1960
- Exterior features: Lot less than 0.5 acre (approximately 0.18 acre); Subdivision: Bass Add; Directions: Sliver Crk Rd, right on Easley Street
Interior
- Kitchen: Kitchen on level 1 (13 x 12); No appliances included
- Bedrooms: Primary bedroom on level 1 (12 x 10); Bedroom on level 1 (9 x 2); Bedroom on level 1 (9 x 9); Bedroom on level 1 (10 x 10)
- Bathrooms: 1 full bathroom (primary); 1 half bathroom
- Interior features: One-level layout; 8 total rooms; Living area of 1240; Interior described as 'Other'
- Laundry & utility: No laundry appliances listed
Neighborhood map
What this means for you Summary
Snapshot
- This is a 3-bed/2.0-bath single-family listed at $120k.
Deal economics
- At list price, monthly cash flow is $508 ($6k/yr) — positive.
- The deal already cash-flows at list — no discount required.
- Meets the 1% rule at list price ($2k rent vs $120k).
- Cap rate 11.4% vs local median 4.6% in White Settlement — top-decile yield for the area; either an underpriced asset or a hidden risk that comps aren't pricing in. Stress-test before assuming the spread holds.
Location & tenants
- Location reads 74/100 on livability (#188 in TX, #4,855 nationally) — a middle-class / working-renter tenant base. Strengths: cost of living A+, housing A+, health & safety A+; Watch: amenities D+, employment D+, commute F.
- White Settlement ISD (rural): math 35% / reading 44% proficiency, ranked #396 of 826 in TX (top 48%) — families likely to look elsewhere, expect single-tenant / working-renter base with shorter leases.
- Zoned schools: North El (math 44% / reading 45%, grade F, #1,155 of 4,322 statewide, top 29%, 766 students, 57% FRL).
- Market conditions: Rents soft (-0.2%/yr); 548 active listings in the ZIP; 25 comparable units currently listed for rent nearby; rentals at typical pace (median 24d on market — plan ~3-4 weeks tenant-placement turnaround); solid renter incomes; 18,938 units permitted in Tarrant County in 2024 (8,336 in 5+ unit buildings).
Forward outlook
- Local home prices are declining (-3.0%/yr); year-one equity from $830 of loan paydown is wiped out by about $4k of value loss. Plan a longer hold.
- Tarrant County population projected at +41% by 2050 — long-run rental-demand tailwind backs the buy-and-hold thesis.
- At projected returns (-3.0% appreciation + 0.0% rent growth), your $34k cash investment doubles in ~9 years — after that, you're playing with house money.
Negotiation context
- Only 14 days on market — expect competitive offers; lowballing is unlikely to land.
Risks & watch-outs
- Climate carrying-cost: extreme-heat days projected 7→23/yr by 2055 (HVAC capex compounding) — expect insurance premiums to compound above CPI over the hold.
Questions for the listing agent
- Built in 1960 — when were the roof, HVAC, electrical panel, plumbing, and water heater last replaced?
- Is there a deadline driving the sale (1031 exchange, divorce, estate, relocation)? That informs how much negotiation room exists.
- Schools are D-rated, which usually means shorter tenancies and higher turnover. Who's the typical renter profile here, and what's been the actual vacancy rate?
- What's the average days-on-market for RENTAL listings here right now (not sales)? A rising rental-DOM trend means longer vacancies and softer asking-rent achievability than the comps imply.
- What's the recent tenant-quality profile in this submarket — average credit score on applications, eviction rate, late-payment / NSF rate, and stable-employment percentage? A property-management company in the area should have these aggregated.
- How much new for-sale + rental construction is in the pipeline within 1–3 miles? Heavy new supply typically softens prices + rents 12–24 months out; constrained supply supports both.
Investment metrics
- 1% rule
- 1.39% ✓
- Cap rate
- 11.38%
- Cash-on-cash
- 18.17%
- DSCR
- 1.81
- GRM
- 6.0
CMA / ARV
- ARV (median comp)
- $219,519
- List price
- $119,950
- Delta
- -45.36%
- Verdict
- UNDERPRICED
- Comps
- 20 within 1.0 mi
Show comp detail 12 sales within ~0.75 mi
| Address | Dist | Beds/Ba | Sqft | Sold | Price | $/sf | Match |
|---|---|---|---|---|---|---|---|
| 8853 Easley St | 0.00mi | 4/1.5 (+1) | 1,240 (0%) | 0mo | $119,950 | $97 | 93 |
| 8832 Herman St | 0.17mi | 2/2.0 (-1) | 1,273 (+3%) | 2mo | $230,000 | $181 | 80 |
| 8805 Kate St | 0.17mi | 3/1.5 | 1,213 (-2%) | 13mo | $230,000 | $190 | 76 |
| 813 S Kate St | 0.17mi | 3/2.0 | 1,138 (-8%) | 6mo | $199,000 | $175 | 73 |
| 808 Bridle Ave | 0.40mi | 3/1.5 | 1,260 (+2%) | 5mo | $239,900 | $190 | 73 |
| 9005 Glenn Dr | 0.46mi | 3/2.0 | 1,311 (+6%) | 3mo | $230,000 | $175 | 67 |
| 840 Crosby Ave | 0.35mi | 3/2.0 | 1,158 (-7%) | 8mo | $182,000 | $157 | 66 |
| 1012 Comal Ave | 0.33mi | 3/2.0 | 1,377 (+11%) | 2mo | $239,900 | $174 | 65 |
| 521 S Kate St | 0.50mi | 3/2.0 | 1,211 (-2%) | 11mo | $249,900 | $206 | 63 |
| 853 Crosby Ave | 0.33mi | 3/2.0 | 1,102 (-11%) | 12mo | $215,000 | $195 | 57 |
| 820 Bridle Ave | 0.40mi | 4/2.0 (+1) | 1,372 (+11%) | 12mo | $249,900 | $182 | 49 |
| 911 Ronald St | 0.68mi | 3/2.0 | 1,169 (-6%) | 12mo | $209,990 | $180 | 48 |
Match score weights: distance 35% · size 25% · config 20% · recency 20%. Top-matched comps best support the ARV.
Projected returns pro-forma
-3.0% appreciation · 0.0% rent growth · sell at horizon
- IRR
- 6.4%
- Equity multiple
- 1.24×
- Total profit
- $8,084
- Equity at exit
- $17,885
- IRR
- 13.0%
- Equity multiple
- 1.89×
- Total profit
- $29,943
- Equity at exit
- $10,371
Cash invested: $33,586 (down + closing). Projections, not guarantees.
Landlord ↔ Tenant lean methodology
- Overall (STATE)
- 87 Strongly Landlord-Friendly
- State Texas
- 87 Strongly Landlord-Friendly · R+5
- County
- — inherits STATE
- City
- — inherits STATE
ZIP-level market 76108
- Home prices YoY
- -32.5%
- Rents YoY
- -0.2%
- Active inventory
- 548
- Price-to-rent
- 6.0×
Monthly cashflow live
- Estimated rent
- $1,664 high interval (Pro) →
- Mortgage (P&I)
- −$629
- Tax from tax record
- −$127 /mo · $1,521/yr
- Insurance
- −$50
- HOA
- −$0
- Vacancy / Maint / Mgmt
- −$349
- Net cashflow
- $508
Break-even live
UW: 25.0% down · 7.5% · 30yr · 1.5% tax · 5.0% vac · 8.0% maint · 8.0% mgmt
Financing live
Cash to close
- Down payment
- $29,988
- Closing costs
- $3,598
- Reserves months
- —
- Total cash needed
- —
Loan-product check · same deal, 3 products live
Conventional
25% down · 7.5% · 30yr
- Down + closing
- —
- Monthly P&I
- —
- Monthly cashflow
- —
- DSCR
- —
- Eligible?
- —
Personal DTI + credit; lowest rate.
DSCR
20% down · 8.5% · 30yr
- Down + closing
- —
- Monthly P&I
- —
- Monthly cashflow
- —
- DSCR
- —
- Eligible?
- —
No personal income docs; deal must DSCR.
Hard money
10% down · 12.0% · 12mo
- Down + closing
- —
- Monthly P&I
- —
- Monthly cashflow
- —
- DSCR
- —
- Eligible?
- —
Short-term bridge; refi at stabilization.
Rent comps 25 comps
| Address | Beds | Baths | Sqft | Rent | $/sqft | DOM | Units | Dist |
|---|---|---|---|---|---|---|---|---|
| 1300 Jim Wright Fwy Unit 1357 White Settlement, TX | 2.0 | 2.0 | 1112 | $1,440 | $1.29 | 43d | 1 | 0.41mi |
| 1300 Jim Wright Fwy Unit 1337 White Settlement, TX | 2.0 | 2.0 | 1112 | $1,407 | $1.27 | 2d | 1 | 0.41mi |
| 8508 Quebec Dr Fort Worth, TX | 3.0 | 1.0 | 936 | $1,800 | $1.92 | 18d | 1 | 0.45mi |
| 844 Saddle Rd Fort Worth, TX | 3.0 | 2.0 | 1055 | $1,850 | $1.75 | 18d | 1 | 0.46mi |
| 734 Lariat Ln White Settlement, TX | 3.0 | 2.0 | 1275 | $1,750 | $1.37 | 43d | 1 | 0.66mi |
| 8438 Jay St Fort Worth, TX | 3.0 | 2.5 | 1394 | $1,695 | $1.22 | 7d | 1 | 0.70mi |
| 8117 Foxfire Ln Unit A White Settlement, TX | 2.0 | 2.0 | 1030 | $1,150 | $1.12 | 43d | 1 | 0.72mi |
| 1501 Westpark View Dr Fort Worth, TX | 1.0–3.0 | 1.0–2.0 | 988 | $1,909 | $1.93 | 1d | 83 | 0.73mi |
| 8109 Foxfire Ln Unit D White Settlement, TX | 2.0 | 2.0 | 1100 | $1,195 | $1.09 | 22d | 1 | 0.75mi |
| 8109 Foxfire Ln Unit C White Settlement, TX | 2.0 | 2.0 | 1031 | $1,195 | $1.16 | 5d | 1 | 0.75mi |
| 212 Lanham Ct Fort Worth, TX | 2.0 | 1.0 | 1057 | $1,350 | $1.28 | 43d | 1 | 0.84mi |
| 9110 Lanham St White Settlement, TX | 2.0 | 1.5 | 1026 | $1,375 | $1.34 | 24d | 1 | 0.86mi |
| 213 Donald St Fort Worth, TX | 2.0 | 1.0 | 1025 | $1,450 | $1.41 | 43d | 1 | 0.88mi |
| 101 S Las Vegas Trl Fort Worth, TX | 2.0 | 1.5 | 1016 | $1,250 | $1.23 | 43d | 1 | 1.02mi |
| 101 West Pl Fort Worth, TX | 2.0 | 1.0 | 900 | $1,395 | $1.55 | 43d | 1 | 1.02mi |
| 108 Allencrest Dr White Settlement, TX | 2.0 | 1.5 | 1025 | $1,325 | $1.29 | 24d | 1 | 1.05mi |
| 112 Allencrest Dr White Settlement, TX | 2.0 | 1.5 | 1024 | $1,350 | $1.32 | 43d | 1 | 1.06mi |
| 123 Allencrest Dr Fort Worth, TX | 3.0 | 2.0 | 1424 | $1,545 | $1.08 | 1d | 1 | 1.07mi |
| 140 S Las Vegas Trl White Settlement, TX | 2.0 | 1.5 | 1200 | $1,299 | $1.08 | 24d | 1 | 1.08mi |
| 129 Allencrest Dr Fort Worth, TX | 3.0 | 2.0 | 1424 | $1,595 | $1.12 | 7d | 1 | 1.09mi |
| 238 S Las Vegas Trl White Settlement, TX | 2.0 | 1.5 | 1200 | $1,372 | $1.14 | 2d | 4 | 1.11mi |
| 405 S Las Vegas Trl Fort Worth, TX | 3.0 | 2.0 | 1160 | $1,595 | $1.38 | 18d | 1 | 1.23mi |
| 321 Meadow Park Dr White Settlement, TX | 3.0 | 2.0 | 1400 | $1,875 | $1.34 | 43d | 1 | 1.38mi |
| 617 S Las Vegas Trl White Settlement, TX | 3.0 | 2.0 | 1307 | $1,585 | $1.21 | 22d | 1 | 1.44mi |
| 619 Allencrest Dr Fort Worth, TX | 3.0 | 2.0 | 1322 | $1,800 | $1.36 | 24d | 1 | 1.47mi |
Listing history 1 events
-
2026-04-28$119,950 Active 904-char remark
ⓘ Source: listings_history table (triggers on properties + properties_extension) + one-shot
backfill from property_details.listing_events for pre-trigger history.
Tax reassessment forecast TX · Resets to sale price
- Current annual tax
- $1,521 · $127/mo
- Projected year-2 tax
- $2,195 · $183/mo
- Expected delta
- +$674/yr (+$56/mo · 44.3%)
ⓘ Screening estimate from a state-policy table — verify with the county assessor before closing.
Climate risk First Street
- Flood 1/10 Low FEMA zone X (unshaded) · 0% chance over 30 yrs
- Wildfire 4/10 Moderate
- Heat 7/10 Severe 7 d/yr ≥108°F today · 23 d/yr by 30 yrs out
- Wind 4/10 Moderate 24% chance of damaging wind over 30 yrs
- Air quality 3/10 Moderate 3 unhealthy d/yr today · 4 by 30 yrs out
Nearby sold comps map
Loading sold comps map…
Walkable amenities ~0.75 mi
Loading nearby amenities…
Taxation est. · year 1
- Rental income
- $19,963
- − Mortgage interest
- −$6,719
- − Property taxes
- −$1,521
- − Insurance
- −$600
- − Repairs & maintenance
- −$1,597
- − Management
- −$1,597
- − Depreciation
- −$3,489
- Taxable income
- $4,440
- Est. tax owed @ 24.0%
- −$1,066
- After-tax cash flow
- $5,036/yr
For passive investors: Depreciation is non-cash, so a rental often shows a tax loss while cash-flowing — sheltering income. Rental losses are passive: they offset passive income freely, and up to $25,000/yr can offset ordinary (W-2) income if you actively participate and your MAGI is under $100k (phasing out to $0 by $150k); unused losses carry forward. On sale, claimed depreciation is recaptured at up to 25%, and gains may owe capital-gains tax (a 1031 exchange can defer both). Figures are a year-1 estimate at your 24.0% rate — not tax advice; consult a CPA.
Schools (NCES district)
- District
- White Settlement ISD
- NCES district ID
- 4845540
- Math proficiency
- 35% ▼ -10.00%
- Reading proficiency
- 44% ▼ -4.00%
- Median HH income
- $56,055
- Composite
- 34.63/100
- National rank
- #5151
- State rank
- #396 of 826 in TX
Livability — White Settlement
- Score
- 74/100
- State rank
- #188
- US rank
- #4855
Category grades
Schools grade is shown separately in the Schools card above.
Census & demographics
- Census place
- White Settlement, TX
- County
- Tarrant County · 2,033,669 people
- Metro
- Dallas-Fort Worth-Arlington, TX
- Population (ZIP)
- 45,537
- Household income
- $80,412
- Rent vs Own
- Severe rent burden
- 774.0
Population outlook (Tarrant County) Hauer SSP2
- Today (2025)
- 2,380,417 people
- By 2030
- 2,578,900 · +8.3%
- By 2040
- 2,974,995 · +25.0%
- By 2050
- 3,350,489 · +40.8%
- By 2075
- 4,216,909 · +77.2%
- By 2100
- 4,741,527 · +99.2%
Race, ethnicity, and origin ACS 2023
- Neighborhood character
- Diverse neighborhood (Simpson 0.62)
- Race & ethnicity
- White 52% Hispanic / Latino 32% Two or more races 17% Black 8% Asian 3% Native American 1%
- Hispanic origin (detail)
- Mexican 26% Puerto Rican 1%
- Common ancestry
- Slovak 2% Lithuanian 1% Romanian 1%
- Foreign-born
- 11% · Canada, Vietnam
- Languages at home
- 76% English-only · Spanish 21% Vietnamese 1% Tagalog/Filipino 1%
Political lean MEDSL · Tarrant
- 2024 margin
- Lean R (+5.1) · D 46.7% · R 51.9% · Other 1.4%
- 2008→2024 swing
- +6.6pp toward D · 2008: -11.7pp · 2024: -5.1pp
- All cycles
- 2024: R+5.1 2020: D+0.2 2016: R+8.7 2012: R+15.7 2008: R+11.7
Not yet ingested
- Civics
- —
Market trends
- HPI YoY
- ▼ -141.39%
- Current HPI
- 294.2459
- Rent YoY
- ▼ -0.18%
- Metro
- Dallas-Fort Worth-Arlington, TX
- State GDP YoY
- ▲ 3.95%
- F500 in state
- 110
Industry mix (Fortune 500 HQ in TX)
| Industry | F500 HQs | Revenue |
|---|---|---|
| Energy | 16 | $1,198B |
|
||
| Technology | 5 | $198B |
|
||
| Engineering / Construction | 4 | $72B |
|
||
| Energy Services | 3 | $60B |
|
||
| Utilities | 3 | $41B |
|
||
| Healthcare | 2 | $330B |
|
||
Price history
3 events — show timeline
- 2026-06-12 Sold (MLS) — NTREIS
- 2026-05-19 Pending — NTREIS
- 2026-04-28 Listed $119,950 NTREIS
Property tax history
-0.5%/yrLatest (2025): $1,521 · -67.1% YoY. Source: county tax records.
Cash-flow waterfall
monthlySold comps — $/sqft
last 12 mo · ≤1 miLoading sold comps…