 🏷️ Likely Rental
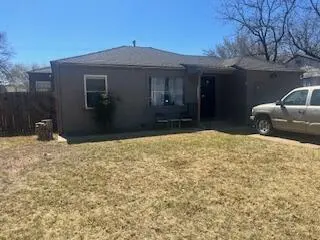
1513 41st St · Lubbock, TX
Flood risk 6/10 · Moderate
- FEMA flood zone
- X (shaded)
- Chance of flooding over 30 yrs
- 0.66%
- Est. flood insurance / yr
- $507 – $1,088
Fire risk 1/10 · Minimal
- Est. fire insurance / yr
- $1,222 – $2,270
Heat risk 5/10 · Moderate
- Hot days now (above 99°F)
- 7 days/yr
- Hot days in 30 yrs
- 21 days/yr
Wind risk 2/10 · Minimal
- Chance of severe wind over 30 yrs
- —
Air-quality risk 2/10 · Minimal
- Unhealthy air days now
- 1 days/yr
- Unhealthy air days in 30 yrs
- 1 days/yr
Risk factors via First Street. Map © Google.
Why this score? — see what drove the C grade
The composite is a weighted blend of 9 inputs, each scored 0–100. Each bar is that input's sub-score; the figure is the points it added to the 100-point composite (weight × sub-score).
- Cash flow +17.6/30.0
- ARV discount +15.0/15.0
- DSCR +5.5/10.0
- 1% rule +4.7/10.0
- Livability +4.0/5.0
- Rent growth +3.5/5.0
- Schools +3.1/10.0
- Condition / age +2.5/5.0
- Appreciation +0.0/10.0
$79,900
🖨 Deal sheet (PDF) 📄 Offer letter ✓ Due diligence
Listing remarks MLS
Previously leased for $1,050/month! This 3 bedroom home is ready for new owners! Updated and move-in ready! Newer HVAC system and roof and a HUGE backyard. Call your favorite Realtor for a showing today!
Key facts
- Maintained home
- Show ready
- 7,950 sq ft lot
Tags
Property features AI
Exterior
- Parking: Driveway; Off-street parking; On-street parking; Parking pad
- Security: See remarks
- Utilities: Public water; Public sewer; Electricity connected and available; Natural gas connected and available; Cable connected and available; Phone available
- Home design: Single-family residence; One story; Residential property
- Construction: Masonite exterior; Pillar/post/pier foundation
- Exterior features: Front porch; Rear porch; Fenced backyard with wood fencing; Landscaped, level city lot; Asphalt/paved public maintained road frontage on a city street; Composition roof
Interior
- Kitchen: Gas water heater
- Flooring: Carpet; Tile
- Bathrooms: 1 full bathroom
- Heating & cooling: Central heating (natural gas); Central electric air conditioning
- Interior features: Eat-in kitchen; Built-in storage; Storm windows; Window coverings
- Laundry & utility: Laundry room with washer and electric dryer hookups
Neighborhood map
What this means for you Summary
Snapshot
- This is a 2-bed/1.0-bath single-family listed at $80k.
Deal economics
- At list price, monthly cash flow is $62 ($747/yr) — positive.
- The deal already cash-flows at list — no discount required.
- To meet the 1% rule (rent ≥ 1% of price), the offer needs to be $78k (2.6% below list).
- Recommended offer: $78k (3.0% below list) — sets the bar for market timing.
Location & tenants
- Location reads 80/100 on livability (#37 in TX, #1,749 nationally) — a professional / high-income tenant draw. Strengths: commute A+, cost of living A+, housing A+; Watch: employment C-, crime F.
- Lubbock ISD (urban): math 36% / reading 39% proficiency, ranked #481 of 826 in TX (top 58%) — families likely to look elsewhere, expect single-tenant / working-renter base with shorter leases; 60% free/reduced lunch — lower-income household profile, screen leases tightly.
- Zoned schools: Bean El Gr 01 To 05 (math 26% / reading 25%, grade F, #2,982 of 4,322 statewide, top 70%, 349 students, 96% FRL); Slaton Middle (math 13% / reading 16%, grade F, #1,583 of 1,662 statewide, top 96%, 355 students, 96% FRL); Monterey H S (math 28% / reading 37%, grade F, #1,029 of 1,632 statewide, top 64%, 2,114 students, 72% FRL) — zoned schools average 88% FRL vs 60% district-wide (28 pts higher); higher-poverty schools than district average — tighter screening recommended.
- Zoned-school proficiency averages 24% at this address vs 38% district-wide (-13 pts) — the specific schools serving this property underperform the Lubbock ISD average; the district grade overstates school quality for this exact location.
- Market conditions: Rents rising (+3.9%/yr); 110 active listings in the ZIP; 40 comparable units currently listed for rent nearby; rentals at typical pace (median 23d on market — plan ~3-4 weeks tenant-placement turnaround); 2,219 units permitted in Lubbock County in 2024 (252 in 5+ unit buildings).
Forward outlook
- Local home prices are declining (-3.0%/yr); year-one equity from $552 of loan paydown is wiped out by about $2k of value loss. Plan a longer hold.
- Lubbock County population projected at +39% by 2050 — long-run rental-demand tailwind backs the buy-and-hold thesis.
Negotiation context
- It's been on market 57 days — a 3% lower offer ($78k) is reasonable based on typical stale-listing flexibility.
- 9 sale attempts since 4y ago; this cycle's ask has dropped $10k (11%) from the opening price — seller is motivated, your offer sets the floor, not the list.
Risks & watch-outs
- Watch-outs: built in 1951 — expect roof / HVAC / electrical / plumbing capex.
- Climate carrying-cost: major flood risk; extreme-heat days projected 7→21/yr by 2055 (HVAC capex compounding) — expect insurance premiums to compound above CPI over the hold.
Questions for the listing agent
- It's been on market 57 days. Have you received any prior offers? Is the seller open to a 3% concession, seller financing, or rate buy-down credit?
- Built in 1951 — when were the roof, HVAC, electrical panel, plumbing, and water heater last replaced?
- Is there a deadline driving the sale (1031 exchange, divorce, estate, relocation)? That informs how much negotiation room exists.
- Schools are D-rated, which usually means shorter tenancies and higher turnover. Who's the typical renter profile here, and what's been the actual vacancy rate?
- Crime grade is F in this area — have there been break-ins, vandalism, or insurance claims at this property in the last 3 years? What carrier currently insures it and at what premium?
- What's the average days-on-market for RENTAL listings here right now (not sales)? A rising rental-DOM trend means longer vacancies and softer asking-rent achievability than the comps imply.
- What's the recent tenant-quality profile in this submarket — average credit score on applications, eviction rate, late-payment / NSF rate, and stable-employment percentage? A property-management company in the area should have these aggregated.
- How much new for-sale + rental construction is in the pipeline within 1–3 miles? Heavy new supply typically softens prices + rents 12–24 months out; constrained supply supports both.
Investment metrics
- 1% rule
- 0.97% ✗
- Cap rate
- 7.23%
- Cash-on-cash
- 3.34%
- DSCR
- 1.15
- GRM
- 8.6
CMA / ARV
- ARV (median comp)
- $118,182
- List price
- $79,900
- Delta
- -32.39%
- Verdict
- UNDERPRICED
- Comps
- 2 within 1.0 mi
Show comp detail 1 sale within ~0.75 mi
| Address | Dist | Beds/Ba | Sqft | Sold | Price | $/sf | Match |
|---|---|---|---|---|---|---|---|
| 1218 48th St | 0.47mi | 2/1.0 | 1,040 (+10%) | 14mo | $139,000 | $134 | 49 |
Match score weights: distance 35% · size 25% · config 20% · recency 20%. Top-matched comps best support the ARV.
Projected returns pro-forma
-3.0% appreciation · 3.87% rent growth · sell at horizon
- IRR
- -10.1%
- Equity multiple
- 0.63×
- Total profit
- $-8,285
- Equity at exit
- $11,913
- IRR
- 0.5%
- Equity multiple
- 1.04×
- Total profit
- $808
- Equity at exit
- $6,908
Cash invested: $22,372 (down + closing). Projections, not guarantees.
Landlord ↔ Tenant lean methodology
- Overall (STATE)
- 87 Strongly Landlord-Friendly
- State Texas
- 87 Strongly Landlord-Friendly · R+5
- County
- — inherits STATE
- City
- — inherits STATE
ZIP-level market 79412
- Home prices YoY
- -15.3%
- Rents YoY
- 3.9%
- Active inventory
- 110
- Price-to-rent
- 8.6×
Monthly cashflow live
- Estimated rent
- $778 high interval (Pro) →
- Mortgage (P&I)
- −$419
- Tax from tax record
- −$100 /mo · $1,201/yr
- Insurance
- −$33
- HOA
- −$0
- Vacancy / Maint / Mgmt
- −$163
- Net cashflow
- $62
Break-even live
Sensitivity live
| Price | -10% $107 | -5% $85 | +0% $62 | +5% $40 | +10% $17 |
|---|---|---|---|---|---|
| Rent | -10% $1 | -5% $32 | +0% $62 | +5% $93 | +10% $124 |
| Rate | -1.0pp $102 | -0.5pp $83 | base $62 | +0.5pp $42 | +1.0pp $20 |
UW: 25.0% down · 7.5% · 30yr · 1.5% tax · 5.0% vac · 8.0% maint · 8.0% mgmt
Financing live
Cash to close
- Down payment
- $19,975
- Closing costs
- $2,397
- Reserves months
- —
- Total cash needed
- —
Loan-product check · same deal, 3 products live
Conventional
25% down · 7.5% · 30yr
- Down + closing
- —
- Monthly P&I
- —
- Monthly cashflow
- —
- DSCR
- —
- Eligible?
- —
Personal DTI + credit; lowest rate.
DSCR
20% down · 8.5% · 30yr
- Down + closing
- —
- Monthly P&I
- —
- Monthly cashflow
- —
- DSCR
- —
- Eligible?
- —
No personal income docs; deal must DSCR.
Hard money
10% down · 12.0% · 12mo
- Down + closing
- —
- Monthly P&I
- —
- Monthly cashflow
- —
- DSCR
- —
- Eligible?
- —
Short-term bridge; refi at stabilization.
Rent comps 40 comps
| Address | Beds | Baths | Sqft | Rent | $/sqft | DOM | Units | Dist |
|---|---|---|---|---|---|---|---|---|
| 1312 40th St Lubbock, TX | 3.0 | 1.0 | 940 | $795 | $0.85 | 22d | 1 | 0.13mi |
| 1604 45th St Lubbock, TX | 1.0 | 1.0 | 700 | $650 | $0.93 | 45d | 1 | 0.25mi |
| 1610 45th St Unit 14 Lubbock, TX | 1.0 | 1.0 | 550 | $895 | $1.63 | 45d | 1 | 0.25mi |
| 1712 42nd St Unit B Lubbock, TX | 3.0 | 1.0 | 899 | $695 | $0.77 | 22d | 1 | 0.29mi |
| 1102 42nd St Lubbock, TX | 1.0 | 1.0 | 574 | $495 | $0.86 | 22d | 1 | 0.30mi |
| 1710 45th St Unit A Lubbock, TX | 2.0 | 1.0 | 714 | $595 | $0.83 | 15d | 1 | 0.35mi |
| 1107 45th St Unit B Lubbock, TX | 2.0 | 1.0 | 728 | $850 | $1.17 | 45d | 1 | 0.36mi |
| 1119 46th St Unit A Lubbock, TX | 2.0 | 1.0 | 704 | $595 | $0.85 | 22d | 1 | 0.36mi |
| 1204 36th St Unit b Lubbock, TX | 3.0 | 2.0 | 872 | $835 | $0.96 | 15d | 1 | 0.40mi |
| 1718 46th St Lubbock, TX | 1.0 | 1.0 | 655 | $695 | $1.06 | 45d | 1 | 0.42mi |
| 1717 47th St Unit B Lubbock, TX | 3.0 | 1.0 | 830 | $775 | $0.93 | 22d | 1 | 0.49mi |
| 519 42nd St Apt A Lubbock, TX | 3.0 | 1.0 | 1092 | $895 | $0.82 | 15d | 1 | 0.59mi |
| 609 38th St Unit B Lubbock, TX | 2.0 | 1.0 | 660 | $550 | $0.83 | 45d | 1 | 0.60mi |
| 3104 Avenue N Lubbock, TX | 2.0 | 1.0 | 750 | $785 | $1.05 | 22d | 1 | 0.61mi |
| 2011 35th St Lubbock, TX | 2.0 | 1.0 | 810 | $800 | $0.99 | 45d | 1 | 0.61mi |
| 4511 Avenue G Unit G Lubbock, TX | 1.0 | 1.0 | 528 | $750 | $1.42 | 15d | 1 | 0.63mi |
| 713 47th St Unit B Lubbock, TX | 2.0 | 1.0 | 800 | $750 | $0.94 | 22d | 1 | 0.63mi |
| 529 45th St Unit A Lubbock, TX | 3.0 | 1.0 | 1100 | $875 | $0.80 | 15d | 1 | 0.64mi |
| 512 39th St Lubbock, TX | 2.0 | 1.0 | 876 | $849 | $0.97 | 15d | 1 | 0.64mi |
| 2108 38th St Lubbock, TX | 3.0 | 2.0 | 1124 | $900 | $0.80 | 45d | 1 | 0.64mi |
| 705 47th St Unit A Lubbock, TX | 2.0 | 1.0 | 821 | $750 | $0.91 | 22d | 1 | 0.67mi |
| 703 47th St Unit B Lubbock, TX | 2.0 | 1.0 | 821 | $750 | $0.91 | 22d | 1 | 0.67mi |
| 519 45th St Unit A Lubbock, TX | 3.0 | 1.0 | 1100 | $850 | $0.77 | 15d | 1 | 0.68mi |
| 1511 52nd St Lubbock, TX | 2.0 | 1.0 | 648 | $800 | $1.23 | 45d | 1 | 0.70mi |
| 2107 35th St Unit A Lubbock, TX | 2.0 | 1.0 | 1025 | $800 | $0.78 | 45d | 1 | 0.71mi |
| 1317 52nd St Unit C Lubbock, TX | 2.0 | 1.0 | 755 | $650 | $0.86 | 22d | 1 | 0.71mi |
| 2103 33rd St Lubbock, TX | 2.0 | 1.0 | 1075 | $700 | $0.65 | 15d | 1 | 0.72mi |
| 1316 53rd St Apt D Lubbock, TX | 2.0 | 1.0 | 755 | $695 | $0.92 | 45d | 1 | 0.74mi |
| 2120 47th St Lubbock, TX | 2.0 | 1.0 | 793 | $795 | $1.00 | 22d | 1 | 0.77mi |
| 1101 52nd St Apt C Lubbock, TX | 2.0 | 1.0 | 721 | $850 | $1.18 | 22d | 1 | 0.77mi |
| 1307 53rd St Unit 1307 C Lubbock, TX | 2.0 | 1.0 | 755 | $695 | $0.92 | 45d | 1 | 0.79mi |
| 2118 33rd St Unit B Lubbock, TX | 1.0 | 1.0 | 676 | $550 | $0.81 | 22d | 1 | 0.79mi |
| 1608 29th St Unit C Lubbock, TX | 1.0 | 1.0 | 680 | $650 | $0.96 | 45d | 1 | 0.79mi |
| 1608 29th St Unit B Lubbock, TX | 2.0 | 1.5 | 694 | $750 | $1.08 | 15d | 1 | 0.79mi |
| 332 37th St Unit 2 Lubbock, TX | 3.0 | 1.0 | 725 | $700 | $0.97 | 22d | 1 | 0.79mi |
| 330 37th St Unit 2 Lubbock, TX | 3.0 | 1.0 | 750 | $750 | $1.00 | 15d | 1 | 0.80mi |
| 1310 54th St Unit 3 Lubbock, TX | 1.0 | 1.0 | 684 | $575 | $0.84 | 45d | 1 | 0.81mi |
| 2119 32nd St Lubbock, TX | 2.0 | 1.0 | 1055 | $950 | $0.90 | 45d | 1 | 0.82mi |
| 2208 35th St Unit B Lubbock, TX | 2.0 | 1.0 | 767 | $750 | $0.98 | 45d | 1 | 0.82mi |
| 2302 40th St Lubbock, TX | 2.0 | 1.0 | 793 | $749 | $0.94 | 22d | 1 | 0.83mi |
Listing history 48 events
-
2026-06-18days on market $79,900 Active 57 DOM
-
2026-06-17days on market $79,900 Active 56 DOM
-
2026-06-16days on market $79,900 Active 55 DOM
-
2026-06-15days on market $79,900 Active 54 DOM
-
2026-06-14days on market $79,900 Active 52 DOM
-
2026-06-13days on market $79,900 Active 51 DOM
-
2026-06-10days on market $79,900 Active 49 DOM
-
2026-06-09days on market $79,900 Active 48 DOM
-
2026-06-08days on market $79,900 Active 47 DOM
-
2026-06-07days on market $79,900 Active 46 DOM
-
2026-06-05days on market $79,900 Active 43 DOM
-
2026-06-03days on market $79,900 Active 42 DOM
-
2026-06-02days on market $79,900 Active 41 DOM
-
2026-06-01days on market $79,900 Active 40 DOM
-
2026-05-31days on market $79,900 Active 39 DOM
-
2026-05-30days on market $79,900 Active 38 DOM
-
2026-04-21$89,900 Active 264-char remark
-
2025-07-04historical $1,000
-
2025-03-26$1,000
-
2025-03-26historical $1,000
-
2025-03-24$1,000
-
2025-02-13historical $1,000
-
2025-01-28$1,000
-
2024-12-24historical $1,000
-
2024-11-27$1,000
-
2024-09-11historical $1,000
-
2024-09-07price $1,000
-
2024-08-19$1,100
-
2024-08-16soldstatus
-
2024-08-13soldstatus Closed 203-char remark
Show marketing remark (203 chars)
Previously leased for $1,050/month! This 3 bedroom home is ready for new owners! Updated and move-in ready! Newer HVAC system and roof and a HUGE backyard. Call your favorite Realtor for a showing today!
-
2024-07-08status Pending 203-char remark
Show marketing remark (203 chars)
Previously leased for $1,050/month! This 3 bedroom home is ready for new owners! Updated and move-in ready! Newer HVAC system and roof and a HUGE backyard. Call your favorite Realtor for a showing today!
-
2024-07-01price $87,000 203-char remark
Show marketing remark (203 chars)
Previously leased for $1,050/month! This 3 bedroom home is ready for new owners! Updated and move-in ready! Newer HVAC system and roof and a HUGE backyard. Call your favorite Realtor for a showing today!
-
2024-06-19price $90,000 203-char remark
Show marketing remark (203 chars)
Previously leased for $1,050/month! This 3 bedroom home is ready for new owners! Updated and move-in ready! Newer HVAC system and roof and a HUGE backyard. Call your favorite Realtor for a showing today!
-
2024-06-11$95,000 Active 203-char remark
Show marketing remark (203 chars)
Previously leased for $1,050/month! This 3 bedroom home is ready for new owners! Updated and move-in ready! Newer HVAC system and roof and a HUGE backyard. Call your favorite Realtor for a showing today!
-
2023-01-31soldstatus
-
2023-01-30soldstatus Closed
Show marketing remark (20 chars)
New roof August 2022
-
2023-01-01status Pending
Show marketing remark (20 chars)
New roof August 2022
-
2023-01-01historical
Show marketing remark (20 chars)
New roof August 2022
-
2022-12-16status Pending
Show marketing remark (20 chars)
New roof August 2022
-
2022-08-31price $99,250
Show marketing remark (20 chars)
New roof August 2022
-
2022-07-18status Active
Show marketing remark (20 chars)
New roof August 2022
-
2022-07-18price $99,500
Show marketing remark (20 chars)
New roof August 2022
-
2022-07-11status Pending
Show marketing remark (20 chars)
New roof August 2022
-
2022-04-11$105,000 Active
Show marketing remark (20 chars)
New roof August 2022
-
2014-10-24soldstatus
-
2006-06-19soldstatus
-
2006-06-19soldstatus
-
1997-10-01soldstatus
ⓘ Source: listings_history table (triggers on properties + properties_extension) + one-shot
backfill from property_details.listing_events for pre-trigger history.
Tax reassessment forecast TX · Resets to sale price
- Current annual tax
- $1,201 · $100/mo
- Projected year-2 tax
- $1,462 · $122/mo
- Expected delta
- +$261/yr (+$22/mo · 21.7%)
ⓘ Screening estimate from a state-policy table — verify with the county assessor before closing.
Climate risk First Street
- Flood 6/10 Major FEMA zone X (shaded) · 66% chance over 30 yrs
- Wildfire 1/10 Low
- Heat 5/10 Major 7 d/yr ≥99°F today · 21 d/yr by 30 yrs out
- Wind 2/10 Low
- Air quality 2/10 Low 1 unhealthy d/yr today · 1 by 30 yrs out
Nearby sold comps map
Loading sold comps map…
Walkable amenities ~0.75 mi
Loading nearby amenities…
Taxation est. · year 1
- Rental income
- $9,336
- − Mortgage interest
- −$4,476
- − Property taxes
- −$1,201
- − Insurance
- −$400
- − Repairs & maintenance
- −$747
- − Management
- −$747
- − Depreciation
- −$2,324
- Taxable loss
- −$558
- Est. tax savings @ 24.0%
- +$134
- After-tax cash flow
- $881/yr
For passive investors: Depreciation is non-cash, so a rental often shows a tax loss while cash-flowing — sheltering income. Rental losses are passive: they offset passive income freely, and up to $25,000/yr can offset ordinary (W-2) income if you actively participate and your MAGI is under $100k (phasing out to $0 by $150k); unused losses carry forward. On sale, claimed depreciation is recaptured at up to 25%, and gains may owe capital-gains tax (a 1031 exchange can defer both). Figures are a year-1 estimate at your 24.0% rate — not tax advice; consult a CPA.
Schools (NCES district)
- District
- Lubbock ISD
- NCES district ID
- 4828500
- Math proficiency
- 36% ▼ -8.00%
- Reading proficiency
- 39% ▼ -1.00%
- Median HH income
- $39,820
- Composite
- 31.44/100
- National rank
- #5984
- State rank
- #481 of 826 in TX
Livability — Lubbock
- Score
- 80/100
- State rank
- #37
- US rank
- #1749
Category grades
Schools grade is shown separately in the Schools card above.
Census & demographics
- Census place
- Lubbock, TX
- County
- Lubbock County · 293,542 people
- City population
- 283,030
- Metro
- Lubbock, TX
- Population (ZIP)
- 15,018
- Household income
- $48,878
- Rent vs Own
- Severe rent burden
- 676.0
Population outlook (Lubbock County) Hauer SSP2
- Today (2025)
- 345,960 people
- By 2030
- 371,449 · +7.4%
- By 2040
- 424,539 · +22.7%
- By 2050
- 481,150 · +39.1%
- By 2075
- 633,467 · +83.1%
- By 2100
- 746,853 · +115.9%
Race, ethnicity, and origin ACS 2023
- Neighborhood character
- Diverse neighborhood (Simpson 0.56)
- Race & ethnicity
- Hispanic / Latino 61% Two or more races 25% White 25% Black 10%
- Hispanic origin (detail)
- Mexican 51% Puerto Rican 2%
- Common ancestry
- Lithuanian 1% Serbian 1% Italian 1%
- Foreign-born
- 5% · Canada
- Languages at home
- 67% English-only · Spanish 32% Arabic 1%
Political lean MEDSL · Lubbock
- 2024 margin
- Solid R (+39.5) · D 29.7% · R 69.2% · Other 1.0%
- 2008→2024 swing
- -2.8pp toward R · 2008: -36.7pp · 2024: -39.5pp
- All cycles
- 2024: R+39.5 2020: R+32.2 2016: R+38.4 2012: R+40.9 2008: R+36.7
Not yet ingested
- Civics
- —
Market trends
- HPI YoY
- ▼ -33.95%
- Current HPI
- 188.4033
- Rent YoY
- ▲ 3.87%
- Metro
- Lubbock, TX
- State GDP YoY
- ▲ 3.95%
- F500 in state
- 110
Industry mix (Fortune 500 HQ in TX)
| Industry | F500 HQs | Revenue |
|---|---|---|
| Energy | 16 | $1,198B |
|
||
| Technology | 5 | $198B |
|
||
| Engineering / Construction | 4 | $72B |
|
||
| Energy Services | 3 | $60B |
|
||
| Utilities | 3 | $41B |
|
||
| Healthcare | 2 | $330B |
|
||
Price history
-23.9% since first listed33 events — show timeline
- 2026-05-28 Price Changed $79,900 LARMLS
- 2026-04-21 Listed $89,900 LARMLS
- 2025-07-04 Rental Removed $1,000 LARMLS
- 2025-03-26 Listed for Rent $1,000 LARMLS
- 2025-03-26 Rental Removed $1,000 APPFOLIO
- 2025-03-24 Listed for Rent $1,000 APPFOLIO
- 2025-02-13 Rental Removed $1,000 LARMLS
- 2025-01-28 Listed for Rent $1,000 LARMLS
- 2024-12-24 Rental Removed $1,000 LARMLS
- 2024-11-27 Listed for Rent $1,000 LARMLS
- 2024-09-11 Rental Removed $1,000 LARMLS
- 2024-09-07 Price Changed $1,000 LARMLS
- 2024-08-19 Listed for Rent $1,100 LARMLS
- 2024-08-16 Sold (Public Records) — Public Records
- 2024-08-13 Sold (MLS) — LARMLS
- 2024-07-08 Pending — LARMLS
- 2024-07-01 Price Changed $87,000 LARMLS
- 2024-06-19 Price Changed $90,000 LARMLS
- 2024-06-11 Listed $95,000 LARMLS
- 2023-01-31 Sold (Public Records) — Public Records
- 2023-01-30 Sold (MLS) — LARMLS
- 2023-01-01 Pending — LARMLS
- 2023-01-01 Delisted — LARMLS
- 2022-12-16 Pending — LARMLS
- 2022-08-31 Price Changed $99,250 LARMLS
- 2022-07-18 Relisted — LARMLS
- 2022-07-18 Price Changed $99,500 LARMLS
- 2022-07-11 Pending — LARMLS
- 2022-04-11 Listed $105,000 LARMLS
- 2014-10-24 Sold (Public Records) — Public Records
- 2006-06-19 Sold (Public Records) — Public Records
- 2006-06-19 Sold (Public Records) — Public Records
- 1997-10-01 Sold (Public Records) — Public Records
Property tax history
+4.1%/yrLatest (2025): $1,201 · -4.6% YoY. Source: county tax records.
Cash-flow waterfall
monthlySold comps — $/sqft
last 12 mo · ≤1 miLoading sold comps…