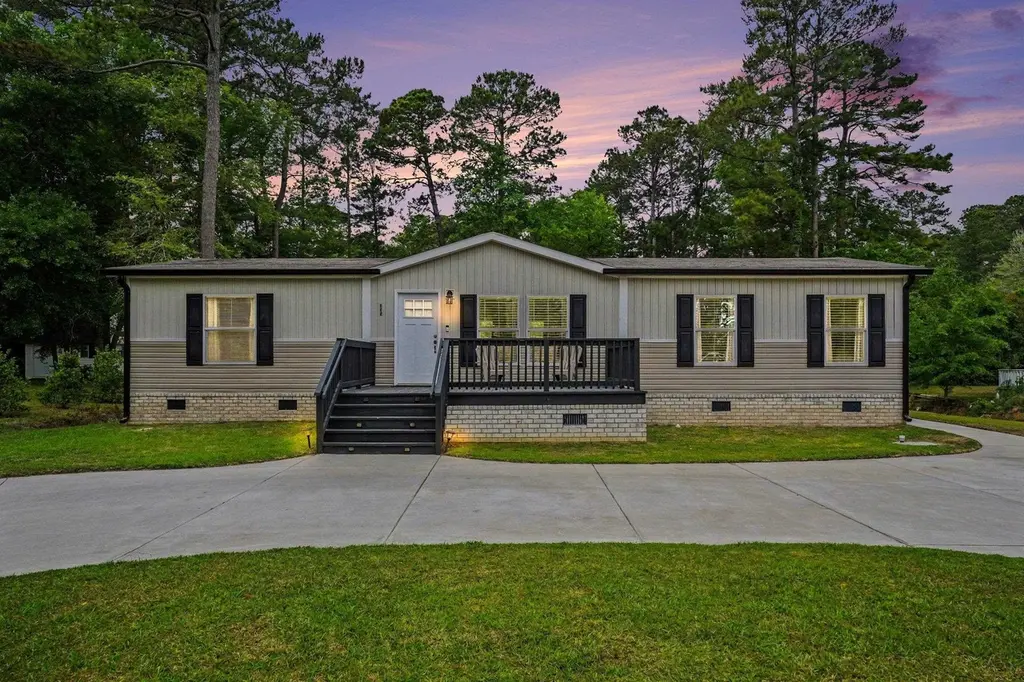
335 Ridgewood Dr NW · Carolina Shores, NC
Flood risk 3/10 · Minor
- FEMA flood zone
- X (unshaded)
- Chance of flooding over 30 yrs
- 0.2%
- Est. flood insurance / yr
- $507 – $1,088
Fire risk 3/10 · Minor
- Est. fire insurance / yr
- $906 – $1,684
Heat risk 9/10 · Severe
- Hot days now (above 106°F)
- 7 days/yr
- Hot days in 30 yrs
- 18 days/yr
Wind risk 8/10 · Major
- Chance of severe wind over 30 yrs
- 99.0%
Air-quality risk 2/10 · Minimal
- Unhealthy air days now
- 1 days/yr
- Unhealthy air days in 30 yrs
- 1 days/yr
Risk factors via First Street. Map © Google.
Why this score? — see what drove the F grade
The composite is a weighted blend of 9 inputs, each scored 0–100. Each bar is that input's sub-score; the figure is the points it added to the 100-point composite (weight × sub-score).
- Cash flow +13.6/30.0
- DSCR +4.1/10.0
- Schools +3.9/10.0
- Livability +3.2/5.0
- 1% rule +2.8/10.0
- Rent growth +2.5/5.0
- Condition / age +2.5/5.0
- ARV discount +0.0/15.0
- Appreciation +0.0/10.0
$285,000
🖨 Deal sheet (PDF) 📄 Offer letter ✓ Due diligence
Listing remarks MLS
LOW TAXES, GREAT WEATHER on the beautiful southeastern North Carolina coast. Ocean Forest is a neatly kept subdivision in rural Brunswick county about 1 mile from the SC border. Close also to the Calabash River, Sunset Beach, restaurants, shopping, dozens of premiere golf courses and all coastal beaches. This is a wooded lot in a community that Residents manage the POA and the architectural standards committee which allows stick built, modular and mew manufactured homes on a foundation. Offered below the tax value.
Key facts
- New stained decking
- Dimmer switches
- Flat back yard
Tags
Property features AI
Finance
- HOA & community: Homeowners association with $25 monthly fee (includes common areas)
Exterior
- Parking: Driveway with space for 4 vehicles
- Utilities: Electricity available; Sewer available; Public water available
- Home design: Double wide manufactured home; Resale property
- Construction: Vinyl siding; Crawlspace foundation; Built by Clayton Homes
- Exterior features: Deck; Front porch; Rectangular lot
Interior
- Kitchen: Dishwasher; Range; Refrigerator; Stainless steel appliances
- Flooring: Carpet; Luxury vinyl; Luxury vinyl plank
- Bathrooms: 2 full bathrooms
- Heating & cooling: Central heating; Central air conditioning
- Interior features: Split bedroom floorplan; Stainless steel appliances; Unfurnished
- Laundry & utility: Washer; Dryer
Neighborhood map
What this means for you Summary
Snapshot
- This is a 3-bed/2.0-bath manufactured listed at $285k.
Deal economics
- At list price, monthly cash flow is $15 ($182/yr) — positive.
- The deal already cash-flows at list — no discount required.
- To meet the 1% rule (rent ≥ 1% of price), the offer needs to be $221k (22.4% below list).
- Recommended offer: $221k (22.4% below list) — sets the bar for 1% rule.
- Cap rate 6.4% vs local median 3.9% in Carolina Shores — top-decile yield for the area; either an underpriced asset or a hidden risk that comps aren't pricing in. Stress-test before assuming the spread holds.
Location & tenants
- Location reads 64/100 on livability (#352 in NC) — a middle-class / working-renter tenant base. Strengths: housing A+, crime A, cost of living B+; Watch: health & safety D, amenities F, commute F.
- Brunswick County Schools (rural): math 45% / reading 47% proficiency, ranked #82 of 178 in NC (top 46%) — families likely to look elsewhere, expect single-tenant / working-renter base with shorter leases.
- Zoned schools: Jessie Mae Monroe Elementary (math 43% / reading 41%, grade F, #633 of 1,410 statewide, top 48%, 394 students, 99% FRL); Shallotte Middle (math 40% / reading 50%, grade D, #160 of 475 statewide, top 35%, 674 students, 100% FRL); West Brunswick High (math 50% / reading 56%, grade C-, #281 of 535 statewide, top 53%, 1,526 students, 100% FRL) — zoned schools average 100% FRL vs 53% district-wide (46 pts higher); higher-poverty schools than district average — tighter screening recommended.
- Market conditions: 703 active listings in the ZIP; 7 comparable units currently listed for rent nearby; rentals at typical pace (median 23d on market — plan ~3-4 weeks tenant-placement turnaround); solid renter incomes; 6,112 units permitted in Brunswick County in 2024 (990 in 5+ unit buildings).
- This rent runs 35% of the median local income ($75k/yr) — at the standard rent-burdened threshold; future hikes will face affordability resistance.
Forward outlook
- Local home prices are declining (-3.0%/yr); year-one equity from $2k of loan paydown is wiped out by about $9k of value loss. Plan a longer hold.
- Brunswick County population projected at +36% by 2050 — long-run rental-demand tailwind backs the buy-and-hold thesis.
Negotiation context
- Only 9 days on market — expect competitive offers; lowballing is unlikely to land.
- 8 sale attempts since 14y ago with the ask held roughly flat each time — persistent listings suggest the price (not the market) is what's stuck; bring a comps-based counter.
- Current owner paid $18k; list at $285k implies a 1441% gain — meaningful room to come down on a strong offer.
Risks & watch-outs
- Climate carrying-cost: severe wind risk, 99% chance of damaging wind over 30y; extreme-heat days projected 7→18/yr by 2055 (HVAC capex compounding) — expect insurance premiums to compound above CPI over the hold.
Questions for the listing agent
- What does the HOA fee cover, when was the last increase, and are there any pending special assessments or reserve-fund shortfalls?
- Is there a deadline driving the sale (1031 exchange, divorce, estate, relocation)? That informs how much negotiation room exists.
- Schools are F-rated, which usually means shorter tenancies and higher turnover. Who's the typical renter profile here, and what's been the actual vacancy rate?
- The area grade is low — what's the realistic commute time and amenity access for the typical tenant pool here? Any planned neighborhood developments (good or bad) we should know about?
- What's the average days-on-market for RENTAL listings here right now (not sales)? A rising rental-DOM trend means longer vacancies and softer asking-rent achievability than the comps imply.
- What's the recent tenant-quality profile in this submarket — average credit score on applications, eviction rate, late-payment / NSF rate, and stable-employment percentage? A property-management company in the area should have these aggregated.
- How much new for-sale + rental construction is in the pipeline within 1–3 miles? Heavy new supply typically softens prices + rents 12–24 months out; constrained supply supports both.
Investment metrics
- 1% rule
- 0.78% ✗
- Cap rate
- 6.36%
- Cash-on-cash
- 0.23%
- DSCR
- 1.01
- GRM
- 10.7
CMA / ARV
- ARV (on-the-fly)
- $238,336
- Comps found
- 11
Show comp detail 11 sales within ~0.75 mi
| Address | Dist | Beds/Ba | Sqft | Sold | Price | $/sf | Match |
|---|---|---|---|---|---|---|---|
| 368 Pinefield Ct NW | 0.07mi | 3/2.0 | 1,568 (0%) | 16mo | $243,000 | $155 | 83 |
| 313 Ocean Forest Dr NW | 0.23mi | 3/2.0 | 1,633 (+4%) | 1mo | $200,000 | $122 | 81 |
| 243 Ocean Forest Dr NW | 0.35mi | 3/2.0 | 1,548 (-1%) | 5mo | $200,000 | $129 | 78 |
| 259 Beachwood Dr NW | 0.09mi | 3/2.0 | 1,456 (-7%) | 15mo | $237,500 | $163 | 71 |
| 362 Pinefield Ct NW | 0.03mi | 2/2.0 (-1) | 1,715 (+9%) | 10mo | $261,000 | $152 | 70 |
| 308 Ridgewood Dr NW | 0.10mi | 3/2.0 | 1,344 (-14%) | 2mo | $200,000 | $149 | 70 |
| 256 Ocean Forest Dr NW | 0.34mi | 3/2.0 | 1,560 (-0%) | 17mo | $215,000 | $138 | 69 |
| 319 Beachwood Dr NW | 0.16mi | 3/2.0 | 1,620 (+3%) | 22mo | $274,500 | $169 | 69 |
| 407 Maplewood Dr NW | 0.15mi | 3/2.0 | 1,337 (-15%) | 1mo | $264,500 | $198 | 67 |
| 292 Sweet Gum Ct NW | 0.21mi | 3/2.5 | 1,761 (+12%) | 14mo | $228,500 | $130 | 56 |
| 235 Ocean Forest Dr NW | 0.33mi | 3/2.0 | 1,406 (-10%) | 15mo | $236,000 | $168 | 55 |
Match score weights: distance 35% · size 25% · config 20% · recency 20%. Top-matched comps best support the ARV.
Projected returns pro-forma
-3.0% appreciation · 3.0% rent growth · sell at horizon
- IRR
- -16.0%
- Equity multiple
- 0.43×
- Total profit
- $-45,327
- Equity at exit
- $42,494
- IRR
- -7.7%
- Equity multiple
- 0.52×
- Total profit
- $-38,681
- Equity at exit
- $24,642
Cash invested: $79,800 (down + closing). Projections, not guarantees.
Landlord ↔ Tenant lean methodology
- Overall (STATE)
- 85 Strongly Landlord-Friendly
- State North Carolina
- 85 Strongly Landlord-Friendly · R+3
- County
- — inherits STATE
- City
- — inherits STATE
ZIP-level market 28467
- Home prices YoY
- -33.7%
- Active inventory
- 703
- Price-to-rent
- 10.7×
Monthly cashflow live
- Estimated rent
- $2,212 high interval (Pro) →
- Mortgage (P&I)
- −$1,495
- Tax from tax record
- −$94 /mo · $1,123/yr
- Insurance
- −$119
- HOA
- −$25
- Vacancy / Maint / Mgmt
- −$464
- Net cashflow
- $15
Break-even live
Sensitivity live
| Price | -10% $177 | -5% $96 | +0% $15 | +5% $-65 | +10% $-146 |
|---|---|---|---|---|---|
| Rent | -10% $-160 | -5% $-72 | +0% $15 | +5% $103 | +10% $190 |
| Rate | -1.0pp $159 | -0.5pp $88 | base $15 | +0.5pp $-59 | +1.0pp $-134 |
UW: 25.0% down · 7.5% · 30yr · 1.5% tax · 5.0% vac · 8.0% maint · 8.0% mgmt
Financing live
Cash to close
- Down payment
- $71,250
- Closing costs
- $8,550
- Reserves months
- —
- Total cash needed
- —
Loan-product check · same deal, 3 products live
Conventional
25% down · 7.5% · 30yr
- Down + closing
- —
- Monthly P&I
- —
- Monthly cashflow
- —
- DSCR
- —
- Eligible?
- —
Personal DTI + credit; lowest rate.
DSCR
20% down · 8.5% · 30yr
- Down + closing
- —
- Monthly P&I
- —
- Monthly cashflow
- —
- DSCR
- —
- Eligible?
- —
No personal income docs; deal must DSCR.
Hard money
10% down · 12.0% · 12mo
- Down + closing
- —
- Monthly P&I
- —
- Monthly cashflow
- —
- DSCR
- —
- Eligible?
- —
Short-term bridge; refi at stabilization.
Rent comps 7 comps
| Address | Beds | Baths | Sqft | Rent | $/sqft | DOM | Units | Dist |
|---|---|---|---|---|---|---|---|---|
| 2033 Wild Indigo CIR NW Calabash, NC | 3.0 | 3.0 | 1457 | $1,775 | $1.22 | 25d | 1 | 0.47mi |
| 3021 Siskin Dr NW Calabash, NC | 2.0–3.0 | 2.0–2.5 | 1557 | $2,279 | $1.46 | 15d | 46 | 0.67mi |
| 31 Quaker Ridge Dr Calabash, NC | 2.0–3.0 | 2.0 | 1411 | $2,292 | $1.62 | 23d | 51 | 0.81mi |
| 1204 Calabash Station Blvd NW Ocean Isle Beach, NC | 3.0 | 2.0 | 1811 | $2,200 | $1.21 | 25d | 1 | 0.95mi |
| 1035 Brightwater Way Calabash, NC | 1.0–3.0 | 1.0–2.5 | 1327 | $2,145 | $1.62 | 25d | 1 | 1.12mi |
| 1016 Harbor Dr Calabash, NC | 4.0 | 2.0 | 1780 | $2,400 | $1.35 | 15d | 1 | 1.18mi |
| 70 Callaway Dr NW OCEAN ISL BCH, NC | 2.0–3.0 | 2.0 | 1324 | $1,882 | $1.42 | 15d | 35 | 1.21mi |
HOA detail
- Monthly dues
- $25 · $300/yr
Listing history 32 events
-
2026-06-22days on market $285,000 Active 9 DOM
-
2026-06-18days on market $285,000 Active 6 DOM
-
2026-06-17days on market $285,000 Active 5 DOM
-
2026-06-16days on market $285,000 Active 4 DOM
-
2026-06-15days on market $285,000 Active 3 DOM
-
2026-06-13remarks 699-char remark
-
2026-06-13pricedays on market $285,000 Active 1 DOM
-
2026-06-10days on market $295,000 Active 35 DOM
-
2026-06-09days on market $295,000 Active 34 DOM
-
2026-06-08days on market $295,000 Active 33 DOM
-
2026-06-07days on market $295,000 Active 32 DOM
-
2026-06-05days on market $295,000 Active 29 DOM
-
2026-06-03days on market $295,000 Active 28 DOM
-
2026-06-02days on market $295,000 Active 27 DOM
-
2026-06-01days on market $295,000 Active 26 DOM
-
2026-05-31days on market $295,000 Active 25 DOM
-
2026-05-30days on market $295,000 Active 24 DOM
-
2026-05-06$295,000 Active
-
2020-12-14soldstatus $18,500 520-char remark
Show marketing remark (520 chars)
LOW TAXES, GREAT WEATHER on the beautiful southeastern North Carolina coast. Ocean Forest is a neatly kept subdivision in rural Brunswick county about 1 mile from the SC border. Close also to the Calabash River, Sunset Beach, restaurants, shopping, dozens of premiere golf courses and all coastal beaches. This is a wooded lot in a community that Residents manage the POA and the architectural standards committee which allows stick built, modular and mew manufactured homes on a foundation. Offered below the tax value.
-
2020-02-18$19,900 520-char remark
Show marketing remark (520 chars)
LOW TAXES, GREAT WEATHER on the beautiful southeastern North Carolina coast. Ocean Forest is a neatly kept subdivision in rural Brunswick county about 1 mile from the SC border. Close also to the Calabash River, Sunset Beach, restaurants, shopping, dozens of premiere golf courses and all coastal beaches. This is a wooded lot in a community that Residents manage the POA and the architectural standards committee which allows stick built, modular and mew manufactured homes on a foundation. Offered below the tax value.
-
2019-12-23historical
-
2018-12-23$19,900
-
2018-10-20historical
-
2017-02-21$18,000
-
2016-12-31historical
-
2016-02-14$18,000
-
2015-06-30historical
-
2014-08-18$18,000
-
2014-02-28historical
-
2014-02-28historical
-
2012-10-15$28,000
-
2012-06-15$28,000
ⓘ Source: listings_history table (triggers on properties + properties_extension) + one-shot
backfill from property_details.listing_events for pre-trigger history.
Tax reassessment forecast NC · Resets to sale price
- Current annual tax
- $1,123 · $94/mo
- Projected year-2 tax
- $2,337 · $195/mo
- Expected delta
- +$1,214/yr (+$101/mo · 108.1%)
ⓘ Screening estimate from a state-policy table — verify with the county assessor before closing.
Climate risk First Street
- Flood 3/10 Moderate FEMA zone X (unshaded) · 20% chance over 30 yrs
- Wildfire 3/10 Moderate
- Heat 9/10 Extreme 7 d/yr ≥106°F today · 18 d/yr by 30 yrs out
- Wind 8/10 Severe 99% chance of damaging wind over 30 yrs
- Air quality 2/10 Low 1 unhealthy d/yr today · 1 by 30 yrs out
Nearby sold comps map
Loading sold comps map…
Walkable amenities ~0.75 mi
Loading nearby amenities…
Taxation est. · year 1
- Rental income
- $26,538
- − Mortgage interest
- −$15,964
- − Property taxes
- −$1,123
- − Insurance
- −$1,425
- − Repairs & maintenance
- −$2,123
- − Management
- −$2,123
- − HOA
- −$300
- − Depreciation
- −$8,291
- Taxable loss
- −$4,811
- Est. tax savings @ 24.0%
- +$1,155
- After-tax cash flow
- $1,337/yr
For passive investors: Depreciation is non-cash, so a rental often shows a tax loss while cash-flowing — sheltering income. Rental losses are passive: they offset passive income freely, and up to $25,000/yr can offset ordinary (W-2) income if you actively participate and your MAGI is under $100k (phasing out to $0 by $150k); unused losses carry forward. On sale, claimed depreciation is recaptured at up to 25%, and gains may owe capital-gains tax (a 1031 exchange can defer both). Figures are a year-1 estimate at your 24.0% rate — not tax advice; consult a CPA.
Schools (NCES district)
- District
- Brunswick County Schools
- NCES district ID
- 3700420
- Math proficiency
- 45% ▲ 4.00%
- Reading proficiency
- 47% ▲ 4.00%
- Median HH income
- $47,494
- Composite
- 39.23/100
- National rank
- #4011
- State rank
- #82 of 178 in NC
Livability — Carolina Shores
- Score
- 64/100
- State rank
- #352
- US rank
- #13907
Category grades
Schools grade is shown separately in the Schools card above.
Census & demographics
- County
- Brunswick County · 131,536 people
- City population
- 13,313
- Metro
- Myrtle Beach-Conway-North Myrtle Beach, SC-NC
- Population (ZIP)
- 13,313
- Household income
- $75,341
- Rent vs Own
- Severe rent burden
- 81.0
Population outlook (Brunswick County) Hauer SSP2
- Today (2025)
- 152,111 people
- By 2030
- 165,705 · +8.9%
- By 2040
- 188,494 · +23.9%
- By 2050
- 206,228 · +35.6%
- By 2075
- 237,876 · +56.4%
- By 2100
- 251,451 · +65.3%
Race, ethnicity, and origin ACS 2023
- Neighborhood character
- Predominantly White (90%)
- Race & ethnicity
- White 90% Two or more races 4% Black 3% Hispanic / Latino 2%
- Common ancestry
- Slovak 5% Romanian 5% Lithuanian 3%
- Foreign-born
- 3% · Canada
- Languages at home
- 98% English-only · Spanish 1%
Political lean MEDSL · Brunswick
- 2024 margin
- Strong R (+24.9) · D 37.2% · R 62.0%
- 2008→2024 swing
- -6.9pp toward R · 2008: -17.9pp · 2024: -24.9pp
- All cycles
- 2024: R+24.9 2020: R+25.0 2016: R+28.7 2012: R+22.2 2008: R+17.9
Not yet ingested
- Civics
- —
Market trends
- HPI YoY
- ▼ -67.90%
- Current HPI
- 133.7186
- Rent YoY
- —
- Metro
- Myrtle Beach-Conway-North Myrtle Beach, SC-NC
- State GDP YoY
- ▲ 3.28%
- F500 in state
- 26
Industry mix (Fortune 500 HQ in NC)
| Industry | F500 HQs | Revenue |
|---|---|---|
| Financial Services | 2 | $213B |
|
||
| Retail | 2 | $95B |
|
||
| Industrial Conglomerate | 1 | $38B |
|
||
| Metals / Steel | 1 | $35B |
|
||
| Utilities | 1 | $30B |
|
||
| Industrial Machinery | 1 | $19B |
|
||
Price history
+953.6% since first listed15 events — show timeline
- 2026-05-06 Listed $295,000 CCAR
- 2020-12-14 Sold (MLS) $18,500 Hive MLS
- 2020-02-18 Listed $19,900 Hive MLS
- 2019-12-23 Listing Removed — Hive MLS
- 2018-12-23 Listed $19,900 Hive MLS
- 2018-10-20 Listing Removed — Hive MLS
- 2017-02-21 Listed $18,000 Hive MLS
- 2016-12-31 Listing Removed — Hive MLS
- 2016-02-14 Listed $18,000 Hive MLS
- 2015-06-30 Listing Removed — Hive MLS
- 2014-08-18 Listed $18,000 Hive MLS
- 2014-02-28 Listing Removed — Hive MLS
- 2014-02-28 Listing Removed — Hive MLS
- 2012-10-15 Listed $28,000 Hive MLS
- 2012-06-15 Listed $28,000 Hive MLS
Property tax history
+35.3%/yrLatest (2025): $1,123 · +2.7% YoY. Source: county tax records.
Cash-flow waterfall
monthlySold comps — $/sqft
last 12 mo · ≤1 miLoading sold comps…