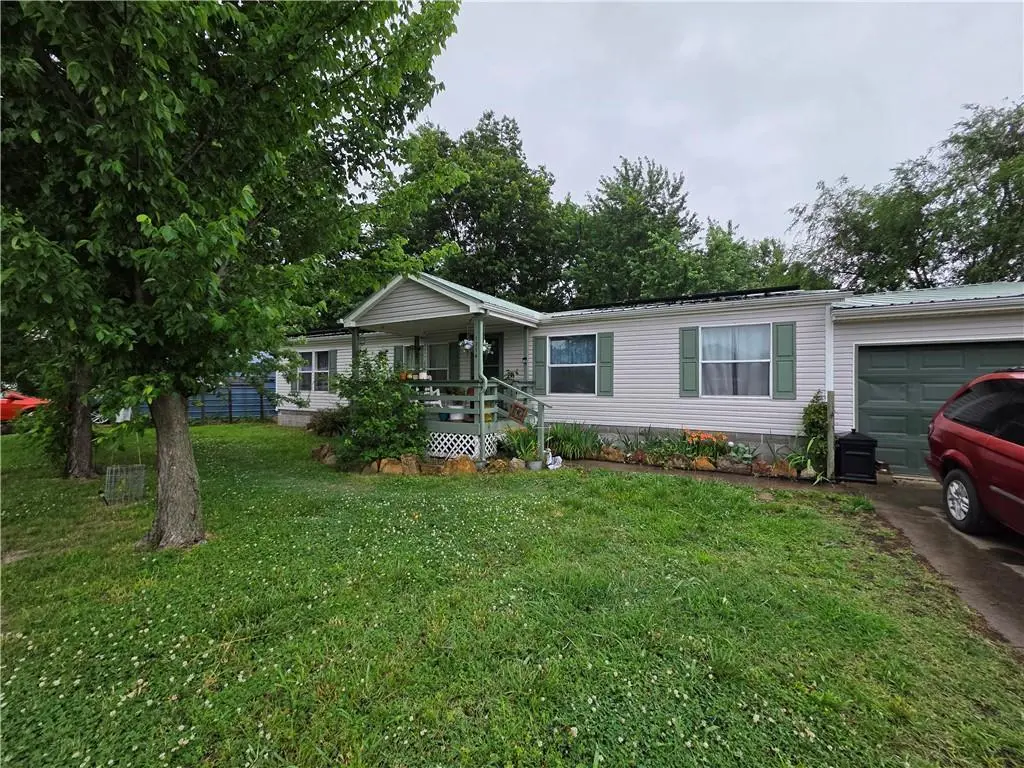
1314 S 26th St · Parsons, KS
Flood risk 1/10 · Minimal
- FEMA flood zone
- X (unshaded)
- Chance of flooding over 30 yrs
- 0.0%
- Est. flood insurance / yr
- $507 – $1,088
Fire risk 4/10 · Minor
- Est. fire insurance / yr
- $1,154 – $2,142
Heat risk 5/10 · Moderate
- Hot days now (above 108°F)
- 7 days/yr
- Hot days in 30 yrs
- 19 days/yr
Wind risk 2/10 · Minimal
- Chance of severe wind over 30 yrs
- 2.0%
Air-quality risk 2/10 · Minimal
- Unhealthy air days now
- 1 days/yr
- Unhealthy air days in 30 yrs
- 1 days/yr
Risk factors via First Street. Map © Google.
Why this score? — see what drove the C grade
The composite is a weighted blend of 9 inputs, each scored 0–100. Each bar is that input's sub-score; the figure is the points it added to the 100-point composite (weight × sub-score).
- Cash flow +19.4/30.0
- ARV discount +15.0/15.0
- DSCR +6.1/10.0
- 1% rule +5.2/10.0
- Livability +3.5/5.0
- Rent growth +2.5/5.0
- Condition / age +2.5/5.0
- Schools +2.0/10.0
- Appreciation +0.0/10.0
$109,000
🖨 Deal sheet 📄 Offer letter ✓ Due diligence
Key facts
- Newer heater
- Open concept
- Attached bathroom
Tags
Property features AI
Finance
- Other: Living area reported as 1,612 (source: public records); Age approximately 21–30 years
- HOA & community: No association fees
Exterior
- Parking: Attached parking; Carport; 1-car garage
- Utilities: Public water; Public sewer
- Home design: Single-family residence; Manufactured home (manufactured type); Ranch floor plan
- Construction: Frame construction; Composition roof
- Exterior features: Deck; Metal fencing; Lot approximately 0.81 acres; Not in a flood plain
Interior
- Kitchen: Eat-in kitchen; Dishwasher
- Bedrooms: 3 bedrooms
- Bathrooms: 2 full bathrooms
- Heating & cooling: Electric heating; Electric cooling (air conditioning)
- Interior features: Dishwasher; Eat-in kitchen
- Laundry & utility: Dedicated laundry room; Concrete basement
Neighborhood map
What this means for you Summary
Snapshot
- This is a 3-bed/2.0-bath single-family listed at $109k.
Deal economics
- At list price, monthly cash flow is $121 ($1k/yr) — positive.
- The deal already cash-flows at list — no discount required.
- Meets the 1% rule at list price ($1k rent vs $109k).
- Cap rate 7.6% vs local median 4.6% in Parsons — top-decile yield for the area; either an underpriced asset or a hidden risk that comps aren't pricing in. Stress-test before assuming the spread holds.
Location & tenants
- Location reads 70/100 on livability (#164 in KS) — a middle-class / working-renter tenant base. Strengths: cost of living A+, housing A+, health & safety A+; Watch: employment D, schools F, crime F.
- Parsons (town): math 21% / reading 28% proficiency, ranked #143 of 169 in KS (top 85%) — low school quality limits family demand, transient renter base, plan for 1-2y turnover.
- Market conditions: 43 active listings in the ZIP; 1 units permitted in Labette County in 2024 (0 in 5+ unit buildings).
Forward outlook
- Local home prices are declining (-3.0%/yr); year-one equity from $754 of loan paydown is wiped out by about $3k of value loss. Plan a longer hold.
- Labette County population projected at -24% by 2050 — secular population decline; favor cash flow + early exit over multi-decade hold.
Negotiation context
- Only 12 days on market — expect competitive offers; lowballing is unlikely to land.
- Current owner paid $32k; list at $109k implies a 241% gain — meaningful room to come down on a strong offer.
Risks & watch-outs
- Climate carrying-cost: extreme-heat days projected 7→19/yr by 2055 (HVAC capex compounding) — expect insurance premiums to compound above CPI over the hold.
Questions for the listing agent
- Is there a deadline driving the sale (1031 exchange, divorce, estate, relocation)? That informs how much negotiation room exists.
- Schools are F-rated, which usually means shorter tenancies and higher turnover. Who's the typical renter profile here, and what's been the actual vacancy rate?
- Crime grade is F in this area — have there been break-ins, vandalism, or insurance claims at this property in the last 3 years? What carrier currently insures it and at what premium?
- What's the average days-on-market for RENTAL listings here right now (not sales)? A rising rental-DOM trend means longer vacancies and softer asking-rent achievability than the comps imply.
- What's the recent tenant-quality profile in this submarket — average credit score on applications, eviction rate, late-payment / NSF rate, and stable-employment percentage? A property-management company in the area should have these aggregated.
- How much new for-sale + rental construction is in the pipeline within 1–3 miles? Heavy new supply typically softens prices + rents 12–24 months out; constrained supply supports both.
Investment metrics
- 1% rule
- 1.02% ✓
- Cap rate
- 7.63%
- Cash-on-cash
- 4.77%
- DSCR
- 1.21
- GRM
- 8.2
CMA / ARV
- ARV (on-the-fly)
- $146,692
- Comps found
- 12
Show comp detail 12 sales within ~0.75 mi
| Address | Dist | Beds/Ba | Sqft | Sold | Price | $/sf | Match |
|---|---|---|---|---|---|---|---|
| 2330 Briggs Ave Ave | 0.18mi | 3/2.0 | 1,580 (-2%) | 2mo | $130,000 | $82 | 87 |
| 1222 Richard Ave | 0.18mi | 3/2.0 | 1,491 (-8%) | 2mo | $114,000 | $76 | 77 |
| 1018 S 29th St | 0.30mi | 3/2.0 | 1,692 (+5%) | 18mo | $178,500 | $105 | 63 |
| 2813 Ward Ave | 0.24mi | 4/2.0 (+1) | 1,425 (-12%) | 2mo | $85,000 | $60 | 63 |
| 3107 Wilson Ave | 0.52mi | 3/1.5 | 1,596 (-1%) | 17mo | $149,000 | $93 | 58 |
| 3109 Wilson Ave | 0.54mi | 3/2.5 | 1,696 (+5%) | 16mo | $155,000 | $91 | 51 |
| 1107 30th Dr | 0.40mi | 3/2.0 | 1,735 (+8%) | 22mo | $130,000 | $75 | 51 |
| 3105 Appleton Ave | 0.65mi | 3/2.0 | 1,746 (+8%) | 9mo | $134,900 | $77 | 49 |
| 3008 Southern Ave | 0.48mi | 4/2.0 (+1) | 1,425 (-12%) | 9mo | $195,000 | $137 | 46 |
| 3110 Partridge Ave | 0.54mi | 4/2.0 (+1) | 1,812 (+12%) | 14mo | $165,000 | $91 | 38 |
| 2720 Appleton Ave | 0.46mi | 3/2.5 | 1,820 (+13%) | 23mo | $169,900 | $93 | 36 |
| 615 S 23rd St | 0.52mi | 3/1.0 | 1,400 (-13%) | 22mo | $95,000 | $68 | 31 |
Match score weights: distance 35% · size 25% · config 20% · recency 20%. Top-matched comps best support the ARV.
Projected returns pro-forma
-3.0% appreciation · 3.0% rent growth · sell at horizon
- IRR
- -8.9%
- Equity multiple
- 0.67×
- Total profit
- $-9,926
- Equity at exit
- $16,252
- IRR
- 0.6%
- Equity multiple
- 1.04×
- Total profit
- $1,365
- Equity at exit
- $9,424
Cash invested: $30,520 (down + closing). Projections, not guarantees.
Landlord ↔ Tenant lean methodology
- Overall (STATE)
- 83 Strongly Landlord-Friendly
- State Kansas
- 83 Strongly Landlord-Friendly · R+10
- County
- — inherits STATE
- City
- — inherits STATE
ZIP-level market 67357
- Home prices YoY
- -20.4%
- Active inventory
- 43
- Price-to-rent
- 8.2×
Monthly cashflow live
- Estimated rent
- $1,107 medium interval (Pro) →
- Mortgage (P&I)
- −$572
- Tax est. 1.5%
- −$136 /mo · $1,635/yr
- Insurance
- −$45
- HOA
- −$0
- Vacancy / Maint / Mgmt
- −$232
- Net cashflow
- $121
Break-even live
UW: 25.0% down · 7.5% · 30yr · 1.5% tax · 5.0% vac · 8.0% maint · 8.0% mgmt
Financing live
Cash to close
- Down payment
- $27,250
- Closing costs
- $3,270
- Reserves months
- —
- Total cash needed
- —
Loan-product check · same deal, 3 products live
Conventional
25% down · 7.5% · 30yr
- Down + closing
- —
- Monthly P&I
- —
- Monthly cashflow
- —
- DSCR
- —
- Eligible?
- —
Personal DTI + credit; lowest rate.
DSCR
20% down · 8.5% · 30yr
- Down + closing
- —
- Monthly P&I
- —
- Monthly cashflow
- —
- DSCR
- —
- Eligible?
- —
No personal income docs; deal must DSCR.
Hard money
10% down · 12.0% · 12mo
- Down + closing
- —
- Monthly P&I
- —
- Monthly cashflow
- —
- DSCR
- —
- Eligible?
- —
Short-term bridge; refi at stabilization.
Listing history 10 events
-
2026-06-18days on market $109,000 Active 12 DOM
-
2026-06-17days on market $109,000 Active 11 DOM
-
2026-06-16days on market $109,000 Active 10 DOM
-
2026-06-16price $109,000 Active 9 DOM
-
2026-06-15days on market $120,000 Active 9 DOM
-
2026-06-13days on market $120,000 Active 7 DOM
-
2026-06-12days on market $120,000 Active 6 DOM
-
2026-06-09days on market $120,000 Active 3 DOM
-
2026-06-08days on market $120,000 Active 2 DOM
-
2026-06-07$120,000 Active 1 DOM
ⓘ Source: listings_history table (triggers on properties + properties_extension) + one-shot
backfill from property_details.listing_events for pre-trigger history.
Climate risk First Street
- Flood 1/10 Low FEMA zone X (unshaded) · 0% chance over 30 yrs
- Wildfire 4/10 Moderate
- Heat 5/10 Major 7 d/yr ≥108°F today · 19 d/yr by 30 yrs out
- Wind 2/10 Low 2% chance of damaging wind over 30 yrs
- Air quality 2/10 Low 1 unhealthy d/yr today · 1 by 30 yrs out
Nearby sold comps map
Loading sold comps map…
Walkable amenities ~0.75 mi
Loading nearby amenities…
Taxation est. · year 1
- Rental income
- $13,283
- − Mortgage interest
- −$6,106
- − Property taxes
- −$1,635
- − Insurance
- −$545
- − Repairs & maintenance
- −$1,063
- − Management
- −$1,063
- − Depreciation
- −$3,171
- Taxable loss
- −$299
- Est. tax savings @ 24.0%
- +$72
- After-tax cash flow
- $1,526/yr
For passive investors: Depreciation is non-cash, so a rental often shows a tax loss while cash-flowing — sheltering income. Rental losses are passive: they offset passive income freely, and up to $25,000/yr can offset ordinary (W-2) income if you actively participate and your MAGI is under $100k (phasing out to $0 by $150k); unused losses carry forward. On sale, claimed depreciation is recaptured at up to 25%, and gains may owe capital-gains tax (a 1031 exchange can defer both). Figures are a year-1 estimate at your 24.0% rate — not tax advice; consult a CPA.
Schools (NCES district)
- District
- Parsons
- NCES district ID
- 2010560
- Math proficiency
- 21% ▼ -7.00%
- Reading proficiency
- 28% ▼ -3.00%
- Median HH income
- $37,868
- Composite
- 20.46/100
- National rank
- #8576
- State rank
- #143 of 169 in KS
Livability — Parsons
- Score
- 70/100
- State rank
- #164
- US rank
- #7726
Category grades
Schools grade is shown separately in the Schools card above.
Census & demographics
- Census place
- Parsons, KS
- City population
- 11,786
- Population (ZIP)
- 11,786
Population outlook (Labette County) Hauer SSP2
- Today (2025)
- 19,413 people
- By 2030
- 18,552 · -4.4%
- By 2040
- 16,701 · -14.0%
- By 2050
- 14,832 · -23.6%
- By 2075
- 11,046 · -43.1%
- By 2100
- 8,020 · -58.7%
Race, ethnicity, and origin ACS 2023
- Neighborhood character
- Predominantly White (81%)
- Race & ethnicity
- White 81% Two or more races 7% Hispanic / Latino 7% Black 5%
- Hispanic origin (detail)
- Mexican 5% Puerto Rican 1%
- Common ancestry
- Slovak 2% Lithuanian 2% Italian 1%
- Foreign-born
- 0%
- Languages at home
- 98% English-only · Spanish 1% German/W. Germanic 1%
Political lean MEDSL · Labette
- 2024 margin
- Solid R (+38.2) · D 30.1% · R 68.3% · Other 1.6%
- 2008→2024 swing
- -25.3pp toward R · 2008: -12.9pp · 2024: -38.2pp
- All cycles
- 2024: R+38.2 2020: R+36.0 2016: R+37.9 2012: R+20.2 2008: R+12.9
Not yet ingested
- Civics
- —
Market trends
- HPI YoY
- ▼ -37.97%
- Current HPI
- 147.8259
- Rent YoY
- —
- Metro
- —
- State GDP YoY
- —
- F500 in state
- 0
Price history
+900.0% since first listed4 events — show timeline
- 2026-06-06 Listed $120,000 Heartland MLS as Distributed by MLS Grid
- 2005-08-01 Sold (Public Records) $32,000 Public Records
- 2002-12-01 Sold (Public Records) $65,565 Public Records
- 2001-06-01 Sold (Public Records) $12,000 Public Records
Cash-flow waterfall
monthlySold comps — $/sqft
last 12 mo · ≤1 miLoading sold comps…