 🔨 Auction
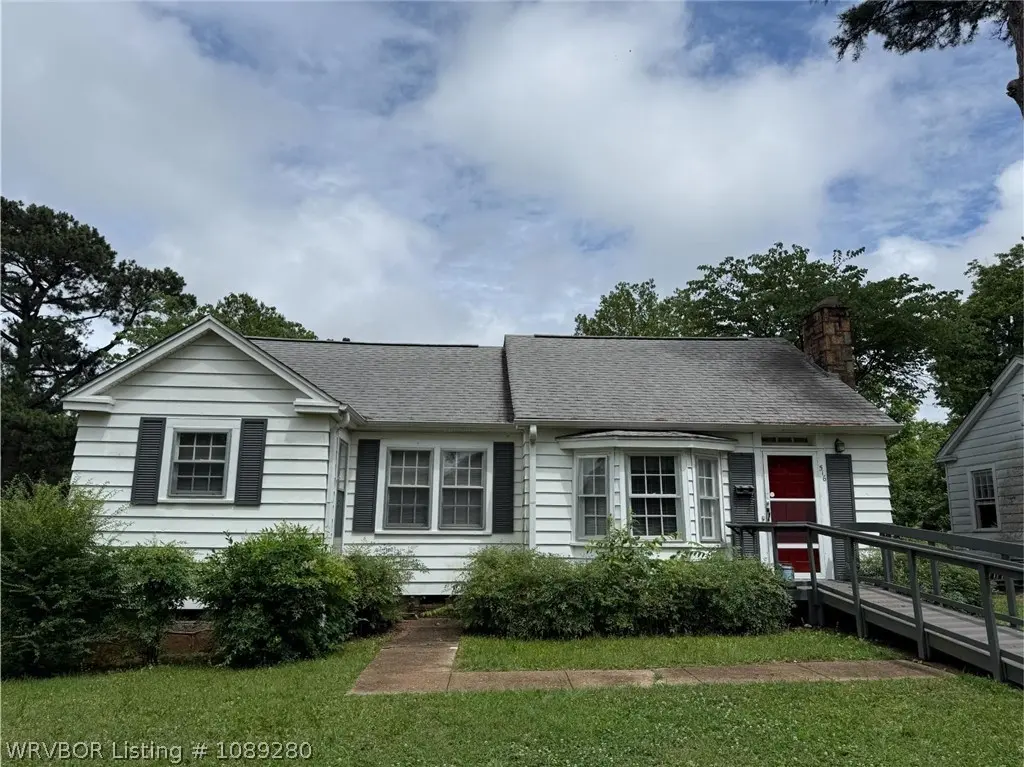
516 41st St · Fort Smith, AR
Flood risk 1/10 · Minimal
- FEMA flood zone
- X (unshaded)
- Chance of flooding over 30 yrs
- 0.0%
- Est. flood insurance / yr
- $507 – $1,088
Fire risk 1/10 · Minimal
- Est. fire insurance / yr
- $1,499 – $2,785
Heat risk 7/10 · Major
- Hot days now (above 112°F)
- 7 days/yr
- Hot days in 30 yrs
- 20 days/yr
Wind risk 2/10 · Minimal
- Chance of severe wind over 30 yrs
- 3.0%
Air-quality risk 2/10 · Minimal
- Unhealthy air days now
- 0 days/yr
- Unhealthy air days in 30 yrs
- 1 days/yr
Risk factors via First Street. Map © Google.
Why this score? — see what drove the F grade
The composite is a weighted blend of 9 inputs, each scored 0–100. Each bar is that input's sub-score; the figure is the points it added to the 100-point composite (weight × sub-score).
- ARV discount +7.5/15.0
- Cash flow +6.5/30.0
- Rent growth +3.7/5.0
- Livability +3.2/5.0
- Schools +3.1/10.0
- Condition / age +2.2/5.0
- 1% rule +1.6/10.0
- DSCR +0.8/10.0
- Appreciation +0.0/10.0
$1
🖨 Deal sheet 📄 Offer letter ✓ Due diligence
Listing remarks
Auction 6/23/2026 @ 11 am. This well-kept, approximately 1,474 sf home is situated on a corner lot and features 3 bedrooms, 1.5 baths, a 1-car carport, and low-maintenance metal siding. The property has seen several practical improvements in recent years, including updates to the plumbing, HVAC, and roof. Interior features include a wood-burning fireplace and original wood flooring under the current carpet. This will make a great home or investment property.
Key facts
- Updates to plumbing
- Updates to hvac
- Updates to roof
Tags
Property features AI
Exterior
- Parking: Detached carport; 1 covered parking space
- Utilities: Public water; Electricity available; Natural gas available
- Home design: Single-family house; One story; Accessible entrance with ramp
- Construction: Metal siding; Shingle roof
- Exterior features: Corner lot; Paved public road access; Outbuilding; No fencing
Interior
- Kitchen: Dishwasher; Gas water heater
- Flooring: Carpet; Vinyl; Wood
- Bathrooms: 1 full bathroom; 1 half bathroom
- Heating & cooling: Central heating; Central air; Ceiling fans
- Interior features: Ceiling fans; Family room fireplace
- Laundry & utility: Electric dryer hookup
Neighborhood map
What this means for you Summary
Snapshot
- This is a 3-bed/1.5-bath single-family listed at $1. Condition is rated fair.
Deal economics
- At list price, monthly cash flow is $-299 ($-4k/yr) — negative.
- The deal already cash-flows at list — no discount required.
- Meets the 1% rule at list price ($1k rent vs $1).
Location & tenants
- Location reads 65/100 on livability (#151 in AR) — a middle-class / working-renter tenant base. Strengths: cost of living A+, housing A+, health & safety A+; Watch: crime F, amenities F, commute F.
- Fort Smith School District (urban): math 35% / reading 39% proficiency, ranked #106 of 238 in AR (top 44%) — families likely to look elsewhere, expect single-tenant / working-renter base with shorter leases; 64% free/reduced lunch — lower-income household profile, screen leases tightly.
- Zoned schools: Sunnymede Elementary School (math 23% / reading 27%, grade F, #345 of 454 statewide, top 76%, 468 students, 93% FRL); Dora Kimmons Jr. High School (math 22% / reading 32%, grade F, #156 of 201 statewide, top 78%, 841 students, 91% FRL); Northside High School (math 12% / reading 27%, grade F, #239 of 292 statewide, top 85%, 2,433 students, 74% FRL) — zoned schools average 86% FRL vs 64% district-wide (22 pts higher); higher-poverty schools than district average — tighter screening recommended.
- Zoned-school proficiency averages 24% at this address vs 37% district-wide (-13 pts) — the specific schools serving this property underperform the Fort Smith School District average; the district grade overstates school quality for this exact location.
- Market conditions: Rents rising fast (+4.9%/yr); 197 active listings in the ZIP; 21 comparable units currently listed for rent nearby; rentals at typical pace (median 21d on market — plan ~3-4 weeks tenant-placement turnaround); 388 units permitted in Sebastian County in 2024 (16 in 5+ unit buildings).
Forward outlook
- Local home prices are declining (-3.0%/yr); year-one equity from $1k of loan paydown is wiped out by about $5k of value loss. Plan a longer hold.
- Sebastian County population projected at +7% by 2050 — modest demand growth; plan on rents tracking national, not racing it.
Negotiation context
- It's been on market 27 days — a 2% lower offer ($0) is reasonable based on typical stale-listing flexibility.
Risks & watch-outs
- Watch-outs: property tax is 263109.0% of price.
- Climate carrying-cost: extreme-heat days projected 7→20/yr by 2055 (HVAC capex compounding) — expect insurance premiums to compound above CPI over the hold.
Questions for the listing agent
- What do current leases actually rent for vs. the listed asking? Can we see a recent rent roll and the last 12 months of T-12 income?
- Have any recent inspections been done? Can we get a copy of the seller's disclosures and any deferred-maintenance estimates?
- Property tax is high relative to price — has the assessment been appealed recently, and will the sale trigger a re-assessment?
- Is there a deadline driving the sale (1031 exchange, divorce, estate, relocation)? That informs how much negotiation room exists.
- Schools are D-rated, which usually means shorter tenancies and higher turnover. Who's the typical renter profile here, and what's been the actual vacancy rate?
- Crime grade is F in this area — have there been break-ins, vandalism, or insurance claims at this property in the last 3 years? What carrier currently insures it and at what premium?
- The area grade is low — what's the realistic commute time and amenity access for the typical tenant pool here? Any planned neighborhood developments (good or bad) we should know about?
- What's the average days-on-market for RENTAL listings here right now (not sales)? A rising rental-DOM trend means longer vacancies and softer asking-rent achievability than the comps imply.
- What's the recent tenant-quality profile in this submarket — average credit score on applications, eviction rate, late-payment / NSF rate, and stable-employment percentage? A property-management company in the area should have these aggregated.
- How much new for-sale + rental construction is in the pipeline within 1–3 miles? Heavy new supply typically softens prices + rents 12–24 months out; constrained supply supports both.
Investment metrics
- 1% rule
- 0.66% ✗
- Cap rate
- 4.25%
- Cash-on-cash
- -7.30%
- DSCR
- 0.68
- GRM
- 12.6
CMA / ARV
- ARV (on-the-fly)
- $175,406
- Comps found
- 12
Show comp detail 12 sales within ~0.75 mi
| Address | Dist | Beds/Ba | Sqft | Sold | Price | $/sf | Match |
|---|---|---|---|---|---|---|---|
| 510 N 40th St | 0.07mi | 3/2.0 | 1,376 (-7%) | 3mo | $164,900 | $120 | 81 |
| 3710 Park Ave | 0.30mi | 3/1.5 | 1,510 (+2%) | 2mo | $180,000 | $119 | 80 |
| 705 N 41st St | 0.17mi | 4/2.0 (+1) | 1,432 (-3%) | 1mo | $149,900 | $105 | 80 |
| 428 N 35th St | 0.42mi | 3/1.5 | 1,420 (-4%) | 2mo | $110,000 | $77 | 73 |
| 801 N 46 St | 0.41mi | 3/2.0 | 1,414 (-4%) | 7mo | $154,000 | $109 | 66 |
| 919 Clifton Ct | 0.63mi | 3/1.5 | 1,455 (-1%) | 4mo | $176,000 | $121 | 66 |
| 1015 N 41st St | 0.36mi | 3/2.0 | 1,300 (-12%) | 2mo | $167,900 | $129 | 60 |
| 634 Clifton Ct | 0.55mi | 2/2.0 (-1) | 1,555 (+6%) | 1mo | $90,000 | $58 | 58 |
| 4321 Free Ferry Ln | 0.40mi | 3/1.5 | 1,266 (-14%) | 2mo | $195,000 | $154 | 56 |
| 1123 N 41st St | 0.44mi | 4/1.5 (+1) | 1,678 (+14%) | 2mo | $156,000 | $93 | 50 |
| 1301 N 46th St | 0.61mi | 3/2.0 | 1,280 (-13%) | 1mo | $171,500 | $134 | 47 |
| 1205 N 40th St | 0.47mi | 2/1.0 (-1) | 1,307 (-11%) | 7mo | $79,000 | $60 | 46 |
Match score weights: distance 35% · size 25% · config 20% · recency 20%. Top-matched comps best support the ARV.
Projected returns pro-forma
-3.0% appreciation · 4.9% rent growth · sell at horizon
- IRR
- -26.9%
- Equity multiple
- 0.08×
- Total profit
- $-45,189
- Equity at exit
- $26,154
- IRR
- -19.1%
- Equity multiple
- -0.10×
- Total profit
- $-54,182
- Equity at exit
- $15,166
Cash invested: $49,114 (down + closing). Projections, not guarantees.
Landlord ↔ Tenant lean methodology
- Overall (STATE)
- 92 Strongly Landlord-Friendly
- State Arkansas
- 92 Strongly Landlord-Friendly · R+14
- County
- — inherits STATE
- City
- — inherits STATE
ZIP-level market 72903
- Rents YoY
- 4.9%
- Active inventory
- 197
Monthly cashflow live
- Estimated rent
- $1,156 high interval (Pro) →
- Mortgage (P&I)
- −$920
- Tax est. 1.5%
- −$219 /mo · $2,631/yr
- Insurance
- −$73
- HOA
- −$0
- Vacancy / Maint / Mgmt
- −$243
- Net cashflow
- $-299
Break-even live
UW: 25.0% down · 7.5% · 30yr · 1.5% tax · 5.0% vac · 8.0% maint · 8.0% mgmt
Financing live
Cash to close
- Down payment
- $43,852
- Closing costs
- $5,262
- Reserves months
- —
- Total cash needed
- —
Loan-product check · same deal, 3 products live
Conventional
25% down · 7.5% · 30yr
- Down + closing
- —
- Monthly P&I
- —
- Monthly cashflow
- —
- DSCR
- —
- Eligible?
- —
Personal DTI + credit; lowest rate.
DSCR
20% down · 8.5% · 30yr
- Down + closing
- —
- Monthly P&I
- —
- Monthly cashflow
- —
- DSCR
- —
- Eligible?
- —
No personal income docs; deal must DSCR.
Hard money
10% down · 12.0% · 12mo
- Down + closing
- —
- Monthly P&I
- —
- Monthly cashflow
- —
- DSCR
- —
- Eligible?
- —
Short-term bridge; refi at stabilization.
Rent comps 21 comps
| Address | Beds | Baths | Sqft | Rent | $/sqft | DOM | Units | Dist |
|---|---|---|---|---|---|---|---|---|
| 811 N 41st St Fort Smith, AR | 2.0 | 1.0 | 1306 | $900 | $0.69 | 13d | 1 | 0.23mi |
| 813 N 48th St Fort Smith, AR | 2.0 | 1.0 | 1170 | $800 | $0.68 | 21d | 1 | 0.52mi |
| 3101 Park Ave Fort Smith, AR | 3.0 | 2.0 | 1634 | $1,650 | $1.01 | 13d | 1 | 0.68mi |
| 4911 Free Ferry Rd Unit Vi Fort Smith, AR | 2.0 | 2.0 | 1232 | $1,150 | $0.93 | 21d | 1 | 0.69mi |
| 3014 Presley St Unit FB44 Fort Smith, AR | 2.0 | 1.5 | 1040 | $925 | $0.89 | 21d | 1 | 0.74mi |
| 3014 Presley St Fort Smith, AR | 1.0–2.0 | 1.0–1.5 | 782 | $925 | $1.18 | 13d | 4 | 0.74mi |
| 1453 N 35th St Fort Smith, AR | 2.0 | 1.0 | 913 | $900 | $0.99 | 21d | 1 | 0.81mi |
| 1331 S 46th St Fort Smith, AR | 1.0–2.0 | 1.0–1.5 | 1075 | $1,150 | $1.07 | 13d | 6 | 0.83mi |
| 3906 S N St Unit 3904 Fort Smith, AR | 2.0 | 1.5 | 1024 | $800 | $0.78 | 21d | 1 | 0.83mi |
| 501 N May Ave Fort Smith, AR | 2.0 | 1.0 | 1022 | $825 | $0.81 | 21d | 1 | 0.88mi |
| 3500 S N St Fort Smith, AR | 1.0–2.0 | 1.0–1.5 | 834 | $935 | $1.12 | 21d | 1 | 0.93mi |
| 400 Lincoln Ln Fort Smith, AR | 1.0–4.0 | 1.0–4.0 | 1425 | $1,182 | $0.83 | 13d | 16 | 1.01mi |
| 406 Rockefeller Pl Fort Smith, AR | 4.0 | 4.0 | 1800 | $1,699 | $0.94 | 21d | 1 | 1.03mi |
| 5700 Grand Ave Fort Smith, AR | 3.0 | 2.0 | 1605 | $1,500 | $0.93 | 21d | 1 | 1.09mi |
| 5900 Kinkead Ave Fort Smith, AR | 1.0–3.0 | 1.0–2.0 | 870 | $895 | $1.03 | 13d | 18 | 1.14mi |
| 5801 Kinkead Ave Fort Smith, AR | 1.0–3.0 | 1.0–2.0 | 805 | $875 | $1.09 | 13d | 7 | 1.15mi |
| 2820 S O St Fort Smith, AR | 2.0 | 1.5 | 1024 | $875 | $0.85 | 21d | 1 | 1.24mi |
| 4300 Wynnewood Dr Unit 2 Fort Smith, AR | 2.0 | 2.0 | 1200 | $1,100 | $0.92 | 21d | 1 | 1.36mi |
| 5200 S U St Apt 56 Fort Smith, AR | 2.0 | 2.0 | 980 | $745 | $0.76 | 21d | 1 | 1.47mi |
| 60 Jeffrey Way Unit 1 Fort Smith, AR | 2.0 | 2.0 | 1772 | $1,900 | $1.07 | 13d | 1 | 1.47mi |
| 5200 S U St Unit 141 Fort Smith, AR | 3.0 | 2.0 | 1190 | $850 | $0.71 | 21d | 1 | 1.48mi |
Listing history 17 events
-
2026-06-19days on market $1 Active 27 DOM
-
2026-06-18days on market $1 Active 26 DOM
-
2026-06-17days on market $1 Active 25 DOM
-
2026-06-16days on market $1 Active 24 DOM
-
2026-06-15days on market $1 Active 23 DOM
-
2026-06-14days on market $1 Active 21 DOM
-
2026-06-13days on market $1 Active 20 DOM
-
2026-06-10days on market $1 Active 18 DOM
-
2026-06-09days on market $1 Active 17 DOM
-
2026-06-08days on market $1 Active 16 DOM
-
2026-06-07days on market $1 Active 15 DOM
-
2026-06-03days on market $1 Active 11 DOM
-
2026-06-02days on market $1 Active 10 DOM
-
2026-06-01days on market $1 Active 9 DOM
-
2026-05-31days on market $1 Active 8 DOM
-
2026-05-30days on market $1 Active 7 DOM
-
2026-05-22$1 Active
ⓘ Source: listings_history table (triggers on properties + properties_extension) + one-shot
backfill from property_details.listing_events for pre-trigger history.
Climate risk First Street
- Flood 1/10 Low FEMA zone X (unshaded) · 0% chance over 30 yrs
- Wildfire 1/10 Low
- Heat 7/10 Severe 7 d/yr ≥112°F today · 20 d/yr by 30 yrs out
- Wind 2/10 Low 3% chance of damaging wind over 30 yrs
- Air quality 2/10 Low 0 unhealthy d/yr today · 1 by 30 yrs out
Nearby sold comps map
Loading sold comps map…
Walkable amenities ~0.75 mi
Loading nearby amenities…
Taxation est. · year 1
- Rental income
- $13,873
- − Mortgage interest
- −$9,825
- − Property taxes
- −$2,631
- − Insurance
- −$877
- − Repairs & maintenance
- −$1,110
- − Management
- −$1,110
- − Depreciation
- −$5,103
- Taxable loss
- −$6,783
- Est. tax savings @ 24.0%
- +$1,628
- After-tax cash flow
- $-1,959/yr
For passive investors: Depreciation is non-cash, so a rental often shows a tax loss while cash-flowing — sheltering income. Rental losses are passive: they offset passive income freely, and up to $25,000/yr can offset ordinary (W-2) income if you actively participate and your MAGI is under $100k (phasing out to $0 by $150k); unused losses carry forward. On sale, claimed depreciation is recaptured at up to 25%, and gains may owe capital-gains tax (a 1031 exchange can defer both). Figures are a year-1 estimate at your 24.0% rate — not tax advice; consult a CPA.
Condition & rehab AI · 20 photos
This home requires moderate renovations to update the kitchen and bathroom, paint the interior walls, and replace the carpet. It has a good roof and HVAC system, making it a good investment property.
Repairs flagged
- Minor kitchen countertops — dated and worn
- Minor bathroom countertops — dated and worn
- Minor exterior siding — some discoloration
Value-add opportunities
- Resale update kitchen countertops — modernizes the space and adds value
- Resale update bathroom countertops — modernizes the space and adds value
- Both paint interior walls — updates the look and adds value
- Both replace carpeting — updates the look and adds value
Renovation cost estimate screening
| Repair item | Severity | Est. cost |
|---|---|---|
| kitchen countertops · dated and worn | Minor | $500–3,000 |
| bathroom countertops · dated and worn | Minor | $500–3,000 |
| exterior siding · some discoloration | Minor | $500–3,000 |
| Total estimated repair cost · 3 items | $1,500–9,000 |
Value-add ROI direction
- Resale update kitchen countertops — modernizes the space and adds value ↑
- Resale update bathroom countertops — modernizes the space and adds value ↑
- Both paint interior walls — updates the look and adds value ↑
- Both replace carpeting — updates the look and adds value ↑
ⓘ Cost ranges are severity-bucket heuristics (US national rule-of-thumb). Get contractor quotes + a written scope before underwriting a rehab budget.
Schools (NCES district)
- District
- Fort Smith School District
- NCES district ID
- 0506330
- Math proficiency
- 35% ▼ -11.00%
- Reading proficiency
- 39% ▼ -7.00%
- Median HH income
- $36,066
- Composite
- 30.66/100
- National rank
- #6183
- State rank
- #106 of 238 in AR
Livability — Fort Smith
- Score
- 65/100
- State rank
- #151
- US rank
- #13185
Category grades
Schools grade is shown separately in the Schools card above.
Census & demographics
- Census place
- Fort Smith, AR
- County
- Sebastian County · 99,312 people
- City population
- 94,356
- Metro
- Fort Smith, AR-OK
- Population (ZIP)
- 27,242
- Household income
- $61,434
- Rent vs Own
- Severe rent burden
- 1009.0
Population outlook (Sebastian County) Hauer SSP2
- Today (2025)
- 133,992 people
- By 2030
- 136,620 · +2.0%
- By 2040
- 140,832 · +5.1%
- By 2050
- 143,301 · +6.9%
- By 2075
- 147,964 · +10.4%
- By 2100
- 145,848 · +8.8%
Race, ethnicity, and origin ACS 2023
- Neighborhood character
- Predominantly White (71%)
- Race & ethnicity
- White 71% Hispanic / Latino 10% Two or more races 10% Black 8% Asian 3%
- Hispanic origin (detail)
- Mexican 7%
- Common ancestry
- Slovak 2% Serbian 2% Iranian 2%
- Foreign-born
- 5% · Canada, Vietnam
- Languages at home
- 90% English-only · Spanish 7% Vietnamese 2% Other Asian/Pacific 1%
Political lean MEDSL · Sebastian
- 2024 margin
- Solid R (+37.5) · D 30.0% · R 67.6% · Other 2.4%
- 2008→2024 swing
- -2.9pp toward R · 2008: -34.6pp · 2024: -37.5pp
- All cycles
- 2024: R+37.5 2020: R+35.5 2016: R+38.1 2012: R+37.1 2008: R+34.6
Not yet ingested
- Civics
- —
Market trends
- HPI YoY
- ▼ -183.19%
- Current HPI
- 201.125
- Rent YoY
- ▲ 4.90%
- Metro
- Fort Smith, AR-OK
- State GDP YoY
- ▲ 3.80%
- F500 in state
- 10
Industry mix (Fortune 500 HQ in AR)
| Industry | F500 HQs | Revenue |
|---|---|---|
| Retail | 1 | $681B |
|
||
| Food / Agriculture | 1 | $53B |
|
||
| Retail / Energy | 1 | $22B |
|
||
| Transportation / Logistics | 1 | $12B |
|
||
| Energy | 1 | $4B |
|
||
Property tax history
-44.1%/yrLatest (2022): $2 · +0.0% YoY. Source: county tax records.
Cash-flow waterfall
monthlySold comps — $/sqft
last 12 mo · ≤1 miLoading sold comps…