 Triplex
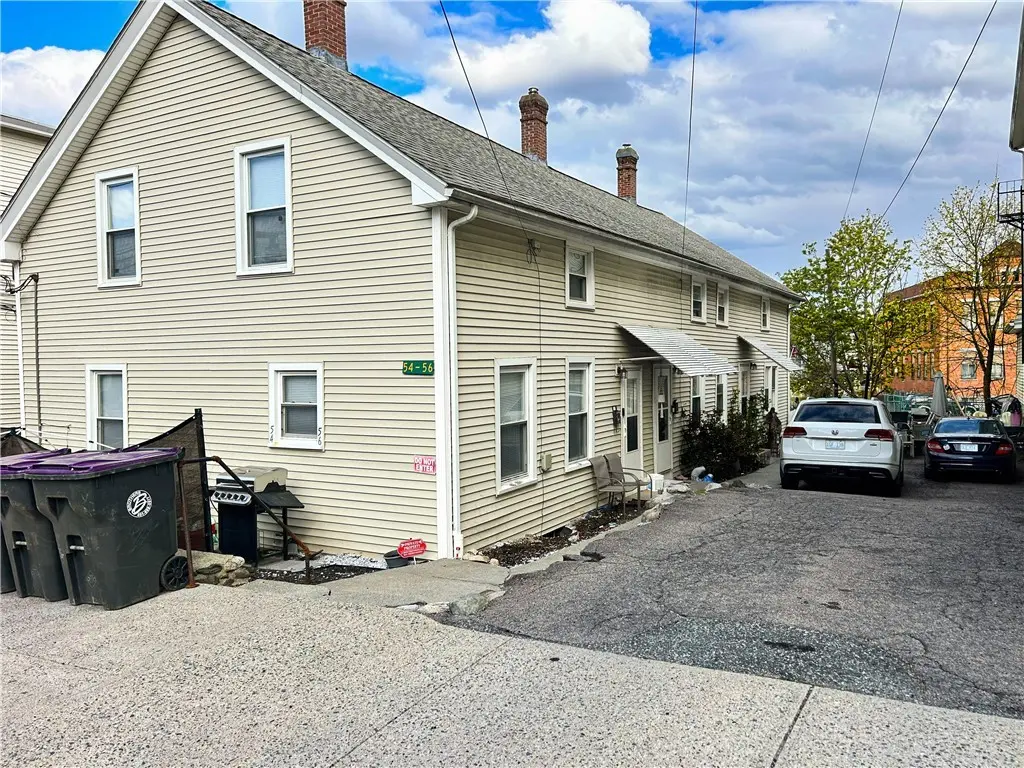
54 Spring St · Cumberland Hill, RI
Flood risk 1/10 · Minimal
- FEMA flood zone
- X (unshaded)
- Chance of flooding over 30 yrs
- 0.0%
- Est. flood insurance / yr
- $473 – $860
Fire risk 3/10 · Minor
- Est. fire insurance / yr
- $835 – $1,551
Heat risk 5/10 · Moderate
- Hot days now (above 96°F)
- 7 days/yr
- Hot days in 30 yrs
- 17 days/yr
Wind risk 6/10 · Moderate
- Chance of severe wind over 30 yrs
- 66.0%
Air-quality risk 2/10 · Minimal
- Unhealthy air days now
- 1 days/yr
- Unhealthy air days in 30 yrs
- 2 days/yr
Risk factors via First Street. Map © Google.
Why this score? — see what drove the B- grade
The composite is a weighted blend of 9 inputs, each scored 0–100. Each bar is that input's sub-score; the figure is the points it added to the 100-point composite (weight × sub-score).
- Cash flow +22.1/30.0
- ARV discount +10.0/15.0
- Appreciation +8.4/10.0
- DSCR +7.1/10.0
- 1% rule +5.3/10.0
- Schools +3.9/10.0
- Livability +3.7/5.0
- Rent growth +2.5/5.0
- Condition / age +2.5/5.0
$549,000
🖨 Deal sheet 📄 Offer letter ✓ Due diligence
Multi-family units
County records classify this as Multi-Family (2-4 Unit). Listing-text estimate: 3 units. confirmed
Listing remarks MLS
Three-unit property in the Manville section of Lincoln. The unit mix includes one 3-bedroom apartment and two 4-bedroom apartments. Units are large and feature many updates and upgrades throughout. All three units are currently occupied on month-to-month tenancies. The exterior is vinyl sided & building has a full basement plus two living levels townhouse style. The lot is 0.12 acres. Parking includes three off-street spaces. The property is well maintained and professionally managed. P and L and rent roll are available upon request.
Key facts
- Vinyl sided
- Three unit property
- Off street parking
Tags
Neighborhood map
What this means for you Summary
Snapshot
- This is a 1×3bd/1ba + 2×4bd/1ba units multifamily listed at $549k.
Deal economics
- At list price, monthly cash flow is $880 ($11k/yr) — positive. Per door: $293/mo.
- The deal already cash-flows at list — no discount required.
- Meets the 1% rule at list price ($6k rent vs $549k).
- Cap rate 8.2% vs local median 3.3% in Cumberland Hill — top-decile yield for the area; either an underpriced asset or a hidden risk that comps aren't pricing in. Stress-test before assuming the spread holds.
Location & tenants
- Location reads 74/100 on livability (#11 in RI, #4,666 nationally) — a middle-class / working-renter tenant base. Strengths: crime A+, employment A+, housing A+; Watch: amenities F, commute F.
- Lincoln (suburban): math 38% / reading 48% proficiency, ranked #13 of 39 in RI (top 33%) — families likely to look elsewhere, expect single-tenant / working-renter base with shorter leases.
- Market conditions: 21 active listings in the ZIP; 776 units permitted in Providence County in 2024 (229 in 5+ unit buildings).
Forward outlook
- In year one you build about $41k of equity ($4k loan paydown + $37k appreciation (6.8% local appreciation)).
- Providence County population projected at +5% by 2050 — modest demand growth; plan on rents tracking national, not racing it.
- At projected returns (6.8% appreciation + 3.0% rent growth), your $154k cash investment doubles in ~3 years — after that, you're playing with house money.
- By year 2, paydown + projected appreciation supports a ~$66k cash-out refi (75% LTV) — recoverable capital for the next deal without selling this one.
Negotiation context
- Only 11 days on market — expect competitive offers; lowballing is unlikely to land.
- Current owner paid $115k; list at $549k implies a 377% gain — meaningful room to come down on a strong offer.
Risks & watch-outs
- Watch-outs: built in 1890 — expect roof / HVAC / electrical / plumbing capex.
- Climate carrying-cost: major wind risk, 66% chance of damaging wind over 30y; extreme-heat days projected 7→17/yr by 2055 (HVAC capex compounding) — expect insurance premiums to compound above CPI over the hold.
Questions for the listing agent
- Can we see the unit-by-unit rent roll, current vacancy, and any below-market leases? What's the average tenancy length?
- What capital expenditures (roof, boiler, parking lot, exteriors) have been made in the last 5 years, and what's planned in the next 2?
- Built in 1890 — when were the roof, HVAC, electrical panel, plumbing, and water heater last replaced?
- Is there a deadline driving the sale (1031 exchange, divorce, estate, relocation)? That informs how much negotiation room exists.
- What's the average days-on-market for RENTAL listings here right now (not sales)? A rising rental-DOM trend means longer vacancies and softer asking-rent achievability than the comps imply.
- What's the recent tenant-quality profile in this submarket — average credit score on applications, eviction rate, late-payment / NSF rate, and stable-employment percentage? A property-management company in the area should have these aggregated.
- How much new apartment / multifamily construction is in the pipeline within 1–3 miles? Heavy new supply (>2% of stock underway) typically softens rents 12–24 months out; light construction supports rent growth.
Investment metrics
- 1% rule
- 1.03% ✓
- Cap rate
- 8.22%
- Cash-on-cash
- 6.87%
- DSCR
- 1.31
- GRM
- 8.1
CMA / ARV
- ARV (median comp)
- $581,477
- List price
- $549,000
- Delta
- -5.59%
- Verdict
- FAIR
- Comps
- 20 within 1.0 mi
Show comp detail 1 sale within ~0.75 mi
| Address | Dist | Beds/Ba | Sqft | Sold | Price | $/sf | Match |
|---|---|---|---|---|---|---|---|
| 54 Spring St | 0.00mi | 11/3.0 | 2,604 (0%) | 0mo | $562,725 | $216 | 100 |
Match score weights: distance 35% · size 25% · config 20% · recency 20%. Top-matched comps best support the ARV.
Projected returns pro-forma
6.82% appreciation · 3.0% rent growth · sell at horizon
- IRR
- 22.8%
- Equity multiple
- 2.57×
- Total profit
- $241,562
- Equity at exit
- $373,923
- IRR
- 21.3%
- Equity multiple
- 5.30×
- Total profit
- $660,840
- Equity at exit
- $704,458
Cash invested: $153,720 (down + closing). Projections, not guarantees.
Landlord ↔ Tenant lean methodology
- Overall (STATE)
- 31 Tenant-Leaning
- State Rhode Island
- 31 Tenant-Leaning · D+8
- County
- — inherits STATE
- City
- — inherits STATE
ZIP-level market 02838
- Home prices YoY
- 1.7%
- Active inventory
- 21
- Price-to-rent
- 24.5×
Monthly cashflow live
- Estimated rent
- $5,666 high interval (Pro) →
- Mortgage (P&I)
- −$2,879
- Tax from tax record
- −$489 /mo · $5,866/yr
- Insurance
- −$229
- HOA
- −$0
- Vacancy / Maint / Mgmt
- −$1,190
- Net cashflow
- $880
Break-even live
3-unit breakdown (identical units grouped — click to expand)
| Units | Beds | Baths | Est. rent |
|---|---|---|---|
| 1× unit | 3 | 1 | $1,866 |
| 2× units | 4 | 1 | $3,800 |
| #2 | 4 | 1 | $1,900 |
| #3 | 4 | 1 | $1,900 |
| Total (3 units) | $5,666 | ||
UW: 25.0% down · 7.5% · 30yr · 1.5% tax · 5.0% vac · 8.0% maint · 8.0% mgmt
Financing live
Cash to close
- Down payment
- $137,250
- Closing costs
- $16,470
- Reserves months
- —
- Total cash needed
- —
Loan-product check · same deal, 3 products live
Conventional
25% down · 7.5% · 30yr
- Down + closing
- —
- Monthly P&I
- —
- Monthly cashflow
- —
- DSCR
- —
- Eligible?
- —
Personal DTI + credit; lowest rate.
DSCR
20% down · 8.5% · 30yr
- Down + closing
- —
- Monthly P&I
- —
- Monthly cashflow
- —
- DSCR
- —
- Eligible?
- —
No personal income docs; deal must DSCR.
Hard money
10% down · 12.0% · 12mo
- Down + closing
- —
- Monthly P&I
- —
- Monthly cashflow
- —
- DSCR
- —
- Eligible?
- —
Short-term bridge; refi at stabilization.
Listing history 3 events
-
2026-05-02status Pending 545-char remark
Show marketing remark (545 chars)
Three-unit property in the Manville section of Lincoln. The unit mix includes one 3-bedroom apartment and two 4-bedroom apartments. Units are large and feature many updates and upgrades throughout. All three units are currently occupied on month-to-month tenancies. The exterior is vinyl sided & building has a full basement plus two living levels townhouse style. The lot is 0.12 acres. Parking includes three off-street spaces. The property is well maintained and professionally managed. P and L and rent roll are available upon request.
-
2026-04-21$549,000 Active 545-char remark
Show marketing remark (545 chars)
Three-unit property in the Manville section of Lincoln. The unit mix includes one 3-bedroom apartment and two 4-bedroom apartments. Units are large and feature many updates and upgrades throughout. All three units are currently occupied on month-to-month tenancies. The exterior is vinyl sided & building has a full basement plus two living levels townhouse style. The lot is 0.12 acres. Parking includes three off-street spaces. The property is well maintained and professionally managed. P and L and rent roll are available upon request.
-
2016-07-29soldstatus $115,000
ⓘ Source: listings_history table (triggers on properties + properties_extension) + one-shot
backfill from property_details.listing_events for pre-trigger history.
Tax reassessment forecast RI · Partial reset (capped growth)
- Current annual tax
- $5,866 · $489/mo
- Projected year-2 tax
- $7,407 · $617/mo
- Expected delta
- +$1,541/yr (+$128/mo · 26.3%)
ⓘ Screening estimate from a state-policy table — verify with the county assessor before closing.
Climate risk First Street
- Flood 1/10 Low FEMA zone X (unshaded) · 0% chance over 30 yrs
- Wildfire 3/10 Moderate
- Heat 5/10 Major 7 d/yr ≥96°F today · 17 d/yr by 30 yrs out
- Wind 6/10 Major 66% chance of damaging wind over 30 yrs
- Air quality 2/10 Low 1 unhealthy d/yr today · 2 by 30 yrs out
Nearby sold comps map
Loading sold comps map…
Walkable amenities ~0.75 mi
Loading nearby amenities…
Taxation est. · year 1
- Rental income
- $67,992
- − Mortgage interest
- −$30,753
- − Property taxes
- −$5,866
- − Insurance
- −$2,745
- − Repairs & maintenance
- −$5,439
- − Management
- −$5,439
- − Depreciation
- −$15,971
- Taxable income
- $1,779
- Est. tax owed @ 24.0%
- −$427
- After-tax cash flow
- $10,128/yr
For passive investors: Depreciation is non-cash, so a rental often shows a tax loss while cash-flowing — sheltering income. Rental losses are passive: they offset passive income freely, and up to $25,000/yr can offset ordinary (W-2) income if you actively participate and your MAGI is under $100k (phasing out to $0 by $150k); unused losses carry forward. On sale, claimed depreciation is recaptured at up to 25%, and gains may owe capital-gains tax (a 1031 exchange can defer both). Figures are a year-1 estimate at your 24.0% rate — not tax advice; consult a CPA.
Schools (NCES district)
- District
- Lincoln
- NCES district ID
- 4400570
- Math proficiency
- 38% ▼ -8.00%
- Reading proficiency
- 48% ▼ -2.00%
- Median HH income
- $69,500
- Composite
- 38.81/100
- National rank
- #4115
- State rank
- #13 of 39 in RI
Livability — Cumberland Hill
- Score
- 74/100
- State rank
- #11
- US rank
- #4666
Category grades
Schools grade is shown separately in the Schools card above.
Census & demographics
- Population (ZIP)
- 4,007
Population outlook (Providence County) Hauer SSP2
- Today (2025)
- 653,469 people
- By 2030
- 660,819 · +1.1%
- By 2040
- 672,747 · +3.0%
- By 2050
- 683,741 · +4.6%
- By 2075
- 720,435 · +10.2%
- By 2100
- 741,582 · +13.5%
Race, ethnicity, and origin ACS 2023
- Neighborhood character
- Predominantly White (83%)
- Race & ethnicity
- White 83% Two or more races 8% Asian 2%
- Common ancestry
- Lithuanian 22% Russian 17% Scotch-Irish 4%
- Foreign-born
- 5% · South Korea, Canada, Jamaica
- Languages at home
- 82% English-only · French/Haitian/Cajun 12% Russian/Polish/Slavic 3% Spanish 2%
Political lean MEDSL · Providence
- 2024 margin
- D (+14.4) · D 56.1% · R 41.7% · Other 2.2%
- 2008→2024 swing
- -20.0pp toward R · 2008: 34.4pp · 2024: 14.4pp
- All cycles
- 2024: D+14.4 2020: D+22.9 2016: D+21.2 2012: D+34.9 2008: D+34.4
Not yet ingested
- Civics
- —
Market trends
- HPI YoY
- ▲ 6.82%
- Current HPI
- 411.3952
- Rent YoY
- —
- Metro
- —
- State GDP YoY
- ▲ 2.25%
- F500 in state
- 10
Industry mix (Fortune 500 HQ in RI)
| Industry | F500 HQs | Revenue |
|---|---|---|
| Healthcare | 1 | $373B |
|
||
| Food Distribution | 1 | $31B |
|
||
| Aerospace / Defense | 1 | $14B |
|
||
| Financial Services | 1 | $8B |
|
||
| Consumer Goods | 1 | $4B |
|
||
Price history
+377.4% since first listed3 events — show timeline
- 2026-05-02 Pending — RIS
- 2026-04-21 Listed $549,000 RIS
- 2016-07-29 Sold (Public Records) $115,000 Public Records
Property tax history
+2.3%/yrLatest (2025): $5,866 · +8.9% YoY. Source: county tax records.
Cash-flow waterfall
monthlySold comps — $/sqft
last 12 mo · ≤1 miLoading sold comps…