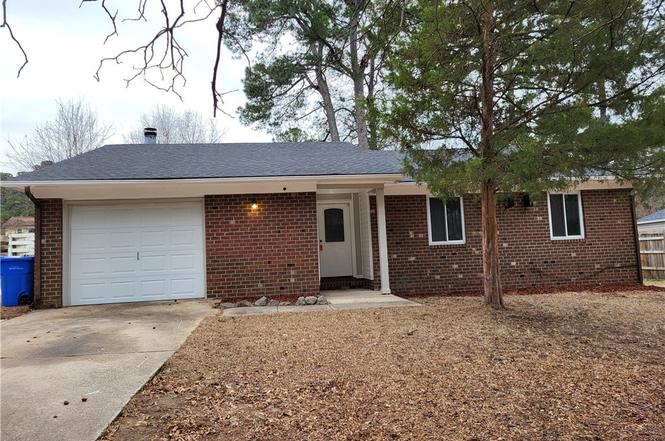
2520 Graham Rd · Fayetteville, NC
Flood risk 1/10 · Minimal
- FEMA flood zone
- X (unshaded)
- Chance of flooding over 30 yrs
- 0.0%
- Est. flood insurance / yr
- $507 – $1,088
Fire risk 4/10 · Minor
- Est. fire insurance / yr
- $906 – $1,684
Heat risk 7/10 · Major
- Hot days now (above 107°F)
- 7 days/yr
- Hot days in 30 yrs
- 16 days/yr
Wind risk 8/10 · Major
- Chance of severe wind over 30 yrs
- 80.0%
Air-quality risk 1/10 · Minimal
- Unhealthy air days now
- 0 days/yr
- Unhealthy air days in 30 yrs
- 0 days/yr
Risk factors via First Street. Map © Google.
Why this score? — see what drove the D+ grade
The composite is a weighted blend of 9 inputs, each scored 0–100. Each bar is that input's sub-score; the figure is the points it added to the 100-point composite (weight × sub-score).
- ARV discount +15.0/15.0
- Cash flow +12.6/30.0
- DSCR +3.8/10.0
- Livability +3.8/5.0
- 1% rule +3.4/10.0
- Rent growth +3.3/5.0
- Schools +3.1/10.0
- Condition / age +2.5/5.0
- Appreciation +0.0/10.0
$194,250
🖨 Deal sheet (PDF) 📄 Offer letter ✓ Due diligence
Listing remarks
Nice brick home, close to shopping, base and highways. Large open floor plan, new flooring, new painting, new countertops. Large garage, man cave. Large great back yard, great for family activities.
Key facts
- Open floor plan
- New flooring
- Brick home
Tags
Property features AI
Exterior
- Parking: Attached garage (1 covered space)
- Security: Smoke detectors
- Utilities: Public water; Public sewer
- Home design: Single-family residence; One-story
- Construction: Brick veneer construction
- Exterior features: Private yard; Porch; Patio; Cleared lot
Interior
- Kitchen: Dishwasher; Electric range; Refrigerator; Range hood; Exhaust fan
- Bedrooms: Total rooms: 5
- Flooring: Vinyl
- Bathrooms: 2 full bathrooms
- Heating & cooling: Central electric air conditioning; Electric forced-air heating
- Interior features: Breakfast bar; Entrance foyer; Eat-in kitchen; Open floor plan; Masonry fireplace (1)
- Laundry & utility: Washer hookup in unit
Neighborhood map
What this means for you Summary
Snapshot
- This is a 3-bed/2.0-bath single-family listed at $194k.
Deal economics
- At list price, monthly cash flow is $-24 ($-289/yr) — negative.
- To cash-flow at today's rent, offer at most $190k (2.2% below list).
- To meet the 1% rule (rent ≥ 1% of price), the offer needs to be $163k (15.9% below list).
- Recommended offer: $163k (15.9% below list) — sets the bar for 1% rule.
- Cap rate 6.1% vs local median 4.9% in Fayetteville — meaningfully above typical; check what's discounted (condition, days-on-market, listing class) to confirm the premium yield is real.
Location & tenants
- Location reads 75/100 on livability (#45 in NC, #4,031 nationally) — a middle-class / working-renter tenant base. Strengths: commute A+, cost of living A+, housing A+; Watch: crime F, employment D-.
- Cumberland County Schools (urban): math 32% / reading 41% proficiency, ranked #126 of 178 in NC (top 71%) — families likely to look elsewhere, expect single-tenant / working-renter base with shorter leases.
- Zoned schools: New Century International Middle (math 41% / reading 58%, grade C, #120 of 475 statewide, top 25%, 391 students, 55% FRL); Jack Britt High (math 58% / reading 72%, grade B, #161 of 535 statewide, top 30%, 1,890 students, 38% FRL).
- Zoned-school proficiency averages 57% at this address vs 36% district-wide (+21 pts) — the actual schools serving this property are materially stronger than the Cumberland County Schools average implies; a family-tenant draw the district grade alone would hide.
- Market conditions: Rents rising (+3.2%/yr); 302 active listings in the ZIP; 33 comparable units currently listed for rent nearby; rentals at typical pace (median 25d on market — plan ~3-4 weeks tenant-placement turnaround); 1,125 units permitted in Cumberland County in 2024 (104 in 5+ unit buildings).
- This rent runs 33% of the median local income ($59k/yr) — at the standard rent-burdened threshold; future hikes will face affordability resistance.
Forward outlook
- Local home prices are declining (-3.0%/yr); year-one equity from $1k of loan paydown is wiped out by about $6k of value loss. Plan a longer hold.
Negotiation context
- It's been on market 146 days — a 12% lower offer ($171k) is reasonable based on typical stale-listing flexibility.
Risks & watch-outs
- Climate carrying-cost: severe wind risk, 80% chance of damaging wind over 30y; extreme-heat days projected 7→16/yr by 2055 (HVAC capex compounding) — expect insurance premiums to compound above CPI over the hold.
Questions for the listing agent
- What do current leases actually rent for vs. the listed asking? Can we see a recent rent roll and the last 12 months of T-12 income?
- It's been on market 146 days. Have you received any prior offers? Is the seller open to a 16% concession, seller financing, or rate buy-down credit?
- Built in 1978 — when were the roof, HVAC, electrical panel, plumbing, and water heater last replaced?
- Why hasn't it sold? Are there any deal-killer items the seller is aware of (foundation, flood, title, zoning, code violations)?
- Is there a deadline driving the sale (1031 exchange, divorce, estate, relocation)? That informs how much negotiation room exists.
- Crime grade is F in this area — have there been break-ins, vandalism, or insurance claims at this property in the last 3 years? What carrier currently insures it and at what premium?
- The area grade is low — what's the realistic commute time and amenity access for the typical tenant pool here? Any planned neighborhood developments (good or bad) we should know about?
- What's the average days-on-market for RENTAL listings here right now (not sales)? A rising rental-DOM trend means longer vacancies and softer asking-rent achievability than the comps imply.
- What's the recent tenant-quality profile in this submarket — average credit score on applications, eviction rate, late-payment / NSF rate, and stable-employment percentage? A property-management company in the area should have these aggregated.
- How much new for-sale + rental construction is in the pipeline within 1–3 miles? Heavy new supply typically softens prices + rents 12–24 months out; constrained supply supports both.
Investment metrics
- 1% rule
- 0.84% ✗
- Cap rate
- 6.14%
- Cash-on-cash
- -0.53%
- DSCR
- 0.98
- GRM
- 9.9
CMA / ARV
- ARV (on-the-fly)
- $237,797
- Comps found
- 12
Show comp detail 12 sales within ~0.75 mi
| Address | Dist | Beds/Ba | Sqft | Sold | Price | $/sf | Match |
|---|---|---|---|---|---|---|---|
| 1607 Hickory Ridge Ct | 0.15mi | 3/2.0 | 1,502 (+2%) | 4mo | $229,000 | $152 | 87 |
| 1605 Hickoryridge Ct | 0.17mi | 3/2.0 | 1,347 (-9%) | 5mo | $194,000 | $144 | 73 |
| 2202 Foster Gwin Ln | 0.39mi | 3/2.0 | 1,605 (+9%) | 2mo | $277,000 | $173 | 66 |
| 5909 Waterdale Ct | 0.70mi | 3/2.0 | 1,499 (+2%) | 1mo | $250,000 | $167 | 64 |
| 2122 Coinjock Cir | 0.47mi | 4/2.5 (+1) | 1,449 (-2%) | 5mo | $242,500 | $167 | 63 |
| 5904 Lake Terrace Ct | 0.69mi | 3/2.0 | 1,510 (+2%) | 2mo | $214,000 | $142 | 63 |
| 2321 Foster Gwin Ln | 0.44mi | 3/2.0 | 1,670 (+13%) | 2mo | $262,000 | $157 | 56 |
| 1931 Pumpkin Rd | 0.54mi | 4/2.0 (+1) | 1,363 (-8%) | 2mo | $195,000 | $143 | 55 |
| 6377 Lake Traill Dr | 0.71mi | 3/2.0 | 1,604 (+9%) | 1mo | $258,000 | $161 | 52 |
| 6533 Applewhite Rd | 0.55mi | 3/2.0 | 1,264 (-14%) | 4mo | $220,000 | $174 | 47 |
| 6654 Vaughn Rd | 0.62mi | 3/2.0 | 1,272 (-14%) | 1mo | $209,800 | $165 | 47 |
| 6300 Lake Trail Dr | 0.68mi | 3/2.0 | 1,678 (+14%) | 0mo | $220,000 | $131 | 45 |
Match score weights: distance 35% · size 25% · config 20% · recency 20%. Top-matched comps best support the ARV.
Projected returns pro-forma
-3.0% appreciation · 3.17% rent growth · sell at horizon
- IRR
- -17.0%
- Equity multiple
- 0.40×
- Total profit
- $-32,721
- Equity at exit
- $28,963
- IRR
- -8.6%
- Equity multiple
- 0.46×
- Total profit
- $-29,283
- Equity at exit
- $16,795
Cash invested: $54,390 (down + closing). Projections, not guarantees.
Landlord ↔ Tenant lean methodology
- Overall (STATE)
- 85 Strongly Landlord-Friendly
- State North Carolina
- 85 Strongly Landlord-Friendly · R+3
- County
- — inherits STATE
- City
- — inherits STATE
ZIP-level market 28304
- Home prices YoY
- -21.7%
- Rents YoY
- 3.2%
- Active inventory
- 302
- Price-to-rent
- 9.9×
Monthly cashflow live
- Estimated rent
- $1,633 high interval (Pro) →
- Mortgage (P&I)
- −$1,019
- Tax from tax record
- −$214 /mo · $2,574/yr
- Insurance
- −$81
- HOA
- −$0
- Vacancy / Maint / Mgmt
- −$343
- Net cashflow
- $-24
Break-even live
Sensitivity live
| Price | -10% $86 | -5% $31 | +0% $-24 | +5% $-79 | +10% $-134 |
|---|---|---|---|---|---|
| Rent | -10% $-153 | -5% $-89 | +0% $-24 | +5% $40 | +10% $105 |
| Rate | -1.0pp $74 | -0.5pp $25 | base $-24 | +0.5pp $-74 | +1.0pp $-126 |
UW: 25.0% down · 7.5% · 30yr · 1.5% tax · 5.0% vac · 8.0% maint · 8.0% mgmt
Financing live
Cash to close
- Down payment
- $48,562
- Closing costs
- $5,828
- Reserves months
- —
- Total cash needed
- —
Loan-product check · same deal, 3 products live
Conventional
25% down · 7.5% · 30yr
- Down + closing
- —
- Monthly P&I
- —
- Monthly cashflow
- —
- DSCR
- —
- Eligible?
- —
Personal DTI + credit; lowest rate.
DSCR
20% down · 8.5% · 30yr
- Down + closing
- —
- Monthly P&I
- —
- Monthly cashflow
- —
- DSCR
- —
- Eligible?
- —
No personal income docs; deal must DSCR.
Hard money
10% down · 12.0% · 12mo
- Down + closing
- —
- Monthly P&I
- —
- Monthly cashflow
- —
- DSCR
- —
- Eligible?
- —
Short-term bridge; refi at stabilization.
Rent comps 33 comps
| Address | Beds | Baths | Sqft | Rent | $/sqft | DOM | Units | Dist |
|---|---|---|---|---|---|---|---|---|
| 1644 Sweetgum Cir Fayetteville, NC | 3.0 | 2.0 | 1446 | $1,750 | $1.21 | 24d | 1 | 0.18mi |
| 1948 Nordic Dr Fayetteville, NC | 3.0 | 2.0 | 1131 | $1,400 | $1.24 | 24d | 1 | 0.54mi |
| 6716 Sandfield Ct Fayetteville, NC | 3.0 | 2.0 | 1296 | $1,575 | $1.22 | 24d | 1 | 0.58mi |
| 6301 Lakehaven Dr Fayetteville, NC | 3.0 | 2.0 | 1514 | $1,700 | $1.12 | 24d | 1 | 0.59mi |
| 6658 Vaughn Rd Fayetteville, NC | 3.0 | 2.0 | 1280 | $1,575 | $1.23 | 24d | 1 | 0.65mi |
| 6701 Vaughn Rd Fayetteville, NC | 3.0 | 2.0 | 1236 | $1,700 | $1.38 | 14d | 1 | 0.66mi |
| 2514 Gardner Park Dr Fayetteville, NC | 3.0 | 2.5 | 1480 | $1,595 | $1.08 | 24d | 1 | 0.76mi |
| 1411 Furnish Dr Fayetteville, NC | 3.0 | 2.0 | 1100 | $1,350 | $1.23 | 24d | 1 | 0.82mi |
| 6338 Rhemish Dr Fayetteville, NC | 3.0 | 2.0 | 1201 | $1,500 | $1.25 | 24d | 1 | 0.92mi |
| 1916 Rayconda Rd Fayetteville, NC | 1.0–3.0 | 1.0–2.0 | 989 | $1,450 | $1.47 | 24d | 3 | 0.92mi |
| 4010 Bardstown Ct Unit 202 Fayetteville, NC | 3.0 | 2.0 | 1450 | $1,495 | $1.03 | 24d | 1 | 0.97mi |
| 6408 Dunham Dr Fayetteville, NC | 3.0 | 2.0 | 1400 | $1,500 | $1.07 | 14d | 1 | 0.98mi |
| 4050 Bardstown Ct Fayetteville, NC | 3.0 | 2.0 | 1450 | $1,495 | $1.03 | 14d | 1 | 1.04mi |
| 1443 Larkhall Dr Fayetteville, NC | 4.0 | 2.0 | 1382 | $1,600 | $1.16 | 24d | 1 | 1.08mi |
| 1066 Strickland Bridge Rd Fayetteville, NC | 3.0 | 2.0 | 1427 | $2,050 | $1.44 | 14d | 1 | 1.11mi |
| 2220 Baywater Dr Fayetteville, NC | 3.0 | 2.5 | 1859 | $2,000 | $1.08 | 24d | 1 | 1.15mi |
| 1508 Darvel Ave Fayetteville, NC | 3.0 | 2.0 | 1269 | $1,700 | $1.34 | 24d | 1 | 1.18mi |
| 6017 Lakeway Dr Fayetteville, NC | 3.0 | 2.0 | 1709 | $1,750 | $1.02 | 24d | 1 | 1.20mi |
| 1879 Frankie Ave Fayetteville, NC | 3.0 | 2.0 | 1100 | $1,375 | $1.25 | 24d | 1 | 1.24mi |
| 6333 Marykirk Dr Unit A Fayetteville, NC | 2.0 | 1.5 | 1080 | $1,075 | $1.00 | 24d | 1 | 1.29mi |
| 3001 Stone Carriage Cir Fayetteville, NC | 1.0–3.0 | 1.0–2.0 | 1098 | $1,700 | $1.55 | 14d | 12 | 1.30mi |
| 2012 Lakemeadow Dr Fayetteville, NC | 3.0 | 2.0 | 1332 | $1,800 | $1.35 | 14d | 1 | 1.32mi |
| 1366 Worstead Dr Fayetteville, NC | 3.0 | 2.0 | 1079 | $1,650 | $1.53 | 14d | 1 | 1.33mi |
| 6332 Marykirk Dr Unit A Fayetteville, NC | 2.0 | 1.5 | 925 | $1,150 | $1.24 | 24d | 1 | 1.34mi |
| 1701 Carter Baron Pl Unit 211 Fayetteville, NC | 3.0 | 2.0 | 1295 | $1,700 | $1.31 | 24d | 1 | 1.39mi |
| 1338 Kienast Dr Fayetteville, NC | 3.0 | 2.0 | 1086 | $1,350 | $1.24 | 24d | 1 | 1.39mi |
| 1715 Arrow Ridge Way Fayetteville, NC | 3.0 | 2.0 | 1220 | $1,550 | $1.27 | 14d | 1 | 1.44mi |
| 5812 Shenandoah Dr Fayetteville, NC | 4.0 | 2.0 | 1800 | $1,599 | $0.89 | 24d | 1 | 1.45mi |
| 1811 Balmoral Dr #202 Fayetteville, NC | 2.0 | 2.0 | 1250 | $1,275 | $1.02 | 14d | 1 | 1.47mi |
| 1800 Balmoral Dr Fayetteville, NC | 2.0 | 2.0 | 1328 | $1,250 | $0.94 | 24d | 1 | 1.48mi |
| 3325 Oak Forest Dr Fayetteville, NC | 1.0–3.0 | 1.0–2.0 | 1112 | $1,745 | $1.57 | 14d | 66 | 1.49mi |
| 1761 Renwick Dr #204 Fayetteville, NC | 2.0 | 2.0 | 1331 | $1,300 | $0.98 | 14d | 1 | 1.49mi |
| 1927 Shiloh Dr Fayetteville, NC | 3.0 | 1.5 | 1606 | $1,600 | $1.00 | 14d | 1 | 1.49mi |
Listing history 19 events
-
2026-06-18days on market $194,250 Active 146 DOM
-
2026-06-17days on market $194,250 Active 145 DOM
-
2026-06-16days on market $194,250 Active 144 DOM
-
2026-06-15days on market $194,250 Active 143 DOM
-
2026-06-14days on market $194,250 Active 141 DOM
-
2026-06-13days on market $194,250 Active 140 DOM
-
2026-06-10days on market $194,250 Active 138 DOM
-
2026-06-09days on market $194,250 Active 137 DOM
-
2026-06-08days on market $194,250 Active 136 DOM
-
2026-06-07days on market $194,250 Active 135 DOM
-
2026-06-03days on market $194,250 Active 131 DOM
-
2026-06-02days on market $194,250 Active 130 DOM
-
2026-06-01days on market $194,250 Active 129 DOM
-
2026-05-31days on market $194,250 Active 128 DOM
-
2026-05-30days on market $194,250 Active 127 DOM
-
2026-05-19price $194,250
-
2026-04-01price $199,750
-
2026-01-23$204,900 Active
-
2019-07-02soldstatus $185,000
ⓘ Source: listings_history table (triggers on properties + properties_extension) + one-shot
backfill from property_details.listing_events for pre-trigger history.
Tax reassessment forecast NC · Resets to sale price
- Current annual tax
- $2,574 · $214/mo
- Projected year-2 tax
- $2,574 · $214/mo
- Expected delta
- $0/yr ($0/mo · 0.0%)
ⓘ Screening estimate from a state-policy table — verify with the county assessor before closing.
Climate risk First Street
- Flood 1/10 Low FEMA zone X (unshaded) · 0% chance over 30 yrs
- Wildfire 4/10 Moderate
- Heat 7/10 Severe 7 d/yr ≥107°F today · 16 d/yr by 30 yrs out
- Wind 8/10 Severe 80% chance of damaging wind over 30 yrs
- Air quality 1/10 Low 0 unhealthy d/yr today · 0 by 30 yrs out
Nearby sold comps map
Loading sold comps map…
Walkable amenities ~0.75 mi
Loading nearby amenities…
Taxation est. · year 1
- Rental income
- $19,596
- − Mortgage interest
- −$10,881
- − Property taxes
- −$2,574
- − Insurance
- −$971
- − Repairs & maintenance
- −$1,568
- − Management
- −$1,568
- − Depreciation
- −$5,651
- Taxable loss
- −$3,617
- Est. tax savings @ 24.0%
- +$868
- After-tax cash flow
- $579/yr
For passive investors: Depreciation is non-cash, so a rental often shows a tax loss while cash-flowing — sheltering income. Rental losses are passive: they offset passive income freely, and up to $25,000/yr can offset ordinary (W-2) income if you actively participate and your MAGI is under $100k (phasing out to $0 by $150k); unused losses carry forward. On sale, claimed depreciation is recaptured at up to 25%, and gains may owe capital-gains tax (a 1031 exchange can defer both). Figures are a year-1 estimate at your 24.0% rate — not tax advice; consult a CPA.
Schools (NCES district)
- District
- Cumberland County Schools
- NCES district ID
- 3700011
- Math proficiency
- 32% ▼ -2.00%
- Reading proficiency
- 41% ▼ -1.00%
- Median HH income
- $44,168
- Composite
- 31.0/100
- National rank
- #6096
- State rank
- #126 of 178 in NC
Livability — Fayetteville
- Score
- 75/100
- State rank
- #45
- US rank
- #4031
Category grades
Schools grade is shown separately in the Schools card above.
Census & demographics
- Census place
- Fayetteville, NC
- County
- Cumberland County · 265,314 people
- City population
- 226,118
- Metro
- Fayetteville, NC
- Population (ZIP)
- 37,140
- Household income
- $58,563
- Rent vs Own
- Severe rent burden
- 1667.0
Population outlook (Cumberland County) Hauer SSP2
- Today (2025)
- 330,855 people
- By 2030
- 333,523 · +0.8%
- By 2040
- 335,583 · +1.4%
- By 2050
- 335,325 · +1.4%
- By 2075
- 342,853 · +3.6%
- By 2100
- 340,698 · +3.0%
Race, ethnicity, and origin ACS 2023
- Neighborhood character
- Highly diverse neighborhood (Simpson 0.70)
- Race & ethnicity
- Black 39% White 36% Hispanic / Latino 14% Two or more races 12% Asian 3% Native American 1%
- Hispanic origin (detail)
- Mexican 5% Puerto Rican 5%
- Common ancestry
- Slovak 2% Italian 1% Serbian 1%
- Foreign-born
- 8% · Canada, South Korea, Vietnam
- Languages at home
- 87% English-only · Spanish 9% Tagalog/Filipino 1% French/Haitian/Cajun 1%
Political lean MEDSL · Cumberland
- 2024 margin
- D (+13.4) · D 56.1% · R 42.7% · Other 1.2%
- 2008→2024 swing
- -4.3pp toward R · 2008: 17.7pp · 2024: 13.4pp
- All cycles
- 2024: D+13.4 2020: D+16.6 2016: D+16.0 2012: D+19.7 2008: D+17.7
Not yet ingested
- Civics
- —
Market trends
- HPI YoY
- ▼ -59.90%
- Current HPI
- 215.927
- Rent YoY
- ▲ 3.17%
- Metro
- Fayetteville, NC
- State GDP YoY
- ▲ 3.28%
- F500 in state
- 26
Industry mix (Fortune 500 HQ in NC)
| Industry | F500 HQs | Revenue |
|---|---|---|
| Financial Services | 2 | $213B |
|
||
| Retail | 2 | $95B |
|
||
| Industrial Conglomerate | 1 | $38B |
|
||
| Metals / Steel | 1 | $35B |
|
||
| Utilities | 1 | $30B |
|
||
| Industrial Machinery | 1 | $19B |
|
||
Price history
+5.0% since first listed4 events — show timeline
- 2026-05-19 Price Changed $194,250 LPRMLS
- 2026-04-01 Price Changed $199,750 LPRMLS
- 2026-01-23 Listed $204,900 LPRMLS
- 2019-07-02 Sold (Public Records) $185,000 Public Records
Property tax history
+6.5%/yrLatest (2025): $2,574 · +50.5% YoY. Source: county tax records.
Cash-flow waterfall
monthlySold comps — $/sqft
last 12 mo · ≤1 miLoading sold comps…