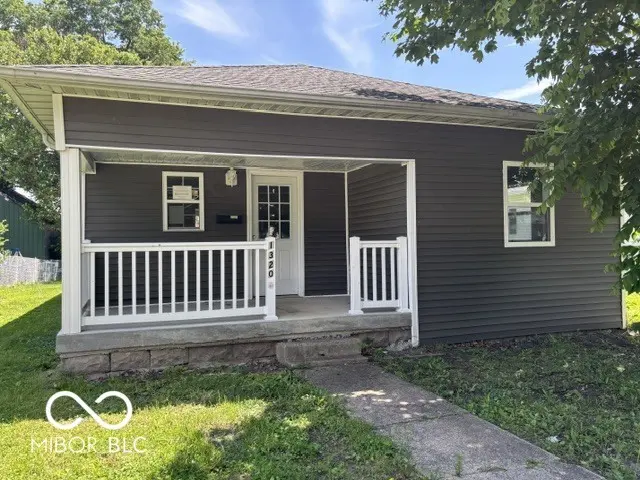
1320 S 5th St · Clinton, IN
Flood risk 1/10 · Minimal
- FEMA flood zone
- X (unshaded)
- Chance of flooding over 30 yrs
- 0.0%
- Est. flood insurance / yr
- $473 – $860
Fire risk 1/10 · Minimal
- Est. fire insurance / yr
- $717 – $1,331
Heat risk 4/10 · Minor
- Hot days now (above 104°F)
- 7 days/yr
- Hot days in 30 yrs
- 19 days/yr
Wind risk 2/10 · Minimal
- Chance of severe wind over 30 yrs
- 1.0%
Air-quality risk 3/10 · Minor
- Unhealthy air days now
- 2 days/yr
- Unhealthy air days in 30 yrs
- 3 days/yr
Risk factors via First Street. Map © Google.
Why this score? — see what drove the D+ grade
The composite is a weighted blend of 9 inputs, each scored 0–100. Each bar is that input's sub-score; the figure is the points it added to the 100-point composite (weight × sub-score).
- Cash flow +16.2/30.0
- Appreciation +6.0/10.0
- DSCR +5.0/10.0
- 1% rule +3.8/10.0
- ARV discount +3.2/15.0
- Schools +3.1/10.0
- Livability +3.1/5.0
- Rent growth +2.5/5.0
- Condition / age +2.5/5.0
$114,000
🖨 Deal sheet 📄 Offer letter ✓ Due diligence
Listing remarks
This one is practically winking at you!!! This charming 2 bedroom, 2 full bath ranch home has a lot of updates! The heart of this home boasts an updated kitchen so inviting, it practically begs you to whip up something delicious. Master bedroom suite offers a rejuvenating NEW walk-in shower and two walk in closets. One additional comfy size bedrooms and bonus room with large walk in closet space could be a dining room/den/library space. Lovely porch perfect for sipping your morning coffee or tea. There's plenty of space for everyone to spread out and enjoy the backyard! Ready to discover your next happy place?
Key facts
- Backyard
- Walk in closets
- Updated kitchen
Tags
Property features AI
Exterior
- Parking: Alley access; Gravel parking
- Utilities: Public water; Municipal sewer connected; No solid waste service listed
- Home design: Single-family residence; One-story home; Residential property
- Construction: Vinyl siding; Cellar and crawl space foundation
- Exterior features: Covered patio/porch; Exterior storage; City lot with sidewalks and mature trees
Interior
- Kitchen: Eat-in kitchen with island and breakfast bar
- Bedrooms: Three bedrooms on the main level; Primary bedroom with walk-in closet
- Bathrooms: Two full bathrooms on the main level; Primary bathroom with full shower stall and suite layout
- Heating & cooling: Forced air heating (natural gas); Central air conditioning
- Interior features: Attic access; Breakfast bar; Kitchen island; Eat-in kitchen; Walk-in closets; Laundry in unit; Basement with exterior entry
- Laundry & utility: Laundry room with full connections
Neighborhood map
What this means for you Summary
Snapshot
- This is a 3-bed/2.0-bath single-family listed at $114k.
Deal economics
- At list price, monthly cash flow is $60 ($722/yr) — positive.
- The deal already cash-flows at list — no discount required.
- To meet the 1% rule (rent ≥ 1% of price), the offer needs to be $101k (11.6% below list).
- Recommended offer: $101k (11.6% below list) — sets the bar for 1% rule.
Location & tenants
- Location reads 62/100 on livability (#474 in IN) — a middle-class / working-renter tenant base. Strengths: cost of living A+, housing A+, crime B; Watch: amenities F, commute F, employment F.
- South Vermillion Community School Corporation (rural): math 31% / reading 42% proficiency, ranked #182 of 301 in IN (top 60%) — families likely to look elsewhere, expect single-tenant / working-renter base with shorter leases.
- Zoned schools: South Vermillion High School (math 27% / reading 62%, grade F, #169 of 369 statewide, top 51%, 478 students, 54% FRL).
- Market conditions: 46 active listings in the ZIP; 28 units permitted in Vermillion County in 2024 (0 in 5+ unit buildings).
Forward outlook
- In year one you build about $3k of equity ($788 loan paydown + $2k appreciation (2.0% local appreciation)).
- Vermillion County population projected at -22% by 2050 — secular population decline; favor cash flow + early exit over multi-decade hold.
- At projected returns (2.0% appreciation + 3.0% rent growth), your $32k cash investment doubles in ~7 years — after that, you're playing with house money.
Negotiation context
- It's been on market 19 days — a 2% lower offer ($112k) is reasonable based on typical stale-listing flexibility.
- 2 sale attempts since 4y ago with the ask held roughly flat each time — persistent listings suggest the price (not the market) is what's stuck; bring a comps-based counter.
- Current owner paid $8k; list at $114k implies a 1325% gain — meaningful room to come down on a strong offer.
Risks & watch-outs
- Watch-outs: built in 1904 — expect roof / HVAC / electrical / plumbing capex.
Questions for the listing agent
- Built in 1904 — when were the roof, HVAC, electrical panel, plumbing, and water heater last replaced?
- Is there a deadline driving the sale (1031 exchange, divorce, estate, relocation)? That informs how much negotiation room exists.
- Schools are F-rated, which usually means shorter tenancies and higher turnover. Who's the typical renter profile here, and what's been the actual vacancy rate?
- The area grade is low — what's the realistic commute time and amenity access for the typical tenant pool here? Any planned neighborhood developments (good or bad) we should know about?
- What's the average days-on-market for RENTAL listings here right now (not sales)? A rising rental-DOM trend means longer vacancies and softer asking-rent achievability than the comps imply.
- What's the recent tenant-quality profile in this submarket — average credit score on applications, eviction rate, late-payment / NSF rate, and stable-employment percentage? A property-management company in the area should have these aggregated.
- How much new for-sale + rental construction is in the pipeline within 1–3 miles? Heavy new supply typically softens prices + rents 12–24 months out; constrained supply supports both.
Investment metrics
- 1% rule
- 0.88% ✗
- Cap rate
- 6.93%
- Cash-on-cash
- 2.26%
- DSCR
- 1.10
- GRM
- 9.4
CMA / ARV
- ARV (on-the-fly)
- $104,104
- Comps found
- 7
Show comp detail 7 sales within ~0.75 mi
| Address | Dist | Beds/Ba | Sqft | Sold | Price | $/sf | Match |
|---|---|---|---|---|---|---|---|
| 1505 S 3rd St | 0.18mi | 2/1.0 (-1) | 1,010 (+1%) | 12mo | $105,000 | $104 | 71 |
| 1349 S 5th St | 0.04mi | 2/1.0 (-1) | 922 (-8%) | 6mo | $95,000 | $103 | 71 |
| 1138 S 3rd St | 0.21mi | 2/1.0 (-1) | 1,020 (+2%) | 11mo | $83,000 | $81 | 69 |
| 931 S Main St | 0.35mi | 2/1.0 (-1) | 1,032 (+3%) | 4mo | $114,000 | $110 | 67 |
| 702 S 5th St | 0.43mi | 2/1.0 (-1) | 1,028 (+3%) | 4mo | $118,000 | $115 | 63 |
| 433 S 8th St | 0.68mi | 2/2.0 (-1) | 1,002 (+0%) | 13mo | $137,500 | $137 | 52 |
| 925 Walnut St | 0.70mi | 2/1.0 (-1) | 1,092 (+9%) | 18mo | $23,000 | $21 | 28 |
Match score weights: distance 35% · size 25% · config 20% · recency 20%. Top-matched comps best support the ARV.
Projected returns pro-forma
1.98% appreciation · 3.0% rent growth · sell at horizon
- IRR
- 6.7%
- Equity multiple
- 1.36×
- Total profit
- $11,541
- Equity at exit
- $44,870
- IRR
- 10.1%
- Equity multiple
- 2.36×
- Total profit
- $43,503
- Equity at exit
- $64,542
Cash invested: $31,920 (down + closing). Projections, not guarantees.
Landlord ↔ Tenant lean methodology
- Overall (STATE)
- 90 Strongly Landlord-Friendly
- State Indiana
- 90 Strongly Landlord-Friendly · R+11
- County
- — inherits STATE
- City
- — inherits STATE
ZIP-level market 47842
- Home prices YoY
- 1.0%
- Active inventory
- 46
- Price-to-rent
- 9.4×
Monthly cashflow live
- Estimated rent
- $1,008 medium interval (Pro) →
- Mortgage (P&I)
- −$598
- Tax from tax record
- −$91 /mo · $1,087/yr
- Insurance
- −$48
- HOA
- −$0
- Vacancy / Maint / Mgmt
- −$212
- Net cashflow
- $60
Break-even live
UW: 25.0% down · 7.5% · 30yr · 1.5% tax · 5.0% vac · 8.0% maint · 8.0% mgmt
Financing live
Cash to close
- Down payment
- $28,500
- Closing costs
- $3,420
- Reserves months
- —
- Total cash needed
- —
Loan-product check · same deal, 3 products live
Conventional
25% down · 7.5% · 30yr
- Down + closing
- —
- Monthly P&I
- —
- Monthly cashflow
- —
- DSCR
- —
- Eligible?
- —
Personal DTI + credit; lowest rate.
DSCR
20% down · 8.5% · 30yr
- Down + closing
- —
- Monthly P&I
- —
- Monthly cashflow
- —
- DSCR
- —
- Eligible?
- —
No personal income docs; deal must DSCR.
Hard money
10% down · 12.0% · 12mo
- Down + closing
- —
- Monthly P&I
- —
- Monthly cashflow
- —
- DSCR
- —
- Eligible?
- —
Short-term bridge; refi at stabilization.
Listing history 16 events
-
2026-06-18days on market $114,000 Active 19 DOM
-
2026-06-17days on market $114,000 Active 18 DOM
-
2026-06-16days on market $114,000 Active 17 DOM
-
2026-06-15days on market $114,000 Active 16 DOM
-
2026-06-13days on market $114,000 Active 14 DOM
-
2026-06-12days on market $114,000 Active 13 DOM
-
2026-06-09days on market $114,000 Active 10 DOM
-
2026-06-08days on market $114,000 Active 9 DOM
-
2026-06-07days on market $114,000 Active 8 DOM
-
2026-06-07remarks 617-char remark
-
2026-06-07days on market $114,000 Active 7 DOM
-
2026-06-04days on market $114,000 Active 4 DOM
-
2026-06-02days on market $114,000 Active 3 DOM
-
2026-06-01days on market $114,000 Active 2 DOM
-
2026-05-31remarks 584-char remark
-
2026-05-31$114,000 Active 1 DOM
ⓘ Source: listings_history table (triggers on properties + properties_extension) + one-shot
backfill from property_details.listing_events for pre-trigger history.
Tax reassessment forecast IN · Partial reset (capped growth)
- Current annual tax
- $1,087 · $91/mo
- Projected year-2 tax
- $1,087 · $91/mo
- Expected delta
- $0/yr ($0/mo · 0.0%)
ⓘ Screening estimate from a state-policy table — verify with the county assessor before closing.
Climate risk First Street
- Flood 1/10 Low FEMA zone X (unshaded) · 0% chance over 30 yrs
- Wildfire 1/10 Low
- Heat 4/10 Moderate 7 d/yr ≥104°F today · 19 d/yr by 30 yrs out
- Wind 2/10 Low 100% chance of damaging wind over 30 yrs
- Air quality 3/10 Moderate 2 unhealthy d/yr today · 3 by 30 yrs out
Nearby sold comps map
Loading sold comps map…
Walkable amenities ~0.75 mi
Loading nearby amenities…
Taxation est. · year 1
- Rental income
- $12,092
- − Mortgage interest
- −$6,386
- − Property taxes
- −$1,087
- − Insurance
- −$570
- − Repairs & maintenance
- −$967
- − Management
- −$967
- − Depreciation
- −$3,316
- Taxable loss
- −$1,202
- Est. tax savings @ 24.0%
- +$288
- After-tax cash flow
- $1,010/yr
For passive investors: Depreciation is non-cash, so a rental often shows a tax loss while cash-flowing — sheltering income. Rental losses are passive: they offset passive income freely, and up to $25,000/yr can offset ordinary (W-2) income if you actively participate and your MAGI is under $100k (phasing out to $0 by $150k); unused losses carry forward. On sale, claimed depreciation is recaptured at up to 25%, and gains may owe capital-gains tax (a 1031 exchange can defer both). Figures are a year-1 estimate at your 24.0% rate — not tax advice; consult a CPA.
Schools (NCES district)
- District
- South Vermillion Community School Corporation
- NCES district ID
- 1810590
- Math proficiency
- 31% ▼ -6.00%
- Reading proficiency
- 42% ▬ 0.00%
- Median HH income
- $42,809
- Composite
- 30.87/100
- National rank
- #6123
- State rank
- #182 of 301 in IN
Livability — Clinton
- Score
- 62/100
- State rank
- #474
- US rank
- #16763
Category grades
Schools grade is shown separately in the Schools card above.
Census & demographics
- Census place
- Clinton, IN
- Population (ZIP)
- 9,675
Population outlook (Vermillion County) Hauer SSP2
- Today (2025)
- 14,605 people
- By 2030
- 13,942 · -4.5%
- By 2040
- 12,592 · -13.8%
- By 2050
- 11,381 · -22.1%
- By 2075
- 9,063 · -37.9%
- By 2100
- 7,098 · -51.4%
Race, ethnicity, and origin ACS 2023
- Neighborhood character
- Predominantly White (97%)
- Race & ethnicity
- White 97% Two or more races 3%
- Common ancestry
- Italian 2% Lithuanian 2% Iranian 1%
- Foreign-born
- 0%
Political lean MEDSL · Vermillion
- 2024 margin
- Solid R (+44.7) · D 26.6% · R 71.3% · Other 2.1%
- 2008→2024 swing
- -58.7pp toward R · 2008: 13.9pp · 2024: -44.7pp
- All cycles
- 2024: R+44.7 2020: R+40.6 2016: R+35.1 2012: R+6.8 2008: D+13.9
Not yet ingested
- Civics
- —
Market trends
- HPI YoY
- ▲ 1.98%
- Current HPI
- 201.465
- Rent YoY
- —
- Metro
- —
- State GDP YoY
- ▲ 2.90%
- F500 in state
- 18
Industry mix (Fortune 500 HQ in IN)
| Industry | F500 HQs | Revenue |
|---|---|---|
| Industrial Machinery | 2 | $37B |
|
||
| Healthcare | 1 | $177B |
|
||
| Pharmaceuticals | 1 | $45B |
|
||
| Metals / Steel | 1 | $18B |
|
||
| Agriculture | 1 | $17B |
|
||
| Packaging | 1 | $12B |
|
||
Price history
+1325.0% since first listed4 events — show timeline
- 2026-05-30 Listed $114,000 MIBOR as Distributed by MLS Grid
- 2022-06-10 Delisted — THAAR
- 2022-05-04 Listed $112,000 THAAR
- 2009-08-31 Sold (Public Records) $8,000 Public Records
Property tax history
+1.3%/yrLatest (2024): $1,087 · +7.0% YoY. Source: county tax records.
Cash-flow waterfall
monthlySold comps — $/sqft
last 12 mo · ≤1 miLoading sold comps…