 🏷️ Likely Rental
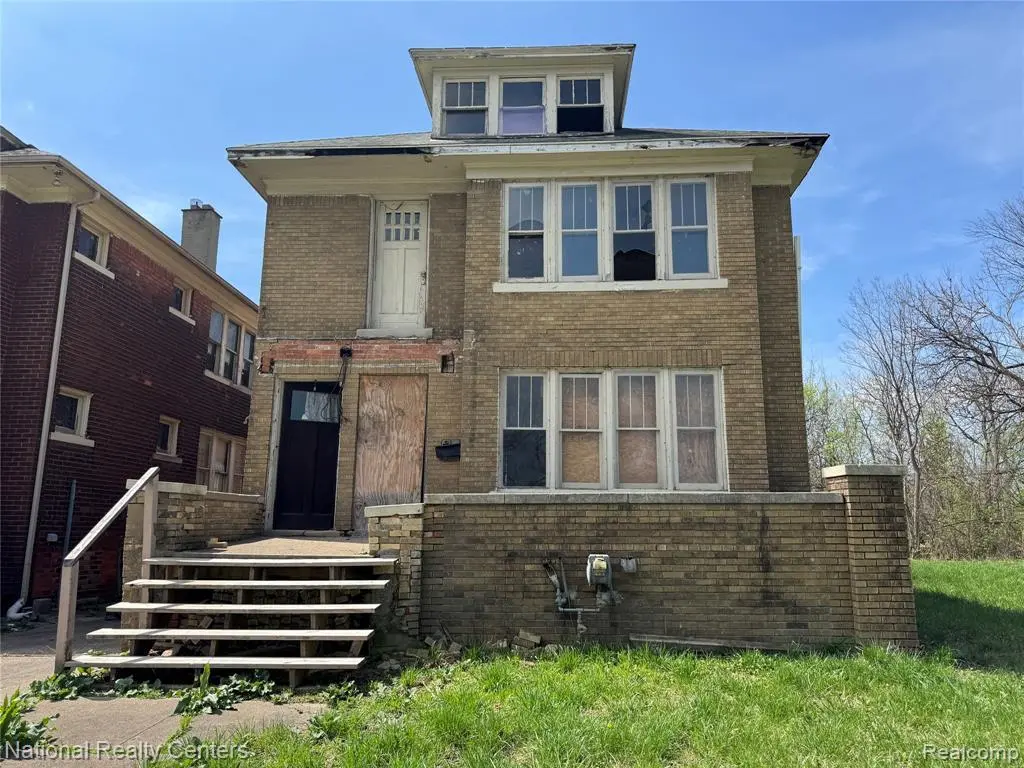
3417 Gray St · Detroit, MI
Flood risk 1/10 · Minimal
- FEMA flood zone
- X (unshaded)
- Chance of flooding over 30 yrs
- 0.0%
- Est. flood insurance / yr
- $473 – $860
Fire risk 1/10 · Minimal
- Est. fire insurance / yr
- $784 – $1,456
Heat risk 3/10 · Minor
- Hot days now (above 96°F)
- 7 days/yr
- Hot days in 30 yrs
- 15 days/yr
Wind risk 2/10 · Minimal
- Chance of severe wind over 30 yrs
- —
Air-quality risk 3/10 · Minor
- Unhealthy air days now
- 2 days/yr
- Unhealthy air days in 30 yrs
- 5 days/yr
Risk factors via First Street. Map © Google.
Why this score? — see what drove the D grade
The composite is a weighted blend of 9 inputs, each scored 0–100. Each bar is that input's sub-score; the figure is the points it added to the 100-point composite (weight × sub-score).
- Cash flow +15.0/30.0
- ARV discount +7.5/15.0
- 1% rule +5.0/10.0
- DSCR +5.0/10.0
- Livability +3.7/5.0
- Rent growth +2.5/5.0
- Condition / age +2.5/5.0
- Schools +1.3/10.0
- Appreciation +0.0/10.0
$22,500
🖨 Deal sheet 📄 Offer letter ✓ Due diligence
Listing remarks MLS
Fantastic opportunity on this duplex on Detroit’s east side, a growing market that continues to attract savvy investors. This two-story, 2,500 sq. ft. property offers two 2-bed, 1-bath units, each with about 1,200 sq. ft. of living space and a full basement. Needs work, and the price reflects the condition, making it a strong fit for investors looking to add equity and boost long-term cash flow. BATVAI. Sold As-is. LAND CONTRACT TERMS AVAILABLE at $35,000 purchase price, $10,000 down payment, 11% interest for 60 month at $575/mo
Key facts
- 4,356 sq ft lot
- Built 1924
- Listed 61 days
Neighborhood map
What this means for you Summary
Snapshot
- This is a 4-bed/2.5-bath townhouse listed at $22k.
Deal economics
- At list price, monthly cash flow is $788 ($9k/yr) — positive.
- The deal already cash-flows at list — no discount required.
- Meets the 1% rule at list price ($1k rent vs $22k).
- Recommended offer: $21k (6.0% below list) — sets the bar for market timing.
- Cap rate 48.3% vs local median 10.2% in Detroit — top-decile yield for the area; either an underpriced asset or a hidden risk that comps aren't pricing in. Stress-test before assuming the spread holds.
Location & tenants
- Location reads 73/100 on livability (#218 in MI) — a middle-class / working-renter tenant base. Strengths: amenities A+, commute A+, cost of living A+; Watch: schools F, crime F, employment F.
- Detroit Public Schools Community District (urban): math 10% / reading 24% proficiency, ranked #499 of 540 in MI (top 92%) — low school quality limits family demand, transient renter base, plan for 1-2y turnover; 90% free/reduced lunch — lower-income household profile, screen leases tightly.
- Market conditions: 137 active listings in the ZIP; 2 comparable units currently listed for rent nearby; 2,639 units permitted in Wayne County in 2024 (1,216 in 5+ unit buildings).
Forward outlook
- Local home prices are declining (-3.0%/yr); year-one equity from $156 of loan paydown is wiped out by about $675 of value loss. Plan a longer hold.
- Wayne County population projected at -17% by 2050 — secular population decline; favor cash flow + early exit over multi-decade hold.
- At projected returns (-3.0% appreciation + 3.0% rent growth), your $6k cash investment doubles in ~1 year — after that, you're playing with house money.
Negotiation context
- It's been on market 61 days — a 6% lower offer ($21k) is reasonable based on typical stale-listing flexibility.
- 12 sale attempts since 4y ago; this cycle's ask has dropped $5k (18%) from the opening price — seller is motivated, your offer sets the floor, not the list.
Risks & watch-outs
- Watch-outs: property tax is 3.4% of price; built in 1924 — expect roof / HVAC / electrical / plumbing capex.
Questions for the listing agent
- It's been on market 61 days. Have you received any prior offers? Is the seller open to a 6% concession, seller financing, or rate buy-down credit?
- Built in 1924 — when were the roof, HVAC, electrical panel, plumbing, and water heater last replaced?
- Property tax is high relative to price — has the assessment been appealed recently, and will the sale trigger a re-assessment?
- Why hasn't it sold? Are there any deal-killer items the seller is aware of (foundation, flood, title, zoning, code violations)?
- Is there a deadline driving the sale (1031 exchange, divorce, estate, relocation)? That informs how much negotiation room exists.
- Schools are F-rated, which usually means shorter tenancies and higher turnover. Who's the typical renter profile here, and what's been the actual vacancy rate?
- Crime grade is F in this area — have there been break-ins, vandalism, or insurance claims at this property in the last 3 years? What carrier currently insures it and at what premium?
- The area grade is low — what's the realistic commute time and amenity access for the typical tenant pool here? Any planned neighborhood developments (good or bad) we should know about?
- What's the average days-on-market for RENTAL listings here right now (not sales)? A rising rental-DOM trend means longer vacancies and softer asking-rent achievability than the comps imply.
- What's the recent tenant-quality profile in this submarket — average credit score on applications, eviction rate, late-payment / NSF rate, and stable-employment percentage? A property-management company in the area should have these aggregated.
- How much new for-sale + rental construction is in the pipeline within 1–3 miles? Heavy new supply typically softens prices + rents 12–24 months out; constrained supply supports both.
Investment metrics
- 1% rule
- 5.51% ✓
- Cap rate
- 48.33%
- Cash-on-cash
- 150.12%
- DSCR
- 7.68
- GRM
- 1.5
CMA / ARV
- ARV (median comp)
- $112,787
- List price
- $22,500
- Delta
- -78.99%
- Verdict
- UNDERPRICED
- Comps
- 19 within 1.0 mi
Projected returns pro-forma
-3.0% appreciation · 3.0% rent growth · sell at horizon
- IRR
- —
- Equity multiple
- 8.40×
- Total profit
- $46,592
- Equity at exit
- $3,355
- IRR
- —
- Equity multiple
- 17.73×
- Total profit
- $105,372
- Equity at exit
- $1,945
Cash invested: $6,300 (down + closing). Projections, not guarantees.
Landlord ↔ Tenant lean methodology
- Overall (STATE)
- 62 Landlord-Friendly
- State Michigan
- 62 Landlord-Friendly · EVEN
- County
- — inherits STATE
- City
- — inherits STATE
ZIP-level market 48215
- Home prices YoY
- -24.1%
- Active inventory
- 137
- Price-to-rent
- 1.5×
Monthly cashflow live
- Estimated rent
- $1,239 medium interval (Pro) →
- Mortgage (P&I)
- −$118
- Tax from tax record
- −$63 /mo · $758/yr
- Insurance
- −$9
- HOA
- −$0
- Vacancy / Maint / Mgmt
- −$260
- Net cashflow
- $788
Break-even live
UW: 25.0% down · 7.5% · 30yr · 1.5% tax · 5.0% vac · 8.0% maint · 8.0% mgmt
Financing live
Cash to close
- Down payment
- $5,625
- Closing costs
- $675
- Reserves months
- —
- Total cash needed
- —
Loan-product check · same deal, 3 products live
Conventional
25% down · 7.5% · 30yr
- Down + closing
- —
- Monthly P&I
- —
- Monthly cashflow
- —
- DSCR
- —
- Eligible?
- —
Personal DTI + credit; lowest rate.
DSCR
20% down · 8.5% · 30yr
- Down + closing
- —
- Monthly P&I
- —
- Monthly cashflow
- —
- DSCR
- —
- Eligible?
- —
No personal income docs; deal must DSCR.
Hard money
10% down · 12.0% · 12mo
- Down + closing
- —
- Monthly P&I
- —
- Monthly cashflow
- —
- DSCR
- —
- Eligible?
- —
Short-term bridge; refi at stabilization.
Rent comps 2 comps
| Address | Beds | Baths | Sqft | Rent | $/sqft | DOM | Units | Dist |
|---|---|---|---|---|---|---|---|---|
| 2174 Springle St Detroit, MI | 3.0 | 1.0 | 2256 | $1,150 | $0.51 | 1d | 1 | 0.45mi |
| 4510 Harding St Detroit, MI | 3.0 | 1.0 | 2394 | $1,500 | $0.63 | 17d | 1 | 1.40mi |
Listing history 44 events
-
2026-06-18days on market $22,500 Active 61 DOM
-
2026-06-17price $22,500 Active 60 DOM
-
2026-06-17days on market $23,700 Active 60 DOM
-
2026-06-15days on market $23,700 Active 58 DOM
-
2026-06-13days on market $23,700 Active 56 DOM
-
2026-06-13days on market $23,700 Active 55 DOM
-
2026-06-09days on market $23,700 Active 52 DOM
-
2026-06-08days on market $23,700 Active 51 DOM
-
2026-06-07days on market $23,700 Active 50 DOM
-
2026-06-04days on market $23,700 Active 47 DOM
-
2026-06-03pricedays on market $23,700 Active 46 DOM
-
2026-06-02days on market $25,500 Active 45 DOM
-
2026-06-01days on market $25,500 Active 44 DOM
-
2026-05-31days on market $25,500 Active 43 DOM
-
2026-04-17$27,500 Active 540-char remark
Show marketing remark (534 chars)
Fantastic opportunity on this duplex on Detroit's east side, a growing market that continues to attract savvy investors. This two-story, 2,500 sq. ft. property offers two 2-bed, 1-bath units, each with about 1,200 sq. ft. of living space and a full basement. Needs work, and the price reflects the condition, making it a strong fit for investors looking to add equity and boost long-term cash flow. BATVAI. Sold As-is. LAND CONTRACT TERMS AVAILABLE at $35,000 purchase price, $10,000 down payment, 11% interest for 60 month at $575/mo
-
2026-04-17$27,500 Active 534-char remark
Show marketing remark (534 chars)
Fantastic opportunity on this duplex on Detroit's east side, a growing market that continues to attract savvy investors. This two-story, 2,500 sq. ft. property offers two 2-bed, 1-bath units, each with about 1,200 sq. ft. of living space and a full basement. Needs work, and the price reflects the condition, making it a strong fit for investors looking to add equity and boost long-term cash flow. BATVAI. Sold As-is. LAND CONTRACT TERMS AVAILABLE at $35,000 purchase price, $10,000 down payment, 11% interest for 60 month at $575/mo
-
2026-04-17$27,500 Active
Show marketing remark (534 chars)
Fantastic opportunity on this duplex on Detroit's east side, a growing market that continues to attract savvy investors. This two-story, 2,500 sq. ft. property offers two 2-bed, 1-bath units, each with about 1,200 sq. ft. of living space and a full basement. Needs work, and the price reflects the condition, making it a strong fit for investors looking to add equity and boost long-term cash flow. BATVAI. Sold As-is. LAND CONTRACT TERMS AVAILABLE at $35,000 purchase price, $10,000 down payment, 11% interest for 60 month at $575/mo
-
2025-12-11historical
-
2025-12-11historical
-
2025-12-01price $25,000
-
2025-12-01price $25,000
-
2025-11-13price $30,000
-
2025-11-12price $30,000
-
2025-11-11$35,000 Active
-
2025-11-11$35,000 Active
-
2023-05-25status Pending
-
2023-05-25status Pending
-
2023-05-25historical
-
2023-05-25historical
-
2023-03-25price $30,000
-
2023-03-25price $30,000
-
2023-03-20$40,000 Active
-
2023-03-20historical
-
2023-03-20$40,000 Active
-
2023-03-20historical
-
2023-02-07price $50,000
-
2023-02-07price $50,000
-
2022-12-13$60,000 Active
-
2022-12-13$60,000 Active
-
2022-07-30historical
-
2022-07-30historical
-
2022-04-12$25,000 Active
-
2022-04-12$25,000 Active
ⓘ Source: listings_history table (triggers on properties + properties_extension) + one-shot
backfill from property_details.listing_events for pre-trigger history.
Tax reassessment forecast MI · Partial reset (capped growth)
- Current annual tax
- $758 · $63/mo
- Projected year-2 tax
- $758 · $63/mo
- Expected delta
- $0/yr ($0/mo · 0.0%)
ⓘ Screening estimate from a state-policy table — verify with the county assessor before closing.
Climate risk First Street
- Flood 1/10 Low FEMA zone X (unshaded) · 0% chance over 30 yrs
- Wildfire 1/10 Low
- Heat 3/10 Moderate 7 d/yr ≥96°F today · 15 d/yr by 30 yrs out
- Wind 2/10 Low
- Air quality 3/10 Moderate 2 unhealthy d/yr today · 5 by 30 yrs out
Nearby sold comps map
Loading sold comps map…
Walkable amenities ~0.75 mi
Loading nearby amenities…
Taxation est. · year 1
- Rental income
- $14,866
- − Mortgage interest
- −$1,260
- − Property taxes
- −$758
- − Insurance
- −$112
- − Repairs & maintenance
- −$1,189
- − Management
- −$1,189
- − Depreciation
- −$655
- Taxable income
- $9,702
- Est. tax owed @ 24.0%
- −$2,329
- After-tax cash flow
- $7,129/yr
For passive investors: Depreciation is non-cash, so a rental often shows a tax loss while cash-flowing — sheltering income. Rental losses are passive: they offset passive income freely, and up to $25,000/yr can offset ordinary (W-2) income if you actively participate and your MAGI is under $100k (phasing out to $0 by $150k); unused losses carry forward. On sale, claimed depreciation is recaptured at up to 25%, and gains may owe capital-gains tax (a 1031 exchange can defer both). Figures are a year-1 estimate at your 24.0% rate — not tax advice; consult a CPA.
Schools (NCES district)
- District
- Detroit Public Schools Community District
- NCES district ID
- 2601103
- Math proficiency
- 10% ▼ -2.00%
- Reading proficiency
- 24% ▲ 6.00%
- Median HH income
- $25,815
- Composite
- 13.06/100
- National rank
- #9564
- State rank
- #499 of 540 in MI
Livability — Detroit
- Score
- 73/100
- State rank
- #218
- US rank
- #5427
Category grades
Schools grade is shown separately in the Schools card above.
Census & demographics
- Census place
- Detroit, MI
- City population
- 572,865
- Population (ZIP)
- 10,238
Population outlook (Wayne County) Hauer SSP2
- Today (2025)
- 1,675,273 people
- By 2030
- 1,620,300 · -3.3%
- By 2040
- 1,502,341 · -10.3%
- By 2050
- 1,384,039 · -17.4%
- By 2075
- 1,124,592 · -32.9%
- By 2100
- 881,193 · -47.4%
Race, ethnicity, and origin ACS 2023
- Neighborhood character
- Predominantly Black (87%)
- Race & ethnicity
- Black 87% White 9% Two or more races 2% Hispanic / Latino 2%
- Common ancestry
- Romanian 1% Slovak 1% Lithuanian 1%
- Foreign-born
- 1% · Canada
- Languages at home
- 99% English-only · Spanish 1%
Political lean MEDSL · Wayne
- 2024 margin
- Strong D (+29.0) · D 62.7% · R 33.7% · Other 3.6%
- 2008→2024 swing
- -20.5pp toward R · 2008: 49.5pp · 2024: 29.0pp
- All cycles
- 2024: D+29.0 2020: D+38.1 2016: D+37.3 2012: D+46.9 2008: D+49.5
Not yet ingested
- Civics
- —
Market trends
- HPI YoY
- ▼ -60.84%
- Current HPI
- 191.0405
- Rent YoY
- —
- Metro
- —
- State GDP YoY
- ▲ 1.37%
- F500 in state
- 28
Industry mix (Fortune 500 HQ in MI)
| Industry | F500 HQs | Revenue |
|---|---|---|
| Automotive Parts | 3 | $48B |
|
||
| Automotive | 2 | $372B |
|
||
| Chemicals | 1 | $45B |
|
||
| Automotive Retail | 1 | $29B |
|
||
| Healthcare / Medical Devices | 1 | $23B |
|
||
| Automotive Technology | 1 | $20B |
|
||
Price history
+10.0% since first listed30 events — show timeline
- 2026-04-17 Listed $27,500 MiRealSource-MiMLS
- 2026-04-17 Listed $27,500 REALCOMP
- 2026-04-17 Listed $27,500 MiRealSource-MiMLS
- 2026-04-17 Listed $27,500 REALCOMP
- 2025-12-11 Listing Removed — MiRealSource-MiMLS
- 2025-12-11 Listing Removed — REALCOMP
- 2025-12-01 Price Changed $25,000 MiRealSource-MiMLS
- 2025-12-01 Price Changed $25,000 REALCOMP
- 2025-11-13 Price Changed $30,000 MiRealSource-MiMLS
- 2025-11-12 Price Changed $30,000 REALCOMP
- 2025-11-11 Listed $35,000 MiRealSource-MiMLS
- 2025-11-11 Listed $35,000 REALCOMP
- 2023-05-25 Pending — MiRealSource-MiMLS
- 2023-05-25 Pending — REALCOMP
- 2023-05-25 Listing Removed — MiRealSource-MiMLS
- 2023-05-25 Listing Removed — REALCOMP
- 2023-03-25 Price Changed $30,000 MiRealSource-MiMLS
- 2023-03-25 Price Changed $30,000 REALCOMP
- 2023-03-20 Listing Removed — MiRealSource-MiMLS
- 2023-03-20 Listed $40,000 MiRealSource-MiMLS
- 2023-03-20 Listing Removed — REALCOMP
- 2023-03-20 Listed $40,000 REALCOMP
- 2023-02-07 Price Changed $50,000 MiRealSource-MiMLS
- 2023-02-07 Price Changed $50,000 REALCOMP
- 2022-12-13 Listed $60,000 MiRealSource-MiMLS
- 2022-12-13 Listed $60,000 REALCOMP
- 2022-07-30 Listing Removed — MiRealSource-MiMLS
- 2022-07-30 Listing Removed — REALCOMP
- 2022-04-12 Listed $25,000 MiRealSource-MiMLS
- 2022-04-12 Listed $25,000 REALCOMP
Property tax history
+0.7%/yrLatest (2025): $758 · +18.1% YoY. Source: county tax records.
Cash-flow waterfall
monthlySold comps — $/sqft
last 12 mo · ≤1 miLoading sold comps…