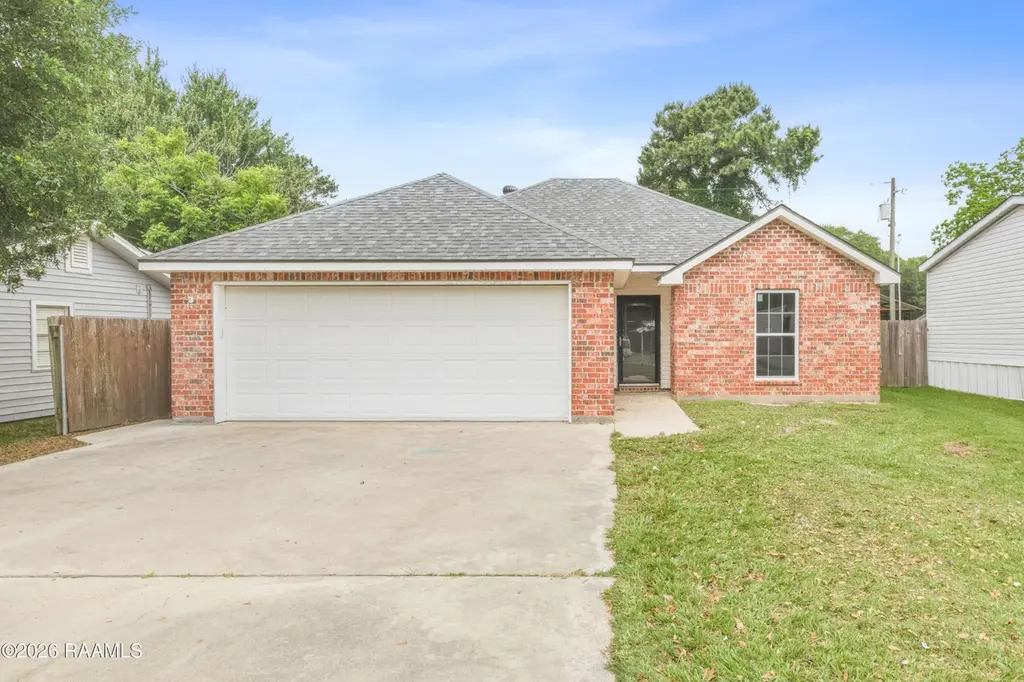
914 Olga St · Rayne, LA
Flood risk 1/10 · Minimal
- FEMA flood zone
- X (unshaded)
- Chance of flooding over 30 yrs
- 0.0%
- Est. flood insurance / yr
- $507 – $1,088
Fire risk 3/10 · Minor
- Est. fire insurance / yr
- $1,269 – $2,357
Heat risk 9/10 · Severe
- Hot days now (above 109°F)
- 7 days/yr
- Hot days in 30 yrs
- 20 days/yr
Wind risk 9/10 · Severe
- Chance of severe wind over 30 yrs
- 99.0%
Air-quality risk 1/10 · Minimal
- Unhealthy air days now
- 0 days/yr
- Unhealthy air days in 30 yrs
- 0 days/yr
Risk factors via First Street. Map © Google.
Why this score? — see what drove the D grade
The composite is a weighted blend of 9 inputs, each scored 0–100. Each bar is that input's sub-score; the figure is the points it added to the 100-point composite (weight × sub-score).
- Cash flow +15.6/30.0
- ARV discount +8.9/15.0
- DSCR +4.8/10.0
- Livability +3.8/5.0
- 1% rule +3.2/10.0
- Schools +3.2/10.0
- Rent growth +2.5/5.0
- Condition / age +2.5/5.0
- Appreciation +0.0/10.0
$160,000
🖨 Deal sheet (PDF) 📄 Offer letter ✓ Due diligence
Listing remarks
Qualifies for Rural Development 100% financing! Brand new roof! Built in 2005, 914 Olga St Rayne is a brick on slab 3 bed 2 bath 1,400 sqft home that has recently been updated. You will find fresh paint and new floors throughout. New plumbing and lighting fixtures as well as granite counter tops in the kitchen. The primary bath has a separate shower and tub. There is a large, covered patio off the back for shade in the afternoon. The 2-car garage is great for storage and privacy. This home does not require flood insurance and has never flooded. Don't wait, make your appointment today!
Key facts
- New floors
- New plumbing
- Fresh paint
Tags
Property features AI
Exterior
- Parking: Attached garage with 2 covered spaces; Open parking available (total 2 parking spaces)
- Utilities: Public sewer; City electric
- Home design: Single family residence; City street and paved road frontage
- Construction: Brick veneer and frame construction; Composition roof
- Exterior features: Covered patio/porch; Storage structure; Workshop; Full wood fencing
Interior
- Kitchen: Electric stove/convection
- Flooring: Vinyl plank
- Bathrooms: 2 full bathrooms
- Heating & cooling: Central heating (electric); Central air conditioning
- Interior features: Crown molding; Granite counters; Window treatments; Double-pane windows; Lighting
- Laundry & utility: Washer hookup; Electric dryer hookup
Neighborhood map
What this means for you Summary
Snapshot
- This is a 3-bed/2.0-bath single-family listed at $160k.
Deal economics
- At list price, monthly cash flow is $66 ($793/yr) — positive.
- The deal already cash-flows at list — no discount required.
- To meet the 1% rule (rent ≥ 1% of price), the offer needs to be $132k (17.7% below list).
- Recommended offer: $132k (17.7% below list) — sets the bar for 1% rule.
Location & tenants
- Location reads 75/100 on livability (#18 in LA, #3,895 nationally) — a middle-class / working-renter tenant base. Strengths: crime A+, cost of living A+, housing A+; Watch: amenities F, commute F, employment F.
- Acadia Parish (rural): math 32% / reading 44% proficiency, ranked #28 of 98 in LA (top 29%) — families likely to look elsewhere, expect single-tenant / working-renter base with shorter leases; 62% free/reduced lunch — lower-income household profile, screen leases tightly.
- Zoned schools: Martin Petitjean Elementary School (math 32% / reading 47%, grade F, #224 of 646 statewide, top 37%, 342 students, 85% FRL); Armstrong Middle School (math 15% / reading 38%, grade F, #135 of 218 statewide, top 62%, 340 students, 79% FRL); Rayne High School (math 30% / reading 47%, grade F, #88 of 265 statewide, top 33%, 640 students, 63% FRL).
- Market conditions: 97 active listings in the ZIP; 2 comparable units currently listed for rent nearby; 137 units permitted in Acadia Parish in 2024 (0 in 5+ unit buildings).
Forward outlook
- Local home prices are declining (-3.0%/yr); year-one equity from $1k of loan paydown is wiped out by about $5k of value loss. Plan a longer hold.
Negotiation context
- Only 5 days on market — expect competitive offers; lowballing is unlikely to land.
- Current owner paid $86k; list at $160k implies a 86% gain — meaningful room to come down on a strong offer.
Risks & watch-outs
- Climate carrying-cost: severe wind risk, 99% chance of damaging wind over 30y; extreme-heat days projected 7→20/yr by 2055 (HVAC capex compounding) — expect insurance premiums to compound above CPI over the hold.
Questions for the listing agent
- Is there a deadline driving the sale (1031 exchange, divorce, estate, relocation)? That informs how much negotiation room exists.
- Schools are B-rated — typically a magnet for longer-tenancy family renters. What's the average tenant stay here, and is there a school-zone premium baked into asking?
- The area grade is low — what's the realistic commute time and amenity access for the typical tenant pool here? Any planned neighborhood developments (good or bad) we should know about?
- What's the average days-on-market for RENTAL listings here right now (not sales)? A rising rental-DOM trend means longer vacancies and softer asking-rent achievability than the comps imply.
- What's the recent tenant-quality profile in this submarket — average credit score on applications, eviction rate, late-payment / NSF rate, and stable-employment percentage? A property-management company in the area should have these aggregated.
- How much new for-sale + rental construction is in the pipeline within 1–3 miles? Heavy new supply typically softens prices + rents 12–24 months out; constrained supply supports both.
Investment metrics
- 1% rule
- 0.82% ✗
- Cap rate
- 6.79%
- Cash-on-cash
- 1.77%
- DSCR
- 1.08
- GRM
- 10.1
CMA / ARV
- ARV (on-the-fly)
- $165,200
- Comps found
- 12
Show comp detail 12 sales within ~0.75 mi
| Address | Dist | Beds/Ba | Sqft | Sold | Price | $/sf | Match |
|---|---|---|---|---|---|---|---|
| 914 Olga St | 0.00mi | 3/2.0 | 1,400 (0%) | 1mo | $165,000 | $118 | 100 |
| 1001 Theo Dr | 0.16mi | 3/1.5 | 1,274 (-9%) | 7mo | $117,000 | $92 | 70 |
| 404 S Cunningham St | 0.62mi | 3/2.0 | 1,360 (-3%) | 7mo | $175,000 | $129 | 60 |
| 813 S Arenas St | 0.55mi | 3/2.0 | 1,450 (+4%) | 10mo | $184,000 | $127 | 60 |
| 410 W Bernard St | 0.35mi | 2/2.0 (-1) | 1,242 (-11%) | 3mo | $120,000 | $97 | 58 |
| 1226 Barbara St | 0.50mi | 2/2.0 (-1) | 1,409 (+1%) | 16mo | $150,000 | $106 | 58 |
| 1511 Edwin Dr | 0.73mi | 3/2.5 | 1,410 (+1%) | 8mo | $160,000 | $113 | 56 |
| 1213 S Marie St | 0.40mi | 3/2.0 | 1,203 (-14%) | 6mo | $165,000 | $137 | 53 |
| 510 S Arenas St | 0.62mi | 2/2.0 (-1) | 1,487 (+6%) | 8mo | $155,000 | $104 | 49 |
| 310 S Arenas St | 0.70mi | 3/2.0 | 1,513 (+8%) | 8mo | $220,000 | $145 | 48 |
| 1111 Barbara St | 0.50mi | 3/1.0 | 1,192 (-15%) | 10mo | $149,500 | $125 | 40 |
| 608 S Parkerson St | 0.48mi | 2/1.0 (-1) | 1,237 (-12%) | 12mo | $134,020 | $108 | 39 |
Match score weights: distance 35% · size 25% · config 20% · recency 20%. Top-matched comps best support the ARV.
Projected returns pro-forma
-3.0% appreciation · 3.0% rent growth · sell at horizon
- IRR
- -13.5%
- Equity multiple
- 0.51×
- Total profit
- $-21,776
- Equity at exit
- $23,857
- IRR
- -4.7%
- Equity multiple
- 0.69×
- Total profit
- $-13,787
- Equity at exit
- $13,834
Cash invested: $44,800 (down + closing). Projections, not guarantees.
Landlord ↔ Tenant lean methodology
- Overall (STATE)
- 90 Strongly Landlord-Friendly
- State Louisiana
- 90 Strongly Landlord-Friendly · R+12
- County
- — inherits STATE
- City
- — inherits STATE
ZIP-level market 70578
- Active inventory
- 97
- Price-to-rent
- 10.1×
Monthly cashflow live
- Estimated rent
- $1,317 medium interval (Pro) →
- Mortgage (P&I)
- −$839
- Tax from tax record
- −$68 /mo · $821/yr
- Insurance
- −$67
- HOA
- −$0
- Vacancy / Maint / Mgmt
- −$277
- Net cashflow
- $66
Break-even live
Sensitivity live
| Price | -10% $157 | -5% $111 | +0% $66 | +5% $21 | +10% $-24 |
|---|---|---|---|---|---|
| Rent | -10% $-38 | -5% $14 | +0% $66 | +5% $118 | +10% $170 |
| Rate | -1.0pp $147 | -0.5pp $107 | base $66 | +0.5pp $25 | +1.0pp $-18 |
UW: 25.0% down · 7.5% · 30yr · 1.5% tax · 5.0% vac · 8.0% maint · 8.0% mgmt
Financing live
Cash to close
- Down payment
- $40,000
- Closing costs
- $4,800
- Reserves months
- —
- Total cash needed
- —
Loan-product check · same deal, 3 products live
Conventional
25% down · 7.5% · 30yr
- Down + closing
- —
- Monthly P&I
- —
- Monthly cashflow
- —
- DSCR
- —
- Eligible?
- —
Personal DTI + credit; lowest rate.
DSCR
20% down · 8.5% · 30yr
- Down + closing
- —
- Monthly P&I
- —
- Monthly cashflow
- —
- DSCR
- —
- Eligible?
- —
No personal income docs; deal must DSCR.
Hard money
10% down · 12.0% · 12mo
- Down + closing
- —
- Monthly P&I
- —
- Monthly cashflow
- —
- DSCR
- —
- Eligible?
- —
Short-term bridge; refi at stabilization.
Rent comps 2 comps
| Address | Beds | Baths | Sqft | Rent | $/sqft | DOM | Units | Dist |
|---|---|---|---|---|---|---|---|---|
| 214 E D St Rayne, LA | 2.0 | 2.0 | 1434 | $1,575 | $1.10 | 15d | 1 | 1.31mi |
| 422 Ann Dr Rayne, LA | 3.0 | 1.0 | 1100 | $995 | $0.90 | 23d | 1 | 1.32mi |
Listing history 3 events
-
2026-05-05status Pending
-
2026-04-30$160,000 Active
-
2026-03-09soldstatus $86,000
ⓘ Source: listings_history table (triggers on properties + properties_extension) + one-shot
backfill from property_details.listing_events for pre-trigger history.
Tax reassessment forecast LA · Resets to sale price
- Current annual tax
- $821 · $68/mo
- Projected year-2 tax
- $880 · $73/mo
- Expected delta
- +$59/yr (+$5/mo · 7.3%)
ⓘ Screening estimate from a state-policy table — verify with the county assessor before closing.
Climate risk First Street
- Flood 1/10 Low FEMA zone X (unshaded) · 0% chance over 30 yrs
- Wildfire 3/10 Moderate
- Heat 9/10 Extreme 7 d/yr ≥109°F today · 20 d/yr by 30 yrs out
- Wind 9/10 Extreme 99% chance of damaging wind over 30 yrs
- Air quality 1/10 Low 0 unhealthy d/yr today · 0 by 30 yrs out
Nearby sold comps map
Loading sold comps map…
Walkable amenities ~0.75 mi
Loading nearby amenities…
Taxation est. · year 1
- Rental income
- $15,801
- − Mortgage interest
- −$8,962
- − Property taxes
- −$821
- − Insurance
- −$800
- − Repairs & maintenance
- −$1,264
- − Management
- −$1,264
- − Depreciation
- −$4,655
- Taxable loss
- −$1,965
- Est. tax savings @ 24.0%
- +$472
- After-tax cash flow
- $1,265/yr
For passive investors: Depreciation is non-cash, so a rental often shows a tax loss while cash-flowing — sheltering income. Rental losses are passive: they offset passive income freely, and up to $25,000/yr can offset ordinary (W-2) income if you actively participate and your MAGI is under $100k (phasing out to $0 by $150k); unused losses carry forward. On sale, claimed depreciation is recaptured at up to 25%, and gains may owe capital-gains tax (a 1031 exchange can defer both). Figures are a year-1 estimate at your 24.0% rate — not tax advice; consult a CPA.
Schools (NCES district)
- District
- Acadia Parish
- NCES district ID
- 2200030
- Math proficiency
- 32% ▼ -39.00%
- Reading proficiency
- 44% ▼ -32.00%
- Median HH income
- $38,012
- Composite
- 31.65/100
- National rank
- #5929
- State rank
- #28 of 98 in LA
Livability — Rayne
- Score
- 75/100
- State rank
- #18
- US rank
- #3895
Category grades
Schools grade is shown separately in the Schools card above.
Census & demographics
- Census place
- Rayne, LA
- City population
- 16,279
- Population (ZIP)
- 16,279
Population outlook (Acadia County) Hauer SSP2
- Today (2025)
- 63,846 people
- By 2030
- 64,141 · +0.5%
- By 2040
- 63,922 · +0.1%
- By 2050
- 62,263 · -2.5%
- By 2075
- 56,507 · -11.5%
- By 2100
- 46,316 · -27.5%
Race, ethnicity, and origin ACS 2023
- Neighborhood character
- Predominantly White (71%)
- Race & ethnicity
- White 71% Black 21% Two or more races 5% Hispanic / Latino 3%
- Common ancestry
- Lithuanian 15%
- Foreign-born
- 0%
- Languages at home
- 91% English-only · French/Haitian/Cajun 8% Spanish 1%
Political lean MEDSL · Acadia
- 2024 margin
- Solid R (+64.0) · D 17.6% · R 81.5%
- 2008→2024 swing
- -18.3pp toward R · 2008: -45.7pp · 2024: -64.0pp
- All cycles
- 2024: R+64.0 2020: R+60.3 2016: R+56.7 2012: R+49.8 2008: R+45.7
Not yet ingested
- Civics
- —
Market trends
- HPI YoY
- ▼ -77.19%
- Current HPI
- 118.9619
- Rent YoY
- —
- Metro
- —
- State GDP YoY
- ▲ 3.29%
- F500 in state
- 10
Industry mix (Fortune 500 HQ in LA)
| Industry | F500 HQs | Revenue |
|---|---|---|
| Telecommunications | 2 | $23B |
|
||
| Utilities | 1 | $12B |
|
||
| Wholesale / Distribution | 1 | $5B |
|
||
| Advertising | 1 | $2B |
|
||
Price history
+86.0% since first listed3 events — show timeline
- 2026-05-05 Pending — AcadianaMLS
- 2026-04-30 Listed $160,000 AcadianaMLS
- 2026-03-09 Sold (Public Records) $86,000 Public Records
Property tax history
+0.5%/yrLatest (2025): $821 · +0.3% YoY. Source: county tax records.
Cash-flow waterfall
monthlySold comps — $/sqft
last 12 mo · ≤1 miLoading sold comps…