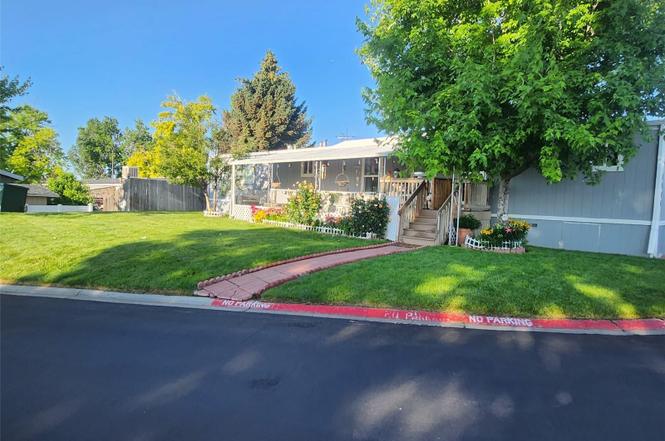
2900 Cascade Dr · Federal Heights, CO
Flood risk 1/10 · Minimal
- FEMA flood zone
- X (unshaded)
- Chance of flooding over 30 yrs
- 0.0%
- Est. flood insurance / yr
- $507 – $1,088
Fire risk 1/10 · Minimal
- Est. fire insurance / yr
- $939 – $1,743
Heat risk 3/10 · Minor
- Hot days now (above 92°F)
- 7 days/yr
- Hot days in 30 yrs
- 18 days/yr
Wind risk 2/10 · Minimal
- Chance of severe wind over 30 yrs
- —
Air-quality risk 4/10 · Minor
- Unhealthy air days now
- 6 days/yr
- Unhealthy air days in 30 yrs
- 8 days/yr
Risk factors via First Street. Map © Google.
Why this score? — see what drove the C+ grade
The composite is a weighted blend of 9 inputs, each scored 0–100. Each bar is that input's sub-score; the figure is the points it added to the 100-point composite (weight × sub-score).
- Cash flow +30.0/30.0
- 1% rule +10.0/10.0
- DSCR +10.0/10.0
- Livability +3.8/5.0
- Schools +3.5/10.0
- Rent growth +2.7/5.0
- Condition / age +2.5/5.0
- ARV discount +0.0/15.0
- Appreciation +0.0/10.0
$75,000
🖨 Deal sheet 📄 Offer letter ✓ Due diligence
Listing remarks
Welcome to this well-maintained 2-bed, 2-bath home located in the Denver Cascade Mobile Home Park. This mobile home offers a comfortable and move-in-ready option with several recent updates that add both value and peace of mind. Recent improvements include a newer water heater, furnace and central A/C, updated flooring, fresh interior paint, and recently remodeled bathrooms. The layout is functional and inviting, with an open living space that flows nicely into the kitchen and dining areas, making it perfect for everyday living or entertaining. Outside, you’ll find easy access parking and a low-maintenance lifestyle within a well-established community. The current land lease includes
Key facts
- Newer furnace
- Newer central a/c
- Newer water heater
Tags
Property features AI
Finance
- HOA & community: Land lease in effect (monthly $1,295; lease expires December 31, 2026); Located in Denver Cascade park (lot #4)
Exterior
- Parking: 2 off-street parking spaces; Concrete parking surface
- Utilities: Public water; Community/public sewer; Electricity connected; Natural gas connected; Wired internet available
- Home design: Manufactured in park (Mobile Home); Individual ownership; Entry level: Main
- Construction: Frame construction with vinyl and wood siding; Shingle roof; Mobile home dimensions: 65 ft long x 14 ft wide; Aluminum skirting
- Exterior features: Covered front porch; Balcony
Interior
- Kitchen: Microwave; Oven; Refrigerator
- Bedrooms: 2 bedrooms (both on main level; one is a primary suite)
- Flooring: Laminate; Vinyl
- Bathrooms: 2 full bathrooms (both on main level)
- Heating & cooling: Forced air heating; Central air conditioning
- Interior features: Ceiling fan(s)
- Laundry & utility: Main level laundry
Neighborhood map
What this means for you Summary
Snapshot
- This is a 2-bed/2.0-bath manufactured listed at $75k.
Deal economics
- At list price, monthly cash flow is $849 ($10k/yr) — positive.
- The deal already cash-flows at list — no discount required.
- Meets the 1% rule at list price ($2k rent vs $75k).
- Recommended offer: $66k (12.0% below list) — sets the bar for market timing.
- Cap rate 19.9% vs local median 4.2% in Federal Heights — top-decile yield for the area; either an underpriced asset or a hidden risk that comps aren't pricing in. Stress-test before assuming the spread holds.
Location & tenants
- Location reads 76/100 on livability (#28 in CO, #3,380 nationally) — a middle-class / working-renter tenant base. Strengths: commute A+, cost of living A+, housing A+; Watch: health & safety D+, crime F.
- Adams 12 Five Star Schools (suburban): math 31% / reading 46% proficiency, ranked #26 of 86 in CO (top 30%) — families likely to look elsewhere, expect single-tenant / working-renter base with shorter leases.
- Zoned schools: Federal Heights Elementary School (math 2% / reading 8%, grade F, #958 of 966 statewide, top 100%, 414 students, 87% FRL); Northglenn Middle School (math 8% / reading 12%, grade F, #246 of 270 statewide, top 91%, 684 students, 85% FRL); Northglenn High School (math 16% / reading 38%, grade F, #257 of 381 statewide, top 68%, 1,959 students, 69% FRL) — zoned schools average 81% FRL vs 33% district-wide (47 pts higher); higher-poverty schools than district average — tighter screening recommended.
- Zoned-school proficiency averages 14% at this address vs 38% district-wide (-24 pts) — the specific schools serving this property underperform the Adams 12 Five Star Schools average; the district grade overstates school quality for this exact location.
- Market conditions: Rents flat; 138 active listings in the ZIP; 33 comparable units currently listed for rent nearby; rentals at typical pace (median 18d on market — plan ~3-4 weeks tenant-placement turnaround); 2,299 units permitted in Adams County in 2024 (343 in 5+ unit buildings).
- This rent runs 34% of the median local income ($62k/yr) — at the standard rent-burdened threshold; future hikes will face affordability resistance.
Forward outlook
- Local home prices are declining (-3.0%/yr); year-one equity from $519 of loan paydown is wiped out by about $2k of value loss. Plan a longer hold.
- Adams County population projected at +44% by 2050 — long-run rental-demand tailwind backs the buy-and-hold thesis.
- At projected returns (-3.0% appreciation + 0.8% rent growth), your $21k cash investment doubles in ~3 years — after that, you're playing with house money.
Negotiation context
- It's been on market 152 days — a 12% lower offer ($66k) is reasonable based on typical stale-listing flexibility.
- 2 sale attempts with the ask held roughly flat each time — persistent listings suggest the price (not the market) is what's stuck; bring a comps-based counter.
Questions for the listing agent
- It's been on market 152 days. Have you received any prior offers? Is the seller open to a 12% concession, seller financing, or rate buy-down credit?
- Built in 1971 — when were the roof, HVAC, electrical panel, plumbing, and water heater last replaced?
- Why hasn't it sold? Are there any deal-killer items the seller is aware of (foundation, flood, title, zoning, code violations)?
- Is there a deadline driving the sale (1031 exchange, divorce, estate, relocation)? That informs how much negotiation room exists.
- Schools are F-rated, which usually means shorter tenancies and higher turnover. Who's the typical renter profile here, and what's been the actual vacancy rate?
- Crime grade is F in this area — have there been break-ins, vandalism, or insurance claims at this property in the last 3 years? What carrier currently insures it and at what premium?
- What's the average days-on-market for RENTAL listings here right now (not sales)? A rising rental-DOM trend means longer vacancies and softer asking-rent achievability than the comps imply.
- What's the recent tenant-quality profile in this submarket — average credit score on applications, eviction rate, late-payment / NSF rate, and stable-employment percentage? A property-management company in the area should have these aggregated.
- How much new for-sale + rental construction is in the pipeline within 1–3 miles? Heavy new supply typically softens prices + rents 12–24 months out; constrained supply supports both.
Investment metrics
- 1% rule
- 2.31% ✓
- Cap rate
- 19.87%
- Cash-on-cash
- 48.50%
- DSCR
- 3.16
- GRM
- 3.6
CMA / ARV
- ARV (on-the-fly)
- $55,510
- Comps found
- 12
Show comp detail 12 sales within ~0.75 mi
| Address | Dist | Beds/Ba | Sqft | Sold | Price | $/sf | Match |
|---|---|---|---|---|---|---|---|
| 2810 Cascade Dr | 0.06mi | 3/2.0 (+1) | 952 (+5%) | 2mo | $65,000 | $68 | 83 |
| 2710 Warbler St | 0.24mi | 2/2.0 | 924 (+2%) | 5mo | $23,000 | $25 | 82 |
| 2820 Cascade Dr | 0.05mi | 2/2.0 | 840 (-8%) | 7mo | $75,000 | $89 | 79 |
| 9760 Peacock St | 0.13mi | 3/2.0 (+1) | 896 (-2%) | 9mo | $65,000 | $73 | 78 |
| 1801 W 92nd Ave | 0.69mi | 2/2.0 | 840 (-8%) | 1mo | $35,000 | $42 | 54 |
| 1801 W 92nd Ave #375 | 0.69mi | 2/— | 960 (+6%) | 11mo | $65,000 | $68 | 50 |
| 1801 W 92nd Ave #218 | 0.69mi | 2/2.0 | 1,024 (+12%) | 2mo | $33,000 | $32 | 45 |
| 1801 W 92nd Ave | 0.69mi | 2/2.0 | 1,024 (+12%) | 4mo | $55,000 | $54 | 44 |
| 1801 W 92nd Ave #229 | 0.69mi | 2/1.0 | 832 (-9%) | 8mo | $50,500 | $61 | 43 |
| 2551 W 92nd Ave | 0.46mi | 3/2.0 (+1) | 1,024 (+12%) | 12mo | $104,200 | $102 | 43 |
| 1801 W 92nd Ave | 0.69mi | 2/2.0 | 1,024 (+12%) | 5mo | $47,000 | $46 | 43 |
| 1801 W 92nd Ave #222 | 0.69mi | 3/— (+1) | 1,036 (+14%) | 10mo | $63,000 | $61 | 31 |
Match score weights: distance 35% · size 25% · config 20% · recency 20%. Top-matched comps best support the ARV.
Projected returns pro-forma
-3.0% appreciation · 0.77% rent growth · sell at horizon
- IRR
- 43.5%
- Equity multiple
- 2.82×
- Total profit
- $38,135
- Equity at exit
- $11,183
- IRR
- 48.5%
- Equity multiple
- 5.19×
- Total profit
- $88,019
- Equity at exit
- $6,485
Cash invested: $21,000 (down + closing). Projections, not guarantees.
Landlord ↔ Tenant lean methodology
- Overall (STATE)
- 38 Tenant-Leaning
- State Colorado
- 38 Tenant-Leaning · D+4
- County
- — inherits STATE
- City
- — inherits STATE
ZIP-level market 80260
- Rents YoY
- 0.8%
- Active inventory
- 138
- Price-to-rent
- 3.6×
Monthly cashflow live
- Estimated rent
- $1,731 high interval (Pro) →
- Mortgage (P&I)
- −$393
- Tax est. 1.5%
- −$94 /mo · $1,125/yr
- Insurance
- −$31
- HOA
- −$0
- Vacancy / Maint / Mgmt
- −$363
- Net cashflow
- $849
Break-even live
UW: 25.0% down · 7.5% · 30yr · 1.5% tax · 5.0% vac · 8.0% maint · 8.0% mgmt
Financing live
Cash to close
- Down payment
- $18,750
- Closing costs
- $2,250
- Reserves months
- —
- Total cash needed
- —
Loan-product check · same deal, 3 products live
Conventional
25% down · 7.5% · 30yr
- Down + closing
- —
- Monthly P&I
- —
- Monthly cashflow
- —
- DSCR
- —
- Eligible?
- —
Personal DTI + credit; lowest rate.
DSCR
20% down · 8.5% · 30yr
- Down + closing
- —
- Monthly P&I
- —
- Monthly cashflow
- —
- DSCR
- —
- Eligible?
- —
No personal income docs; deal must DSCR.
Hard money
10% down · 12.0% · 12mo
- Down + closing
- —
- Monthly P&I
- —
- Monthly cashflow
- —
- DSCR
- —
- Eligible?
- —
Short-term bridge; refi at stabilization.
Rent comps 33 comps
| Address | Beds | Baths | Sqft | Rent | $/sqft | DOM | Units | Dist |
|---|---|---|---|---|---|---|---|---|
| 3323 W 96th Cir Westminster, CO | 1.0–3.0 | 1.0–3.0 | 1190 | $2,510 | $2.11 | 2d | 21 | 0.47mi |
| 1801 W 92nd Ave #754 Denver, CO | 3.0 | 2.0 | 1123 | $1,995 | $1.78 | 5d | 1 | 0.70mi |
| 2700 W 103rd Ave Denver, CO | 1.0–2.0 | 1.0–2.0 | 729 | $1,970 | $2.70 | 2d | 13 | 0.70mi |
| 9151 Fontaine St Denver, CO | 2.0 | 1.0 | 700 | $1,313 | $1.88 | 2d | 1 | 0.72mi |
| 10251 Zuni St Denver, CO | 1.0–2.0 | 1.0–2.0 | 800 | $1,724 | $2.15 | 1d | 16 | 0.74mi |
| 9081 Federal Blvd Westminster, CO | 2.0 | 1.0 | 855 | $1,466 | $1.72 | 2d | 3 | 0.76mi |
| 9050 N Elm Ct Unit 1 Federal Heights, CO | 2.0 | 1.0 | 912 | $1,745 | $1.91 | 5d | 1 | 0.80mi |
| 10211 Ura Ln Thornton, CO | 1.0–2.0 | 1.0 | 709 | $1,325 | $1.87 | 16d | 3 | 0.83mi |
| 8865 Federal Blvd #202 Denver, CO | 2.0 | 1.0 | 1067 | $1,700 | $1.59 | 11d | 1 | 1.02mi |
| 8943 Mccoy Pl Westminster, CO | 2.0 | 1.0 | 850 | $1,550 | $1.82 | 18d | 1 | 1.25mi |
| 8918 Mccoy Pl Unit 8906 Westminster, CO | 2.0 | 1.0 | 800 | $1,400 | $1.75 | 5d | 1 | 1.25mi |
| 8670 Clay St Unit 7309 Westminster, CO | 2.0 | 2.0 | 951 | $1,761 | $1.85 | 24d | 1 | 1.26mi |
| 8670 Clay St Unit 5201 Westminster, CO | 3.0 | 2.0 | 1110 | $2,550 | $2.30 | 24d | 1 | 1.26mi |
| 8670 Clay St Unit 6301 Westminster, CO | 3.0 | 2.0 | 1110 | $2,325 | $2.09 | 24d | 1 | 1.26mi |
| 8670 Clay St Unit 5309 Westminster, CO | 2.0 | 2.0 | 1111 | $2,206 | $1.99 | 24d | 1 | 1.26mi |
| 8670 Clay St Unit 4312 Westminster, CO | 2.0 | 1.0 | 1038 | $1,891 | $1.82 | 24d | 1 | 1.26mi |
| 8670 Clay St Unit 5107 Westminster, CO | 2.0 | 2.0 | 951 | $1,891 | $1.99 | 24d | 1 | 1.26mi |
| 8670 Clay St Unit 7220 Westminster, CO | 2.0 | 1.0 | 1038 | $1,761 | $1.70 | 24d | 1 | 1.26mi |
| 8670 Clay St Unit 4306 Westminster, CO | 1.0 | 1.0 | 808 | $1,576 | $1.95 | 24d | 1 | 1.26mi |
| 8670 Clay St Unit 4211 Westminster, CO | 3.0 | 2.0 | 1110 | $2,186 | $1.97 | 24d | 1 | 1.26mi |
| 8670 Clay St Unit 7219 Westminster, CO | 3.0 | 2.0 | 1110 | $2,373 | $2.14 | 24d | 1 | 1.27mi |
| 8670 Clay St Unit 7313 Westminster, CO | 1.0 | 1.0 | 808 | $1,839 | $2.28 | 24d | 1 | 1.27mi |
| 8670 Clay St Unit 7317 Westminster, CO | 2.0 | 2.0 | 1111 | $2,054 | $1.85 | 24d | 1 | 1.27mi |
| 8670 Clay St Unit 5307 Westminster, CO | 2.0 | 2.0 | 951 | $1,891 | $1.99 | 5d | 1 | 1.27mi |
| 8654 Decatur St #237 Westminster, CO | 1.0 | 1.0 | 888 | $1,450 | $1.63 | 11d | 1 | 1.28mi |
| 8635 Clay St Westminster, CO | 1.0 | 1.0 | 829 | $1,400 | $1.69 | 14d | 1 | 1.31mi |
| 4901 W 93rd Ave Westminster, CO | 1.0–2.0 | 1.0–2.0 | 981 | $2,333 | $2.38 | 1d | 24 | 1.37mi |
| 2740 W 86th Ave Westminster, CO | 2.0 | 1.0 | 1000 | $1,565 | $1.56 | 2d | 2 | 1.39mi |
| 747 W 96th Ave Denver, CO | 3.0 | 1.0 | 864 | $1,395 | $1.61 | 24d | 1 | 1.40mi |
| 747 W 96th Ave Denver, CO | 3.0 | 1.0 | 864 | $1,395 | $1.61 | 5d | 1 | 1.40mi |
| 9189 Gale Blvd Thornton, CO | 1.0–3.0 | 1.0–2.0 | 755 | $1,449 | $1.92 | 24d | 1 | 1.41mi |
| 707 W 96th Ave Thornton, CO | 3.0 | 1.0 | 859 | $1,350 | $1.57 | 24d | 1 | 1.42mi |
| 950 W 103rd Pl Northglenn, CO | 2.0 | 1.0 | 820 | $1,399 | $1.71 | 24d | 3 | 1.47mi |
Listing history 17 events
-
2026-06-18days on market $75,000 Active 152 DOM
-
2026-06-17days on market $75,000 Active 151 DOM
-
2026-06-16days on market $75,000 Active 150 DOM
-
2026-06-15days on market $75,000 Active 149 DOM
-
2026-06-13days on market $75,000 Active 147 DOM
-
2026-06-13days on market $75,000 Active 146 DOM
-
2026-06-09days on market $75,000 Active 143 DOM
-
2026-06-08days on market $75,000 Active 142 DOM
-
2026-06-07days on market $75,000 Active 141 DOM
-
2026-06-04days on market $75,000 Active 138 DOM
-
2026-06-03days on market $75,000 Active 137 DOM
-
2026-06-02days on market $75,000 Active 136 DOM
-
2026-06-01days on market $75,000 Active 135 DOM
-
2026-05-31days on market $75,000 Active 134 DOM
-
2026-03-18status Active
-
2026-03-11status Pending Accepting Backup Offers
-
2026-01-10$75,000 Active
ⓘ Source: listings_history table (triggers on properties + properties_extension) + one-shot
backfill from property_details.listing_events for pre-trigger history.
Climate risk First Street
- Flood 1/10 Low FEMA zone X (unshaded) · 0% chance over 30 yrs
- Wildfire 1/10 Low
- Heat 3/10 Moderate 7 d/yr ≥92°F today · 18 d/yr by 30 yrs out
- Wind 2/10 Low
- Air quality 4/10 Moderate 6 unhealthy d/yr today · 8 by 30 yrs out
Nearby sold comps map
Loading sold comps map…
Walkable amenities ~0.75 mi
Loading nearby amenities…
Taxation est. · year 1
- Rental income
- $20,766
- − Mortgage interest
- −$4,201
- − Property taxes
- −$1,125
- − Insurance
- −$375
- − Repairs & maintenance
- −$1,661
- − Management
- −$1,661
- − Depreciation
- −$2,182
- Taxable income
- $9,561
- Est. tax owed @ 24.0%
- −$2,295
- After-tax cash flow
- $7,891/yr
For passive investors: Depreciation is non-cash, so a rental often shows a tax loss while cash-flowing — sheltering income. Rental losses are passive: they offset passive income freely, and up to $25,000/yr can offset ordinary (W-2) income if you actively participate and your MAGI is under $100k (phasing out to $0 by $150k); unused losses carry forward. On sale, claimed depreciation is recaptured at up to 25%, and gains may owe capital-gains tax (a 1031 exchange can defer both). Figures are a year-1 estimate at your 24.0% rate — not tax advice; consult a CPA.
Schools (NCES district)
- District
- Adams 12 Five Star Schools
- NCES district ID
- 0806900
- Math proficiency
- 31% ▼ -4.00%
- Reading proficiency
- 46% ▬ 0.00%
- Median HH income
- $67,478
- Composite
- 34.87/100
- National rank
- #5086
- State rank
- #26 of 86 in CO
Livability — Federal Heights
- Score
- 76/100
- State rank
- #28
- US rank
- #3380
Category grades
Schools grade is shown separately in the Schools card above.
Census & demographics
- Census place
- Federal Heights, CO
- County
- Adams County · 464,133 people
- City population
- 34,677
- Metro
- Denver-Aurora-Lakewood, CO
- Population (ZIP)
- 34,677
- Household income
- $61,852
- Rent vs Own
- Severe rent burden
- 1521.0
Population outlook (Adams County) Hauer SSP2
- Today (2025)
- 598,184 people
- By 2030
- 651,880 · +9.0%
- By 2040
- 759,778 · +27.0%
- By 2050
- 862,889 · +44.3%
- By 2075
- 1,085,994 · +81.5%
- By 2100
- 1,211,318 · +102.5%
Race, ethnicity, and origin ACS 2023
- Neighborhood character
- Majority Hispanic (61%)
- Race & ethnicity
- Hispanic / Latino 61% White 30% Two or more races 26% Asian 3% Black 3%
- Hispanic origin (detail)
- Mexican 51%
- Common ancestry
- Romanian 1% Slovak 1% Italian 1%
- Foreign-born
- 25% · Canada, Vietnam, China
- Languages at home
- 53% English-only · Spanish 42% Other Asian/Pacific 2% Other Indo-European 1%
Political lean MEDSL · Adams
- 2024 margin
- Lean D (+9.0) · D 53.2% · R 44.1% · Other 2.7%
- 2008→2024 swing
- -9.3pp toward R · 2008: 18.4pp · 2024: 9.0pp
- All cycles
- 2024: D+9.0 2020: D+16.3 2016: D+7.2 2012: D+15.1 2008: D+18.4
Not yet ingested
- Civics
- —
Market trends
- HPI YoY
- ▼ -260.84%
- Current HPI
- 285.4552
- Rent YoY
- ▲ 0.77%
- Metro
- Denver-Aurora-Lakewood, CO
- State GDP YoY
- ▲ 1.95%
- F500 in state
- 14
Industry mix (Fortune 500 HQ in CO)
| Industry | F500 HQs | Revenue |
|---|---|---|
| Technology Distribution | 1 | $31B |
|
||
| Food / Agriculture | 1 | $18B |
|
||
| Packaging | 1 | $14B |
|
||
| Healthcare | 1 | $13B |
|
||
| Energy | 1 | $10B |
|
||
| Technology | 1 | $4B |
|
||
Price history
3 events — show timeline
- 2026-03-18 Relisted — REColorado as Distributed by MLS Grid
- 2026-03-11 Pending — REColorado as Distributed by MLS Grid
- 2026-01-10 Listed $75,000 REColorado as Distributed by MLS Grid
Cash-flow waterfall
monthlySold comps — $/sqft
last 12 mo · ≤1 miLoading sold comps…