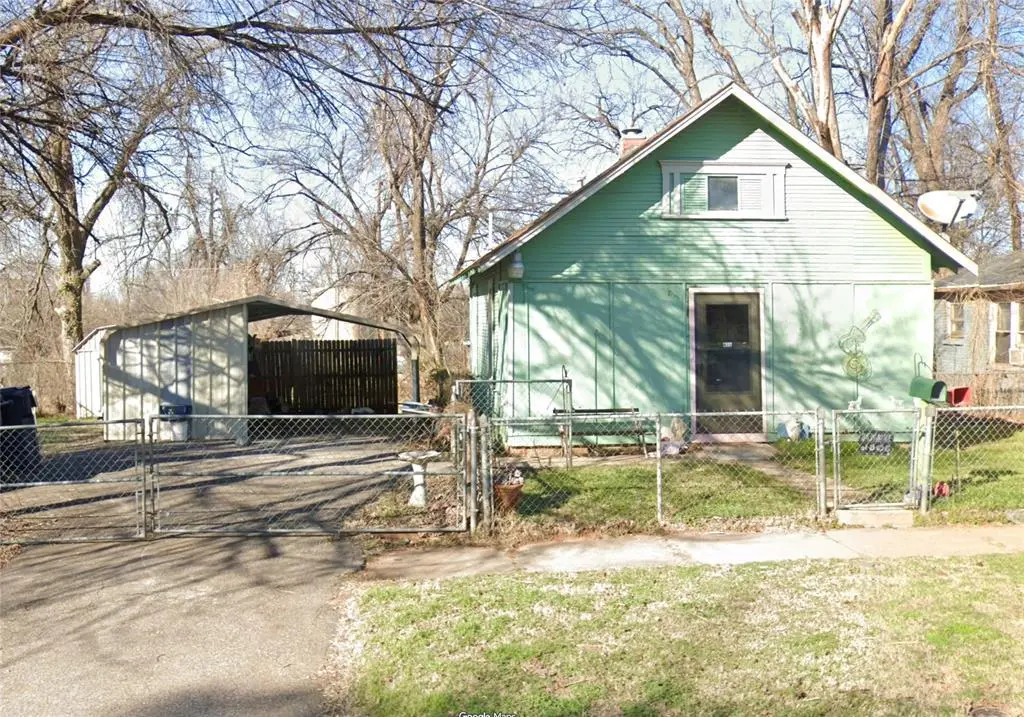
415 SE 23rd St · Oklahoma City, OK
Flood risk 1/10 · Minimal
- FEMA flood zone
- X (unshaded)
- Chance of flooding over 30 yrs
- 0.0%
- Est. flood insurance / yr
- $507 – $1,088
Fire risk 1/10 · Minimal
- Est. fire insurance / yr
- $2,463 – $4,575
Heat risk 6/10 · Moderate
- Hot days now (above 107°F)
- 7 days/yr
- Hot days in 30 yrs
- 19 days/yr
Wind risk 2/10 · Minimal
- Chance of severe wind over 30 yrs
- 4.0%
Air-quality risk 1/10 · Minimal
- Unhealthy air days now
- 0 days/yr
- Unhealthy air days in 30 yrs
- 0 days/yr
Risk factors via First Street. Map © Google.
Why this score? — see what drove the B grade
The composite is a weighted blend of 9 inputs, each scored 0–100. Each bar is that input's sub-score; the figure is the points it added to the 100-point composite (weight × sub-score).
- Cash flow +30.0/30.0
- DSCR +10.0/10.0
- 1% rule +9.8/10.0
- ARV discount +8.5/15.0
- Appreciation +5.9/10.0
- Livability +4.0/5.0
- Rent growth +2.5/5.0
- Condition / age +2.5/5.0
- Schools +0.7/10.0
$70,000
🖨 Deal sheet 📄 Offer letter ✓ Due diligence
Listing remarks MLS
Investor Special on Oversized Lot! This property is a true fixer-upper with incredible potential for the right buyer. Situated on a spacious double lot, it offers endless opportunities for renovation, expansion, or redevelopment. Ideal for investors, flippers, or builders, this is your chance to add value and bring your vision to life. With its generous lot size and convenient Oklahoma City location, the possibilities are there. Sold as-is. Great opportunity—don’t miss out!
Key facts
- Oversized lot
- 5,179 sq ft lot
- Built 1930
Tags
Neighborhood map
What this means for you Summary
Snapshot
- This is a 2-bed/1.0-bath single-family listed at $70k.
Deal economics
- At list price, monthly cash flow is $334 ($4k/yr) — positive.
- The deal already cash-flows at list — no discount required.
- Meets the 1% rule at list price ($1k rent vs $70k).
- Recommended offer: $66k (6.0% below list) — sets the bar for market timing.
- Cap rate 12.0% vs local median 3.7% in Oklahoma City — top-decile yield for the area; either an underpriced asset or a hidden risk that comps aren't pricing in. Stress-test before assuming the spread holds.
Location & tenants
- Location reads 80/100 on livability (#3 in OK, #1,635 nationally) — a professional / high-income tenant draw. Strengths: amenities A+, commute A+, cost of living A+; Watch: schools F, crime F.
- Oklahoma City (urban): math 7% / reading 10% proficiency, ranked #254 of 270 in OK (top 94%) — low school quality limits family demand, transient renter base, plan for 1-2y turnover; 82% free/reduced lunch — lower-income household profile, screen leases tightly.
- Market conditions: 83 active listings in the ZIP; 24 comparable units currently listed for rent nearby; rentals lingering (median 44d on market — plan ~5-8 weeks vacancy on turnover, expect pricing pressure); 54% of comp listings sitting > 30 days — soft ceiling on asking rent; 5,365 units permitted in Oklahoma County in 2024 (569 in 5+ unit buildings).
Forward outlook
- In year one you build about $2k of equity ($484 loan paydown + $1k appreciation (1.8% local appreciation)).
- Oklahoma County population projected at +41% by 2050 — long-run rental-demand tailwind backs the buy-and-hold thesis.
- At projected returns (1.8% appreciation + 3.0% rent growth), your $20k cash investment doubles in ~4 years — after that, you're playing with house money.
Negotiation context
- It's been on market 64 days — a 6% lower offer ($66k) is reasonable based on typical stale-listing flexibility.
- Current owner paid $10k; list at $70k implies a 600% gain — meaningful room to come down on a strong offer.
Risks & watch-outs
- Watch-outs: built in 1930 — expect roof / HVAC / electrical / plumbing capex.
- Climate carrying-cost: extreme-heat days projected 7→19/yr by 2055 (HVAC capex compounding) — expect insurance premiums to compound above CPI over the hold.
Questions for the listing agent
- It's been on market 64 days. Have you received any prior offers? Is the seller open to a 6% concession, seller financing, or rate buy-down credit?
- Built in 1930 — when were the roof, HVAC, electrical panel, plumbing, and water heater last replaced?
- Why hasn't it sold? Are there any deal-killer items the seller is aware of (foundation, flood, title, zoning, code violations)?
- Is there a deadline driving the sale (1031 exchange, divorce, estate, relocation)? That informs how much negotiation room exists.
- Schools are F-rated, which usually means shorter tenancies and higher turnover. Who's the typical renter profile here, and what's been the actual vacancy rate?
- Crime grade is F in this area — have there been break-ins, vandalism, or insurance claims at this property in the last 3 years? What carrier currently insures it and at what premium?
- What's the average days-on-market for RENTAL listings here right now (not sales)? A rising rental-DOM trend means longer vacancies and softer asking-rent achievability than the comps imply.
- What's the recent tenant-quality profile in this submarket — average credit score on applications, eviction rate, late-payment / NSF rate, and stable-employment percentage? A property-management company in the area should have these aggregated.
- How much new for-sale + rental construction is in the pipeline within 1–3 miles? Heavy new supply typically softens prices + rents 12–24 months out; constrained supply supports both.
Investment metrics
- 1% rule
- 1.48% ✓
- Cap rate
- 12.02%
- Cash-on-cash
- 20.47%
- DSCR
- 1.91
- GRM
- 5.6
CMA / ARV
- ARV (median comp)
- $71,592
- List price
- $70,000
- Delta
- -2.22%
- Verdict
- FAIR
- Comps
- 20 within 1.0 mi
Show comp detail 12 sales within ~0.75 mi
| Address | Dist | Beds/Ba | Sqft | Sold | Price | $/sf | Match |
|---|---|---|---|---|---|---|---|
| 414 SE 24th St | 0.10mi | 2/1.0 | 860 (+2%) | 16mo | $89,000 | $103 | 79 |
| 640 SE 20th St | 0.30mi | 2/1.0 | 816 (-3%) | 5mo | $104,000 | $127 | 77 |
| 420 SE 22nd St | 0.07mi | 2/1.0 | 918 (+9%) | 8mo | $45,000 | $49 | 75 |
| 206 SE 25th St | 0.28mi | 2/1.0 | 884 (+5%) | 6mo | $34,000 | $38 | 74 |
| 404 SE 17th St | 0.41mi | 3/1.0 (+1) | 912 (+8%) | 11mo | $146,900 | $161 | 53 |
| 717 SE 31st St | 0.65mi | 2/1.0 | 770 (-9%) | 7mo | $54,900 | $71 | 49 |
| 1912 S High Ave | 0.63mi | 2/1.0 | 768 (-9%) | 12mo | $110,000 | $143 | 45 |
| 117 SW 26th St | 0.65mi | 2/1.0 | 764 (-10%) | 11mo | $136,475 | $179 | 44 |
| 716 SE 31st St | 0.67mi | 3/1.0 (+1) | 864 (+2%) | 19mo | $123,000 | $142 | 44 |
| 720 SE 31st St | 0.68mi | 2/1.0 | 960 (+14%) | 9mo | $80,000 | $83 | 38 |
| 1929 S Stonewall Ave | 0.65mi | 2/1.0 | 720 (-15%) | 14mo | $100,000 | $139 | 34 |
| 21 SW 23rd St | 0.53mi | 3/1.0 (+1) | 966 (+14%) | 17mo | $85,000 | $88 | 32 |
Match score weights: distance 35% · size 25% · config 20% · recency 20%. Top-matched comps best support the ARV.
Projected returns pro-forma
1.75% appreciation · 3.0% rent growth · sell at horizon
- IRR
- 24.2%
- Equity multiple
- 2.29×
- Total profit
- $25,215
- Equity at exit
- $26,657
- IRR
- 26.2%
- Equity multiple
- 4.36×
- Total profit
- $65,884
- Equity at exit
- $37,667
Cash invested: $19,600 (down + closing). Projections, not guarantees.
Landlord ↔ Tenant lean methodology
- Overall (STATE)
- 83 Strongly Landlord-Friendly
- State Oklahoma
- 83 Strongly Landlord-Friendly · R+20
- County
- — inherits STATE
- City
- — inherits STATE
ZIP-level market 73129
- Home prices YoY
- 0.7%
- Active inventory
- 83
- Price-to-rent
- 5.6×
Monthly cashflow live
- Estimated rent
- $1,036 high interval (Pro) →
- Mortgage (P&I)
- −$367
- Tax est. 1.5%
- −$88 /mo · $1,050/yr
- Insurance
- −$29
- HOA
- −$0
- Vacancy / Maint / Mgmt
- −$217
- Net cashflow
- $334
Break-even live
UW: 25.0% down · 7.5% · 30yr · 1.5% tax · 5.0% vac · 8.0% maint · 8.0% mgmt
Financing live
Cash to close
- Down payment
- $17,500
- Closing costs
- $2,100
- Reserves months
- —
- Total cash needed
- —
Loan-product check · same deal, 3 products live
Conventional
25% down · 7.5% · 30yr
- Down + closing
- —
- Monthly P&I
- —
- Monthly cashflow
- —
- DSCR
- —
- Eligible?
- —
Personal DTI + credit; lowest rate.
DSCR
20% down · 8.5% · 30yr
- Down + closing
- —
- Monthly P&I
- —
- Monthly cashflow
- —
- DSCR
- —
- Eligible?
- —
No personal income docs; deal must DSCR.
Hard money
10% down · 12.0% · 12mo
- Down + closing
- —
- Monthly P&I
- —
- Monthly cashflow
- —
- DSCR
- —
- Eligible?
- —
Short-term bridge; refi at stabilization.
Rent comps 24 comps
| Address | Beds | Baths | Sqft | Rent | $/sqft | DOM | Units | Dist |
|---|---|---|---|---|---|---|---|---|
| 317 SE 24th St Oklahoma City, OK | 2.0 | 1.0 | 917 | $950 | $1.04 | 4d | 1 | 0.14mi |
| 526 SE 21st St Oklahoma City, OK | 3.0 | 1.0 | 1054 | $1,150 | $1.09 | 4d | 1 | 0.15mi |
| 407 SE 25th St Oklahoma City, OK | 3.0 | 1.0 | 896 | $1,275 | $1.42 | 44d | 1 | 0.17mi |
| 630 SE 21st St Oklahoma City, OK | 3.0 | 2.0 | 1000 | $1,095 | $1.09 | 43d | 1 | 0.22mi |
| 726 SE 20th St Oklahoma City, OK | 2.0 | 1.0 | 672 | $1,095 | $1.63 | 43d | 1 | 0.36mi |
| 115 SW 23rd St Oklahoma City, OK | 1.0 | 1.0 | 750 | $575 | $0.77 | 16d | 1 | 0.62mi |
| 116 SW 23rd St Oklahoma City, OK | 1.0 | 1.0 | 700 | $650 | $0.93 | 43d | 1 | 0.63mi |
| 709 SE 10th St Oklahoma City, OK | 2.0 | 1.0 | 864 | $995 | $1.15 | 4d | 1 | 0.91mi |
| 316 SW 27th St Unit 4 Oklahoma City, OK | 1.0 | 1.0 | 615 | $679 | $1.10 | 11d | 1 | 0.92mi |
| 316 SW 27th St Unit 8 Oklahoma City, OK | 1.0 | 1.0 | 615 | $679 | $1.10 | 43d | 1 | 0.92mi |
| 404 SW 26th St Unit 6 Oklahoma City, OK | 1.0 | 1.0 | 600 | $645 | $1.07 | 11d | 1 | 0.96mi |
| 3312 S Harvey Ave Oklahoma City, OK | 2.0 | 1.0 | 840 | $1,100 | $1.31 | 20d | 1 | 1.06mi |
| 540 SW 24th St #3 Oklahoma City, OK | 1.0 | 1.0 | 726 | $625 | $0.86 | 43d | 1 | 1.10mi |
| 220 SW 34th St Oklahoma City, OK | 1.0 | 1.0 | 625 | $725 | $1.16 | 43d | 1 | 1.11mi |
| 4101 S Shields Blvd Apt 3B Oklahoma City, OK | 3.0 | 2.0 | 957 | $1,025 | $1.07 | 4d | 1 | 1.25mi |
| 4101 S Shields Blvd Unit Shields 3B Oklahoma City, OK | 3.0 | 2.0 | 957 | $1,050 | $1.10 | 23d | 1 | 1.25mi |
| 3407 S Lee Ave Oklahoma City, OK | 2.0 | 1.0 | 900 | $980 | $1.09 | 43d | 1 | 1.36mi |
| 3913 S Harvey Ave Unit 2 Oklahoma City, OK | 1.0 | 1.0 | 568 | $900 | $1.58 | 43d | 1 | 1.37mi |
| 109 SE 42nd St Apt A Oklahoma City, OK | 2.0 | 1.0 | 800 | $799 | $1.00 | 17d | 1 | 1.37mi |
| 101 SE 42nd St Unit B Oklahoma City, OK | 2.0 | 1.0 | 740 | $645 | $0.87 | 43d | 1 | 1.38mi |
| 3906 S Hudson Ave Oklahoma City, OK | 1.0 | 1.0 | 700 | $750 | $1.07 | 23d | 1 | 1.40mi |
| 3618 S Lee Ave Oklahoma City, OK | 1.0 | 1.0 | 760 | $850 | $1.12 | 43d | 1 | 1.43mi |
| 3616 S Lee Ave Oklahoma City, OK | 1.0 | 1.0 | 760 | $775 | $1.02 | 43d | 1 | 1.43mi |
| 1413 SE 39th St Oklahoma City, OK | 3.0 | 1.0 | 1004 | $1,125 | $1.12 | 43d | 1 | 1.47mi |
Listing history 16 events
-
2026-06-18days on market $70,000 Active 64 DOM
-
2026-06-17days on market $70,000 Active 63 DOM
-
2026-06-16days on market $70,000 Active 62 DOM
-
2026-06-15days on market $70,000 Active 61 DOM
-
2026-06-13pricedays on market $70,000 Active 59 DOM
-
2026-06-09days on market $74,900 Active 55 DOM
-
2026-06-08days on market $74,900 Active 54 DOM
-
2026-06-07days on market $74,900 Active 53 DOM
-
2026-06-05days on market $74,900 Active 50 DOM
-
2026-06-03days on market $74,900 Active 49 DOM
-
2026-06-02days on market $74,900 Active 48 DOM
-
2026-06-01days on market $74,900 Active 47 DOM
-
2026-05-31days on market $74,900 Active 46 DOM
-
2026-05-18price $74,900 490-char remark
Show marketing remark (490 chars)
Investor Special on Oversized Lot! This property is a true fixer-upper with incredible potential for the right buyer. Situated on a spacious double lot, it offers endless opportunities for renovation, expansion, or redevelopment. Ideal for investors, flippers, or builders, this is your chance to add value and bring your vision to life. With its generous lot size and convenient Oklahoma City location, the possibilities are there. Sold as-is. Great opportunity—don’t miss out!
-
2026-04-15$79,900 Active 490-char remark
Show marketing remark (490 chars)
Investor Special on Oversized Lot! This property is a true fixer-upper with incredible potential for the right buyer. Situated on a spacious double lot, it offers endless opportunities for renovation, expansion, or redevelopment. Ideal for investors, flippers, or builders, this is your chance to add value and bring your vision to life. With its generous lot size and convenient Oklahoma City location, the possibilities are there. Sold as-is. Great opportunity—don’t miss out!
-
1981-03-01soldstatus $10,000
ⓘ Source: listings_history table (triggers on properties + properties_extension) + one-shot
backfill from property_details.listing_events for pre-trigger history.
Climate risk First Street
- Flood 1/10 Low FEMA zone X (unshaded) · 0% chance over 30 yrs
- Wildfire 1/10 Low
- Heat 6/10 Major 7 d/yr ≥107°F today · 19 d/yr by 30 yrs out
- Wind 2/10 Low 4% chance of damaging wind over 30 yrs
- Air quality 1/10 Low 0 unhealthy d/yr today · 0 by 30 yrs out
Nearby sold comps map
Loading sold comps map…
Walkable amenities ~0.75 mi
Loading nearby amenities…
Taxation est. · year 1
- Rental income
- $12,427
- − Mortgage interest
- −$3,921
- − Property taxes
- −$1,050
- − Insurance
- −$350
- − Repairs & maintenance
- −$994
- − Management
- −$994
- − Depreciation
- −$2,036
- Taxable income
- $3,081
- Est. tax owed @ 24.0%
- −$740
- After-tax cash flow
- $3,273/yr
For passive investors: Depreciation is non-cash, so a rental often shows a tax loss while cash-flowing — sheltering income. Rental losses are passive: they offset passive income freely, and up to $25,000/yr can offset ordinary (W-2) income if you actively participate and your MAGI is under $100k (phasing out to $0 by $150k); unused losses carry forward. On sale, claimed depreciation is recaptured at up to 25%, and gains may owe capital-gains tax (a 1031 exchange can defer both). Figures are a year-1 estimate at your 24.0% rate — not tax advice; consult a CPA.
Schools (NCES district)
- District
- Oklahoma City
- NCES district ID
- 4022770
- Math proficiency
- 7% ▼ -5.00%
- Reading proficiency
- 10% ▼ -6.00%
- Median HH income
- $35,606
- Composite
- 7.0/100
- National rank
- #9970
- State rank
- #254 of 270 in OK
Livability — Oklahoma City
- Score
- 80/100
- State rank
- #3
- US rank
- #1635
Category grades
Schools grade is shown separately in the Schools card above.
Census & demographics
- Census place
- Oklahoma City, OK
- County
- Oklahoma County · 771,644 people
- City population
- 498,656
- Metro
- Oklahoma City, OK
- Population (ZIP)
- 20,014
- Household income
- $46,670
- Rent vs Own
- Severe rent burden
- 611.0
Population outlook (Oklahoma County) Hauer SSP2
- Today (2025)
- 911,875 people
- By 2030
- 982,413 · +7.7%
- By 2040
- 1,130,468 · +24.0%
- By 2050
- 1,288,422 · +41.3%
- By 2075
- 1,711,482 · +87.7%
- By 2100
- 2,088,448 · +129.0%
Race, ethnicity, and origin ACS 2023
- Neighborhood character
- Diverse neighborhood (Simpson 0.61)
- Race & ethnicity
- Hispanic / Latino 57% Two or more races 26% White 26% Black 9% Native American 7% Asian 1%
- Hispanic origin (detail)
- Mexican 53%
- Common ancestry
- Italian 1% Lithuanian 1% Slovak 1%
- Foreign-born
- 24% · Canada, Dominican Republic
- Languages at home
- 54% English-only · Spanish 44% Other Asian/Pacific 1% Vietnamese 1%
Political lean MEDSL · Oklahoma
- 2024 margin
- Toss-up / Even · D 48.0% · R 49.7% · Other 2.3%
- 2008→2024 swing
- +15.1pp toward D · 2008: -16.8pp · 2024: -1.7pp
- All cycles
- 2024: R+1.7 2020: R+1.1 2016: R+10.5 2012: R+16.7 2008: R+16.8
Not yet ingested
- Civics
- —
Market trends
- HPI YoY
- ▲ 1.75%
- Current HPI
- 250.8581
- Rent YoY
- —
- Metro
- Oklahoma City, OK
- State GDP YoY
- ▲ 1.55%
- F500 in state
- 6
Industry mix (Fortune 500 HQ in OK)
| Industry | F500 HQs | Revenue |
|---|---|---|
| Energy | 3 | $48B |
|
||
Price history
+649.0% since first listed3 events — show timeline
- 2026-05-18 Price Changed $74,900 MLSOK
- 2026-04-15 Listed $79,900 MLSOK
- 1981-03-01 Sold (Public Records) $10,000 Public Records
Property tax history
+25.2%/yrLatest (2025): $135 · +1307.6% YoY. Source: county tax records.
Cash-flow waterfall
monthlySold comps — $/sqft
last 12 mo · ≤1 miLoading sold comps…