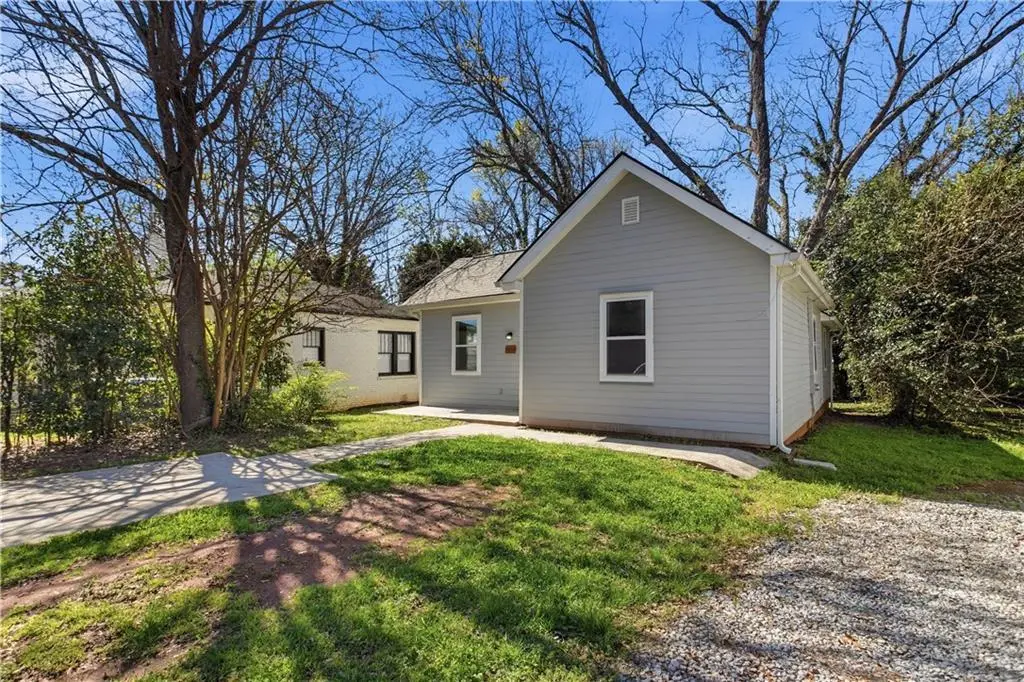
145 Mcdonough Blvd SE · Atlanta, GA
Flood risk 1/10 · Minimal
- FEMA flood zone
- X (unshaded)
- Chance of flooding over 30 yrs
- 0.0%
- Est. flood insurance / yr
- $473 – $860
Fire risk 1/10 · Minimal
- Est. fire insurance / yr
- $963 – $1,789
Heat risk 5/10 · Moderate
- Hot days now (above 105°F)
- 7 days/yr
- Hot days in 30 yrs
- 18 days/yr
Wind risk 6/10 · Moderate
- Chance of severe wind over 30 yrs
- 27.0%
Air-quality risk 4/10 · Minor
- Unhealthy air days now
- 4 days/yr
- Unhealthy air days in 30 yrs
- 6 days/yr
Risk factors via First Street. Map © Google.
Why this score? — see what drove the D grade
The composite is a weighted blend of 9 inputs, each scored 0–100. Each bar is that input's sub-score; the figure is the points it added to the 100-point composite (weight × sub-score).
- ARV discount +15.0/15.0
- Cash flow +8.7/30.0
- Livability +4.2/5.0
- 1% rule +3.3/10.0
- Rent growth +3.3/5.0
- Schools +2.7/10.0
- Condition / age +2.5/5.0
- DSCR +2.4/10.0
- Appreciation +0.0/10.0
$199,000
🖨 Deal sheet 📄 Offer letter ✓ Due diligence
Listing remarks MLS
Welcome to this well-situated single-family home in southeast Atlanta, offering functional living spaces and everyday convenience. The property features a practical layout and is positioned near local amenities, major roadways, and community resources, making commuting and access to surrounding areas straightforward. Whether you’re seeking a move-in-ready residence or an opportunity to personalize, this home provides a balance of location, accessibility, and neighborhood appeal.
Key facts
- 6,150 sq ft lot
- Built 1932
- Listed 84 days
Neighborhood map
What this means for you Summary
Snapshot
- This is a 2-bed/1.0-bath single-family listed at $199k.
Deal economics
- At list price, monthly cash flow is $-169 ($-2k/yr) — negative.
- To cash-flow at today's rent, offer at most $169k (15.0% below list).
- To meet the 1% rule (rent ≥ 1% of price), the offer needs to be $166k (16.7% below list).
- Recommended offer: $166k (16.7% below list) — sets the bar for 1% rule.
- Cap rate 5.3% vs local median 3.1% in Atlanta — top-decile yield for the area; either an underpriced asset or a hidden risk that comps aren't pricing in. Stress-test before assuming the spread holds.
Location & tenants
- Location reads 83/100 on livability (#6 in GA, #919 nationally) — a professional / high-income tenant draw. Strengths: amenities A+, commute A+, housing A+; Watch: schools C-, cost of living C-.
- Atlanta Public Schools (urban): math 28% / reading 35% proficiency, ranked #80 of 174 in GA (top 46%) — families likely to look elsewhere, expect single-tenant / working-renter base with shorter leases; 71% free/reduced lunch — lower-income household profile, screen leases tightly.
- Market conditions: Rents rising (+3.2%/yr); 378 active listings in the ZIP; 40 comparable units currently listed for rent nearby; rentals at typical pace (median 19d on market — plan ~3-4 weeks tenant-placement turnaround); 11,565 units permitted in Fulton County in 2024 (8,159 in 5+ unit buildings).
- This rent runs 39% of the median local income ($51k/yr) — at the standard rent-burdened threshold; future hikes will face affordability resistance.
Forward outlook
- Local home prices are declining (-3.0%/yr); year-one equity from $1k of loan paydown is wiped out by about $6k of value loss. Plan a longer hold.
- Fulton County population projected at +38% by 2050 — long-run rental-demand tailwind backs the buy-and-hold thesis.
Negotiation context
- It's been on market 84 days — a 6% lower offer ($187k) is reasonable based on typical stale-listing flexibility.
- 4 sale attempts since 18y ago; this cycle's ask has dropped $20k (9%) from the opening price — seller is motivated, your offer sets the floor, not the list.
Risks & watch-outs
- Watch-outs: built in 1932 — expect roof / HVAC / electrical / plumbing capex.
- Climate carrying-cost: major wind risk, 27% chance of damaging wind over 30y; extreme-heat days projected 7→18/yr by 2055 (HVAC capex compounding) — expect insurance premiums to compound above CPI over the hold.
Questions for the listing agent
- What do current leases actually rent for vs. the listed asking? Can we see a recent rent roll and the last 12 months of T-12 income?
- It's been on market 84 days. Have you received any prior offers? Is the seller open to a 17% concession, seller financing, or rate buy-down credit?
- Built in 1932 — when were the roof, HVAC, electrical panel, plumbing, and water heater last replaced?
- Why hasn't it sold? Are there any deal-killer items the seller is aware of (foundation, flood, title, zoning, code violations)?
- Is there a deadline driving the sale (1031 exchange, divorce, estate, relocation)? That informs how much negotiation room exists.
- The area grade is low — what's the realistic commute time and amenity access for the typical tenant pool here? Any planned neighborhood developments (good or bad) we should know about?
- What's the average days-on-market for RENTAL listings here right now (not sales)? A rising rental-DOM trend means longer vacancies and softer asking-rent achievability than the comps imply.
- What's the recent tenant-quality profile in this submarket — average credit score on applications, eviction rate, late-payment / NSF rate, and stable-employment percentage? A property-management company in the area should have these aggregated.
- How much new for-sale + rental construction is in the pipeline within 1–3 miles? Heavy new supply typically softens prices + rents 12–24 months out; constrained supply supports both.
Investment metrics
- 1% rule
- 0.83% ✗
- Cap rate
- 5.28%
- Cash-on-cash
- -3.63%
- DSCR
- 0.84
- GRM
- 10.0
CMA / ARV
- ARV (median comp)
- $259,516
- List price
- $199,000
- Delta
- -23.32%
- Verdict
- UNDERPRICED
- Comps
- 20 within 1.0 mi
Show comp detail 10 sales within ~0.75 mi
| Address | Dist | Beds/Ba | Sqft | Sold | Price | $/sf | Match |
|---|---|---|---|---|---|---|---|
| 133 Buchanan Ln | 0.05mi | 2/1.0 | 784 (-9%) | 1mo | $97,000 | $124 | 81 |
| 17 Turman Ave #2 | 0.62mi | 3/1.0 (+1) | 875 (+1%) | 1mo | $197,000 | $225 | 63 |
| 17 Turman Ave SE #4 | 0.62mi | 3/1.0 (+1) | 875 (+1%) | 13mo | $175,000 | $200 | 53 |
| 17 Turman #4 Ave SE | 0.64mi | 3/1.0 (+1) | 875 (+1%) | 13mo | $175,000 | $200 | 53 |
| 110 Turman Ave SE | 0.67mi | 3/1.0 (+1) | 800 (-7%) | 2mo | $170,000 | $213 | 50 |
| 66 Bowen Ave SE | 0.61mi | 2/1.5 | 840 (-3%) | 20mo | $245,000 | $292 | 48 |
| 1101 Oak Knoll Ter SE | 0.74mi | 3/2.0 (+1) | 901 (+4%) | 4mo | $165,000 | $183 | 46 |
| 985 Farrington Pl SE | 0.68mi | 1/1.0 (-1) | 770 (-11%) | 2mo | $220,000 | $286 | 44 |
| 120 Turman Ave SE | 0.67mi | 3/1.0 (+1) | 800 (-7%) | 10mo | $126,000 | $158 | 43 |
| 116 Turman Ave SE | 0.67mi | 3/1.0 (+1) | 768 (-11%) | 11mo | $205,000 | $267 | 36 |
Match score weights: distance 35% · size 25% · config 20% · recency 20%. Top-matched comps best support the ARV.
Projected returns pro-forma
-3.0% appreciation · 3.23% rent growth · sell at horizon
- IRR
- -22.1%
- Equity multiple
- 0.24×
- Total profit
- $-42,519
- Equity at exit
- $29,672
- IRR
- -15.3%
- Equity multiple
- 0.12×
- Total profit
- $-48,916
- Equity at exit
- $17,206
Cash invested: $55,720 (down + closing). Projections, not guarantees.
Landlord ↔ Tenant lean methodology
- Overall (STATE)
- 90 Strongly Landlord-Friendly
- State Georgia
- 90 Strongly Landlord-Friendly · R+3
- County
- — inherits STATE
- City
- — inherits STATE
ZIP-level market 30315
- Rents YoY
- 3.2%
- Active inventory
- 378
- Price-to-rent
- 10.0×
Monthly cashflow live
- Estimated rent
- $1,658 high interval (Pro) →
- Mortgage (P&I)
- −$1,044
- Tax from tax record
- −$352 /mo · $4,222/yr
- Insurance
- −$83
- HOA
- −$0
- Vacancy / Maint / Mgmt
- −$348
- Net cashflow
- $-169
Break-even live
UW: 25.0% down · 7.5% · 30yr · 1.5% tax · 5.0% vac · 8.0% maint · 8.0% mgmt
Financing live
Cash to close
- Down payment
- $49,750
- Closing costs
- $5,970
- Reserves months
- —
- Total cash needed
- —
Loan-product check · same deal, 3 products live
Conventional
25% down · 7.5% · 30yr
- Down + closing
- —
- Monthly P&I
- —
- Monthly cashflow
- —
- DSCR
- —
- Eligible?
- —
Personal DTI + credit; lowest rate.
DSCR
20% down · 8.5% · 30yr
- Down + closing
- —
- Monthly P&I
- —
- Monthly cashflow
- —
- DSCR
- —
- Eligible?
- —
No personal income docs; deal must DSCR.
Hard money
10% down · 12.0% · 12mo
- Down + closing
- —
- Monthly P&I
- —
- Monthly cashflow
- —
- DSCR
- —
- Eligible?
- —
Short-term bridge; refi at stabilization.
Rent comps 40 comps
| Address | Beds | Baths | Sqft | Rent | $/sqft | DOM | Units | Dist |
|---|---|---|---|---|---|---|---|---|
| 1293-1295 Marcy St SE Unit 7 Atlanta, GA | 1.0 | 1.0 | 650 | $950 | $1.46 | 24d | 1 | 0.17mi |
| 1295 Marcy St SE Atlanta, GA | 1.0 | 1.0 | 650 | $950 | $1.46 | 24d | 1 | 0.17mi |
| 1293 Marcy St SE Unit 8 Atlanta, GA | 1.0 | 1.0 | 600 | $950 | $1.58 | 24d | 1 | 0.18mi |
| 825 Hank Aaron Dr SW Atlanta, GA | 2.0 | 2.0 | 861 | $1,470 | $1.71 | 24d | 1 | 0.21mi |
| 1455 Jonesboro Rd SE Atlanta, GA | 2.0 | 1.0 | 700 | $2,000 | $2.86 | 24d | 1 | 0.22mi |
| 125 Milton Ave SE Atlanta, GA | 2.0 | 1.0–2.0 | 965 | $2,494 | $2.58 | 1d | 29 | 0.25mi |
| 95 Thirkield Ave SE Atlanta, GA | 3.0 | 2.0 | 1096 | $1,850 | $1.69 | 15d | 1 | 0.25mi |
| 91 Thirkield Ave SE Atlanta, GA | 2.0 | 1.0 | 1092 | $1,995 | $1.83 | 24d | 1 | 0.26mi |
| 174 Moury Ave SW Atlanta, GA | 1.0–3.0 | 1.0–2.0 | 926 | $1,604 | $1.73 | 2d | 6 | 0.42mi |
| 72 Milton Ave SE Atlanta, GA | 2.0 | 1.0–2.0 | 818 | $2,107 | $2.57 | 1d | 24 | 0.46mi |
| 1056 Hank Aaron Dr SW Atlanta, GA | 1.0–2.0 | 1.0 | 753 | $1,139 | $1.51 | 7d | 6 | 0.57mi |
| 51 Bowen Ave SE Atlanta, GA | 1.0 | 1.0 | 800 | $1,025 | $1.28 | 1d | 1 | 0.58mi |
| 430 Englewood Ave SE Atlanta, GA | 3.0 | 1.0–2.0 | 938 | $2,886 | $3.08 | 1d | 28 | 0.66mi |
| 1000 Hill St SE Unit C Atlanta, GA | 1.0 | 1.0 | 1100 | $1,823 | $1.66 | 7d | 1 | 0.72mi |
| 222 Tuskegee St SE Atlanta, GA | 2.0–3.0 | 1.0–2.0 | 1202 | $1,213 | $1.01 | 24d | 6 | 0.78mi |
| 1148 Booker Ave SW Atlanta, GA | 1.0 | 1.0 | 1012 | $900 | $0.89 | 16d | 1 | 0.86mi |
| 1483 Arthur Langford Jr Pl SW Atlanta, GA | 1.0–2.0 | 1.0 | 825 | $900 | $1.09 | 24d | 7 | 0.87mi |
| 52 Claire Dr SE Atlanta, GA | 2.0 | 2.0 | 800 | $1,750 | $2.19 | 18d | 1 | 0.89mi |
| 875 Hank Aaron Dr SW Atlanta, GA | 1.0–3.0 | 1.0–2.0 | 916 | $1,460 | $1.59 | 24d | 1 | 0.91mi |
| 1178 Garibaldi St SW Atlanta, GA | 1.0 | 1.0 | 650 | $950 | $1.46 | 24d | 1 | 0.93mi |
| 865 Hank Aaron Dr SE Unit 103 Atlanta, GA | 2.0 | 1.0 | 650 | $1,250 | $1.92 | 24d | 1 | 0.93mi |
| 1099 Boulevard SE Atlanta, GA | 2.0 | 1.0–2.0 | 928 | $2,294 | $2.47 | 1d | 30 | 0.93mi |
| 207 South Ave SE Atlanta, GA | 2.0 | 1.0 | 750 | $1,977 | $2.64 | 24d | 1 | 0.99mi |
| 1015 Boulevard SE Atlanta, GA | 2.0 | 1.0–2.0 | 933 | $2,632 | $2.82 | 1d | 17 | 1.02mi |
| 672 Cassanova St SE Unit A Atlanta, GA | 1.0 | 1.0 | 1045 | $2,000 | $1.91 | 1d | 1 | 1.03mi |
| 672 Cassanova St SE Unit A Atlanta, GA | 1.0 | 1.0 | 1025 | $2,000 | $1.95 | 17d | 1 | 1.03mi |
| 1875 Conrad Ave SE Atlanta, GA | 3.0 | 2.0 | 1088 | $1,803 | $1.66 | 21d | 1 | 1.04mi |
| 375 Lincoln St SW Atlanta, GA | 1.0 | 1.0 | 1020 | $750 | $0.74 | 24d | 1 | 1.04mi |
| 1055 Park Row N Atlanta, GA | 1.0 | 1.5 | 1075 | $2,300 | $2.14 | 2d | 1 | 1.06mi |
| 1055 Park Row N Atlanta, GA | 1.0 | 1.5 | 1075 | $2,300 | $2.14 | 1d | 1 | 1.06mi |
| 1187 McDaniel St SW Unit B Atlanta, GA | 2.0 | 1.0 | 1038 | $1,025 | $0.99 | 11d | 1 | 1.07mi |
| 200 Guerin Rd Holly Springs, NC | 2.0–3.0 | 1.0–1.5 | 947 | $1,249 | $1.32 | 21d | 1 | 1.09mi |
| 1180 Sims St SW Atlanta, GA | 2.0 | 1.0 | 772 | $1,100 | $1.42 | 24d | 1 | 1.15mi |
| 547 Atlanta Ave SE Unit 2 Atlanta, GA | 1.0 | 1.0 | 850 | $1,400 | $1.65 | 24d | 1 | 1.18mi |
| 547 Atlanta Ave SE Atlanta, GA | 2.0 | 1.0 | 1000 | $1,850 | $1.85 | 24d | 1 | 1.18mi |
| 518 Erin Ave SW Atlanta, GA | 2.0 | 1.0 | 1075 | $2,500 | $2.33 | 17d | 1 | 1.19mi |
| 720 Hank Aaron Dr SE Atlanta, GA | 2.0 | 1.0–2.0 | 847 | $2,219 | $2.62 | 1d | 24 | 1.19mi |
| 680 Hamilton Ave SE Atlanta, GA | 1.0–2.0 | 1.0–2.0 | 929 | $2,445 | $2.63 | 1d | 15 | 1.21mi |
| 340 Adelle St SE Atlanta, GA | 3.0 | 1.0 | 1122 | $1,500 | $1.34 | 2d | 1 | 1.22mi |
| 1133 Mayland Cir SW Atlanta, GA | 3.0 | 2.0 | 1120 | $3,600 | $3.21 | 24d | 1 | 1.34mi |
Listing history 23 events
-
2026-06-13statusdays on market $199,000 Pending 84 DOM
-
2026-06-09days on market $199,000 Active Under Contract 83 DOM
-
2026-06-08days on market $199,000 Active Under Contract 82 DOM
-
2026-06-07pricestatusdays on market $199,000 Active Under Contract 81 DOM
-
2026-06-04days on market $209,999 Active 78 DOM
-
2026-06-03days on market $209,999 Active 77 DOM
-
2026-06-02days on market $209,999 Active 76 DOM
-
2026-06-01days on market $209,999 Active 75 DOM
-
2026-05-31days on market $209,999 Active 74 DOM
-
2026-05-11status Active 489-char remark
Show marketing remark (489 chars)
Welcome to this well-situated single-family home in southeast Atlanta, offering functional living spaces and everyday convenience. The property features a practical layout and is positioned near local amenities, major roadways, and community resources, making commuting and access to surrounding areas straightforward. Whether you’re seeking a move-in-ready residence or an opportunity to personalize, this home provides a balance of location, accessibility, and neighborhood appeal.
-
2026-04-17historical Active Under Contract 483-char remark
Show marketing remark (489 chars)
Welcome to this well-situated single-family home in southeast Atlanta, offering functional living spaces and everyday convenience. The property features a practical layout and is positioned near local amenities, major roadways, and community resources, making commuting and access to surrounding areas straightforward. Whether you’re seeking a move-in-ready residence or an opportunity to personalize, this home provides a balance of location, accessibility, and neighborhood appeal.
-
2026-04-17historical Active Under Contract 489-char remark
Show marketing remark (489 chars)
Welcome to this well-situated single-family home in southeast Atlanta, offering functional living spaces and everyday convenience. The property features a practical layout and is positioned near local amenities, major roadways, and community resources, making commuting and access to surrounding areas straightforward. Whether you’re seeking a move-in-ready residence or an opportunity to personalize, this home provides a balance of location, accessibility, and neighborhood appeal.
-
2026-04-03price $214,900 489-char remark
Show marketing remark (483 chars)
Welcome to this well-situated single-family home in southeast Atlanta, offering functional living spaces and everyday convenience. The property features a practical layout and is positioned near local amenities, major roadways, and community resources, making commuting and access to surrounding areas straightforward. Whether you're seeking a move-in-ready residence or an opportunity to personalize, this home provides a balance of location, accessibility, and neighborhood appeal.
-
2026-04-03price $214,900 483-char remark
Show marketing remark (483 chars)
Welcome to this well-situated single-family home in southeast Atlanta, offering functional living spaces and everyday convenience. The property features a practical layout and is positioned near local amenities, major roadways, and community resources, making commuting and access to surrounding areas straightforward. Whether you're seeking a move-in-ready residence or an opportunity to personalize, this home provides a balance of location, accessibility, and neighborhood appeal.
-
2026-03-18$219,000 Active 489-char remark
Show marketing remark (483 chars)
Welcome to this well-situated single-family home in southeast Atlanta, offering functional living spaces and everyday convenience. The property features a practical layout and is positioned near local amenities, major roadways, and community resources, making commuting and access to surrounding areas straightforward. Whether you're seeking a move-in-ready residence or an opportunity to personalize, this home provides a balance of location, accessibility, and neighborhood appeal.
-
2026-03-18$219,000 New 483-char remark
Show marketing remark (483 chars)
Welcome to this well-situated single-family home in southeast Atlanta, offering functional living spaces and everyday convenience. The property features a practical layout and is positioned near local amenities, major roadways, and community resources, making commuting and access to surrounding areas straightforward. Whether you're seeking a move-in-ready residence or an opportunity to personalize, this home provides a balance of location, accessibility, and neighborhood appeal.
-
2021-10-06soldstatus $4,200,000
-
2019-01-14soldstatus $70,000
-
2009-02-25soldstatus $14,000
-
2008-12-18$14,000
-
2006-01-20soldstatus $155,000
-
1998-07-30soldstatus $17,900
-
1998-05-21soldstatus $7,500
ⓘ Source: listings_history table (triggers on properties + properties_extension) + one-shot
backfill from property_details.listing_events for pre-trigger history.
Tax reassessment forecast GA · Resets to sale price
- Current annual tax
- $4,222 · $352/mo
- Projected year-2 tax
- $4,222 · $352/mo
- Expected delta
- $0/yr ($0/mo · 0.0%)
ⓘ Screening estimate from a state-policy table — verify with the county assessor before closing.
Climate risk First Street
- Flood 1/10 Low FEMA zone X (unshaded) · 0% chance over 30 yrs
- Wildfire 1/10 Low
- Heat 5/10 Major 7 d/yr ≥105°F today · 18 d/yr by 30 yrs out
- Wind 6/10 Major 27% chance of damaging wind over 30 yrs
- Air quality 4/10 Moderate 4 unhealthy d/yr today · 6 by 30 yrs out
Nearby sold comps map
Loading sold comps map…
Walkable amenities ~0.75 mi
Loading nearby amenities…
Taxation est. · year 1
- Rental income
- $19,893
- − Mortgage interest
- −$11,147
- − Property taxes
- −$4,222
- − Insurance
- −$995
- − Repairs & maintenance
- −$1,591
- − Management
- −$1,591
- − Depreciation
- −$5,789
- Taxable loss
- −$5,443
- Est. tax savings @ 24.0%
- +$1,306
- After-tax cash flow
- $-718/yr
For passive investors: Depreciation is non-cash, so a rental often shows a tax loss while cash-flowing — sheltering income. Rental losses are passive: they offset passive income freely, and up to $25,000/yr can offset ordinary (W-2) income if you actively participate and your MAGI is under $100k (phasing out to $0 by $150k); unused losses carry forward. On sale, claimed depreciation is recaptured at up to 25%, and gains may owe capital-gains tax (a 1031 exchange can defer both). Figures are a year-1 estimate at your 24.0% rate — not tax advice; consult a CPA.
Schools (NCES district)
- District
- Atlanta Public Schools
- NCES district ID
- 1300120
- Math proficiency
- 28% ▼ -6.00%
- Reading proficiency
- 35% ▼ -2.00%
- Median HH income
- $48,306
- Composite
- 27.27/100
- National rank
- #7006
- State rank
- #80 of 174 in GA
Livability — Atlanta
- Score
- 83/100
- State rank
- #6
- US rank
- #919
Category grades
Schools grade is shown separately in the Schools card above.
Census & demographics
- Census place
- Atlanta, GA
- County
- Fulton County · 1,094,430 people
- City population
- 629,525
- Metro
- Atlanta-Sandy Springs-Alpharetta, GA
- Population (ZIP)
- 34,264
- Household income
- $50,822
- Rent vs Own
- Severe rent burden
- 2962.0
Population outlook (Fulton County) Hauer SSP2
- Today (2025)
- 1,203,707 people
- By 2030
- 1,299,706 · +8.0%
- By 2040
- 1,488,256 · +23.6%
- By 2050
- 1,664,580 · +38.3%
- By 2075
- 2,036,072 · +69.2%
- By 2100
- 2,222,402 · +84.6%
Race, ethnicity, and origin ACS 2023
- Neighborhood character
- Predominantly Black (72%)
- Race & ethnicity
- Black 72% White 14% Hispanic / Latino 10% Two or more races 4%
- Hispanic origin (detail)
- Mexican 4%
- Common ancestry
- Romanian 1% Italian 1% Lithuanian 1%
- Foreign-born
- 5% · Canada
- Languages at home
- 90% English-only · Spanish 9% French/Haitian/Cajun 1%
Political lean MEDSL · Fulton
- 2024 margin
- Solid D (+44.9) · D 71.9% · R 27.0% · Other 1.1%
- 2008→2024 swing
- +9.8pp toward D · 2008: 35.0pp · 2024: 44.9pp
- All cycles
- 2024: D+44.9 2020: D+46.4 2016: D+42.1 2012: D+29.6 2008: D+35.0
Not yet ingested
- Civics
- —
Market trends
- HPI YoY
- ▼ -281.87%
- Current HPI
- 176.673
- Rent YoY
- ▲ 3.23%
- Metro
- Atlanta-Sandy Springs-Alpharetta, GA
- State GDP YoY
- ▲ 2.66%
- F500 in state
- 28
Industry mix (Fortune 500 HQ in GA)
| Industry | F500 HQs | Revenue |
|---|---|---|
| Paper / Packaging | 2 | $29B |
|
||
| Retail | 1 | $160B |
|
||
| Transportation / Logistics | 1 | $91B |
|
||
| Airlines | 1 | $62B |
|
||
| Consumer Goods | 1 | $47B |
|
||
| Utilities | 1 | $25B |
|
||
Price history
+2765.3% since first listed14 events — show timeline
- 2026-05-11 Relisted — FMLS
- 2026-04-17 Contingent — GAMLS
- 2026-04-17 Contingent — FMLS
- 2026-04-03 Price Changed $214,900 FMLS
- 2026-04-03 Price Changed $214,900 GAMLS
- 2026-03-18 Listed $219,000 GAMLS
- 2026-03-18 Listed $219,000 FMLS
- 2021-10-06 Sold (Public Records) $4,200,000 Public Records
- 2019-01-14 Sold (Public Records) $70,000 Public Records
- 2009-02-25 Sold (MLS) $14,000 FMLS
- 2008-12-18 Listed $14,000 FMLS
- 2006-01-20 Sold (Public Records) $155,000 Public Records
- 1998-07-30 Sold (Public Records) $17,900 Public Records
- 1998-05-21 Sold (Public Records) $7,500 Public Records
Property tax history
+5.6%/yrLatest (2025): $4,222 · -2.6% YoY. Source: county tax records.
Cash-flow waterfall
monthlySold comps — $/sqft
last 12 mo · ≤1 miLoading sold comps…