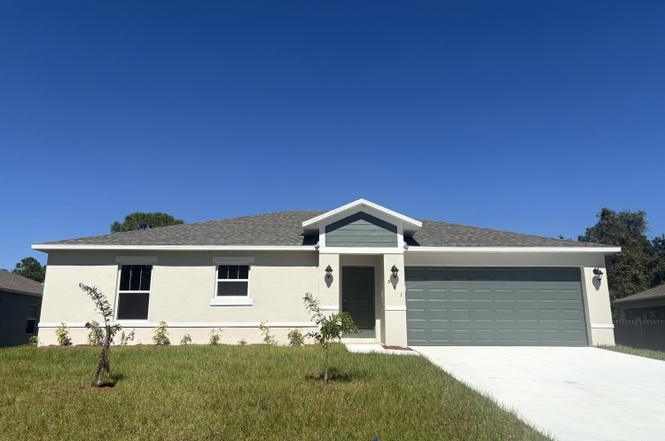
274 Cactus St SE #10 · Palm Bay, FL
Flood risk 1/10 · Minimal
- FEMA flood zone
- X (unshaded)
- Chance of flooding over 30 yrs
- 0.0%
- Est. flood insurance / yr
- $507 – $1,088
Fire risk 1/10 · Minimal
- Est. fire insurance / yr
- $947 – $1,759
Heat risk 9/10 · Severe
- Hot days now (above 106°F)
- 7 days/yr
- Hot days in 30 yrs
- 22 days/yr
Wind risk 10/10 · Severe
- Chance of severe wind over 30 yrs
- 99.0%
Air-quality risk 1/10 · Minimal
- Unhealthy air days now
- 0 days/yr
- Unhealthy air days in 30 yrs
- 0 days/yr
Risk factors via First Street. Map © Google.
Why this score? — see what drove the D grade
The composite is a weighted blend of 9 inputs, each scored 0–100. Each bar is that input's sub-score; the figure is the points it added to the 100-point composite (weight × sub-score).
- Appreciation +10.0/10.0
- ARV discount +7.5/15.0
- Cash flow +6.4/30.0
- Schools +4.7/10.0
- Livability +3.6/5.0
- Rent growth +3.4/5.0
- Condition / age +2.5/5.0
- 1% rule +1.6/10.0
- DSCR +0.7/10.0
$326,990
🖨 Deal sheet (PDF) 📄 Offer letter ✓ Due diligence
Listing remarks
MOVE-IN READY! City Water! Brand-new construction home blends elegance, comfort, and modern convenience. Built with durable block and stucco construction, this open floor plan offers 3 bedrooms, 2 baths, and 1,504 sq. ft. of designed living space. Vaulted ceilings in the kitchen, dining, and living areas enhance the spacious feel, while North Point White cabinets and Ornamental White granite countertops add a touch of sophistication. The entire home is adorned with floating luxury vinyl plank flooring, ensuring both style and durability. Enjoy the Florida outdoors with a 10' x 10' covered porch. A premium stainless-steel appliance package is INCLUDED, featuring a 24.3 cubic foot side-by-si
Key facts
- Open floor plan
- Vaulted ceilings
- 0.23 acre lot
Tags
Property features AI
Exterior
- Parking: 2-car garage with garage door opener
- Utilities: Aerobic septic; Cable available; Electricity available; Water available
- Home design: Single family residence; New construction; Faces south
- Construction: Block and stucco construction; Shingle roof
- Exterior features: Patio; Cleared lot
Interior
- Kitchen: Dishwasher; Disposal; Electric cooktop; Ice maker; Microwave; Refrigerator
- Bedrooms: 3 bedrooms (all on the first floor)
- Flooring: Luxury vinyl plank
- Bathrooms: 2 full bathrooms
- Heating & cooling: Central heating; Central air conditioning
- Interior features: Eight total rooms; Luxury vinyl plank throughout
- Laundry & utility: Unfurnished (no laundry appliances specified)
Neighborhood map
What this means for you Summary
Snapshot
- This is a 3-bed/2.0-bath single-family listed at $327k.
Deal economics
- At list price, monthly cash flow is $-564 ($-7k/yr) — negative.
- To cash-flow at today's rent, offer at most $245k (25.0% below list).
- To meet the 1% rule (rent ≥ 1% of price), the offer needs to be $215k (34.4% below list).
- Recommended offer: $215k (34.4% below list) — sets the bar for 1% rule.
Location & tenants
- Location reads 72/100 on livability (#366 in FL) — a middle-class / working-renter tenant base. Strengths: cost of living A+, housing A+; Watch: employment D+, amenities F, health & safety D-.
- Brevard (suburban): math 53% / reading 57% proficiency, ranked #19 of 73 in FL (top 26%) — acceptable for families but not a draw, mixed tenant base, ~2y average lease.
- Zoned schools: W. Melbourne Elementary School For Science (math 88% / reading 86%, grade A+, #24 of 2,144 statewide, top 1%, 549 students, 18% FRL); Southwest Middle School (math 40% / reading 39%, grade F, #373 of 571 statewide, top 66%, 920 students, 58% FRL); Heritage High School (math 30% / reading 44%, grade F, #340 of 667 statewide, top 52%, 2,007 students, 62% FRL) — zoned schools at 46% FRL track the district average.
- Market conditions: Rents rising (+3.7%/yr); 1123 active listings in the ZIP; 26 comparable units currently listed for rent nearby; rentals at typical pace (median 25d on market — plan ~3-4 weeks tenant-placement turnaround); solid renter incomes; 4,602 units permitted in Brevard County in 2024 (702 in 5+ unit buildings).
- This rent runs 32% of the median local income ($80k/yr) — at the standard rent-burdened threshold; future hikes will face affordability resistance.
Forward outlook
- In year one you build about $35k of equity ($2k loan paydown + $33k appreciation (10.0% local appreciation)).
- Brevard County population projected at +15% by 2050 — modest demand growth; plan on rents tracking national, not racing it.
- By year 2, paydown + projected appreciation supports a ~$56k cash-out refi (75% LTV) — recoverable capital for the next deal without selling this one.
Negotiation context
- It's been on market 195 days — a 12% lower offer ($288k) is reasonable based on typical stale-listing flexibility.
- 2 sale attempts with the ask held roughly flat each time — persistent listings suggest the price (not the market) is what's stuck; bring a comps-based counter.
Risks & watch-outs
- Climate carrying-cost: severe wind risk, 99% chance of damaging wind over 30y; extreme-heat days projected 7→22/yr by 2055 (HVAC capex compounding) — expect insurance premiums to compound above CPI over the hold.
Questions for the listing agent
- What do current leases actually rent for vs. the listed asking? Can we see a recent rent roll and the last 12 months of T-12 income?
- It's been on market 195 days. Have you received any prior offers? Is the seller open to a 34% concession, seller financing, or rate buy-down credit?
- Why hasn't it sold? Are there any deal-killer items the seller is aware of (foundation, flood, title, zoning, code violations)?
- Is there a deadline driving the sale (1031 exchange, divorce, estate, relocation)? That informs how much negotiation room exists.
- The area grade is low — what's the realistic commute time and amenity access for the typical tenant pool here? Any planned neighborhood developments (good or bad) we should know about?
- What's the average days-on-market for RENTAL listings here right now (not sales)? A rising rental-DOM trend means longer vacancies and softer asking-rent achievability than the comps imply.
- What's the recent tenant-quality profile in this submarket — average credit score on applications, eviction rate, late-payment / NSF rate, and stable-employment percentage? A property-management company in the area should have these aggregated.
- How much new for-sale + rental construction is in the pipeline within 1–3 miles? Heavy new supply typically softens prices + rents 12–24 months out; constrained supply supports both.
Investment metrics
- 1% rule
- 0.66% ✗
- Cap rate
- 4.22%
- Cash-on-cash
- -7.40%
- DSCR
- 0.67
- GRM
- 12.7
CMA / ARV
No comps found within radius.
Projected returns pro-forma
10.0% appreciation · 3.67% rent growth · sell at horizon
- IRR
- 19.2%
- Equity multiple
- 2.57×
- Total profit
- $143,624
- Equity at exit
- $294,578
- IRR
- 17.9%
- Equity multiple
- 5.96×
- Total profit
- $454,322
- Equity at exit
- $635,270
Cash invested: $91,557 (down + closing). Projections, not guarantees.
Landlord ↔ Tenant lean methodology
- Overall (STATE)
- 87 Strongly Landlord-Friendly
- State Florida
- 87 Strongly Landlord-Friendly · R+3
- County
- — inherits STATE
- City
- — inherits STATE
ZIP-level market 32909
- Home prices YoY
- 6.0%
- Rents YoY
- 3.7%
- Active inventory
- 1123
- Price-to-rent
- 12.7×
Monthly cashflow live
- Estimated rent
- $2,146 high interval (Pro) →
- Mortgage (P&I)
- −$1,715
- Tax est. 1.5%
- −$409 /mo · $4,905/yr
- Insurance
- −$136
- HOA
- −$0
- Vacancy / Maint / Mgmt
- −$451
- Net cashflow
- $-564
Break-even live
Sensitivity live
| Price | -10% $-339 | -5% $-451 | +0% $-564 | +5% $-677 | +10% $-790 |
|---|---|---|---|---|---|
| Rent | -10% $-734 | -5% $-649 | +0% $-564 | +5% $-480 | +10% $-395 |
| Rate | -1.0pp $-400 | -0.5pp $-481 | base $-564 | +0.5pp $-649 | +1.0pp $-735 |
UW: 25.0% down · 7.5% · 30yr · 1.5% tax · 5.0% vac · 8.0% maint · 8.0% mgmt
Financing live
Cash to close
- Down payment
- $81,748
- Closing costs
- $9,810
- Reserves months
- —
- Total cash needed
- —
Loan-product check · same deal, 3 products live
Conventional
25% down · 7.5% · 30yr
- Down + closing
- —
- Monthly P&I
- —
- Monthly cashflow
- —
- DSCR
- —
- Eligible?
- —
Personal DTI + credit; lowest rate.
DSCR
20% down · 8.5% · 30yr
- Down + closing
- —
- Monthly P&I
- —
- Monthly cashflow
- —
- DSCR
- —
- Eligible?
- —
No personal income docs; deal must DSCR.
Hard money
10% down · 12.0% · 12mo
- Down + closing
- —
- Monthly P&I
- —
- Monthly cashflow
- —
- DSCR
- —
- Eligible?
- —
Short-term bridge; refi at stabilization.
Rent comps 26 comps
| Address | Beds | Baths | Sqft | Rent | $/sqft | DOM | Units | Dist |
|---|---|---|---|---|---|---|---|---|
| 309 Cactus St SE Palm Bay, FL | 4.0 | 2.0 | 1846 | $2,195 | $1.19 | 16d | 1 | 0.07mi |
| 171 Okeefe St SE Palm Bay, FL | 3.0 | 2.0 | 1288 | $1,855 | $1.44 | 16d | 1 | 0.24mi |
| 857 Buchanan Ave SE Palm Bay, FL | 3.0 | 2.0 | 1257 | $1,950 | $1.55 | 25d | 1 | 0.45mi |
| 431 Brantley St SE Palm Bay, FL | 3.0 | 2.0 | 1326 | $2,050 | $1.55 | 21d | 1 | 0.54mi |
| 320 Algiers Ave SE Palm Bay, FL | 3.0 | 2.0 | 1306 | $1,825 | $1.40 | 25d | 1 | 0.56mi |
| 490 Hatcher St SE Palm Bay, FL | 4.0 | 2.0 | 1833 | $2,150 | $1.17 | 23d | 1 | 0.58mi |
| 914 Caligula Ave SE Palm Bay, FL | 3.0 | 2.0 | 1371 | $1,841 | $1.34 | 15d | 1 | 0.62mi |
| 272 Aquarius Ave SE Palm Bay, FL | 4.0 | 2.0 | 1650 | $1,995 | $1.21 | 25d | 1 | 0.64mi |
| 931 Commerce Rd SE Palm Bay, FL | 3.0 | 2.0 | 1068 | $2,300 | $2.15 | 25d | 1 | 0.64mi |
| 726 Scotten Ave SW Palm Bay, FL | 3.0 | 2.0 | 1443 | $1,970 | $1.37 | 15d | 1 | 0.74mi |
| 743 Andrew St SE Palm Bay, FL | 3.0 | 2.0 | 1252 | $1,895 | $1.51 | 25d | 1 | 0.79mi |
| 741 Frisco St SE Palm Bay, FL | 3.0 | 2.0 | 1156 | $1,950 | $1.69 | 25d | 1 | 0.89mi |
| 154 Anderson Ave NE Unit 154 Palm Bay, FL | 3.0 | 2.0 | 1414 | $1,800 | $1.27 | 15d | 1 | 1.07mi |
| 710 Avalon St SE Palm Bay, FL | 3.0 | 2.0 | 1378 | $1,995 | $1.45 | 25d | 1 | 1.09mi |
| 1129 Colonial Ave SE Palm Bay, FL | 4.0 | 3.0 | 2008 | $2,500 | $1.25 | 21d | 1 | 1.12mi |
| 907 Algardi St SE Palm Bay, FL | 4.0 | 2.0 | 1943 | $2,330 | $1.20 | 25d | 1 | 1.16mi |
| 487 Wiltshire Ave SW Palm Bay, FL | 3.0 | 2.0 | 1462 | $2,300 | $1.57 | 25d | 1 | 1.16mi |
| 214 Eldron Blvd NE Palm Bay, FL | 3.0 | 2.0 | 1646 | $2,075 | $1.26 | 25d | 1 | 1.17mi |
| 511 Trumpet St SW Palm Bay, FL | 3.0 | 2.0 | 1243 | $2,200 | $1.77 | 25d | 1 | 1.19mi |
| 497 Schenley St SW Palm Bay, FL | 4.0 | 2.0 | 1833 | $1,995 | $1.09 | 25d | 1 | 1.25mi |
| 154 Daffodil Dr SW Palm Bay, FL | 3.0–4.0 | 2.0–3.0 | 1384 | $1,649 | $1.19 | 16d | 6 | 1.29mi |
| 741 Fairhaven St NE Palm Bay, FL | 2.0 | 2.0 | 1336 | $1,900 | $1.42 | 25d | 1 | 1.30mi |
| 296 Croquet Ave NE Palm Bay, FL | 4.0 | 2.0 | 2028 | $2,300 | $1.13 | 23d | 1 | 1.34mi |
| 1224 Buffing Cir SE Palm Bay, FL | 4.0 | 2.0 | 2233 | $2,395 | $1.07 | 16d | 1 | 1.36mi |
| 356 Garbelmann St SW Palm Bay, FL | 4.0 | 3.0 | 1850 | $2,121 | $1.15 | 15d | 1 | 1.42mi |
| 210 Meehan Ave NW Palm Bay, FL | 3.0 | 2.0 | 2020 | $1,895 | $0.94 | 16d | 1 | 1.46mi |
Listing history 21 events
-
2026-06-22days on market $326,990 Active 195 DOM
-
2026-06-18days on market $326,990 Active 192 DOM
-
2026-06-17days on market $326,990 Active 191 DOM
-
2026-06-16days on market $326,990 Active 190 DOM
-
2026-06-15days on market $326,990 Active 189 DOM
-
2026-06-14days on market $326,990 Active 187 DOM
-
2026-06-10days on market $326,990 Active 184 DOM
-
2026-06-08days on market $326,990 Active 182 DOM
-
2026-06-07days on market $326,990 Active 181 DOM
-
2026-06-05days on market $326,990 Active 178 DOM
-
2026-06-03days on market $326,990 Active 177 DOM
-
2026-06-02days on market $326,990 Active 176 DOM
-
2026-06-01days on market $326,990 Active 175 DOM
-
2026-05-31days on market $326,990 Active 174 DOM
-
2026-05-31days on market $326,990 Active 173 DOM
-
2026-04-04price $326,990
-
2026-04-02status Active
-
2026-03-31historical
-
2026-02-05price $334,990
-
2026-01-08price $329,990
-
2025-12-06$339,990 Active
ⓘ Source: listings_history table (triggers on properties + properties_extension) + one-shot
backfill from property_details.listing_events for pre-trigger history.
Climate risk First Street
- Flood 1/10 Low FEMA zone X (unshaded) · 0% chance over 30 yrs
- Wildfire 1/10 Low
- Heat 9/10 Extreme 7 d/yr ≥106°F today · 22 d/yr by 30 yrs out
- Wind 10/10 Extreme 99% chance of damaging wind over 30 yrs
- Air quality 1/10 Low 0 unhealthy d/yr today · 0 by 30 yrs out
Nearby sold comps map
Loading sold comps map…
Walkable amenities ~0.75 mi
Loading nearby amenities…
Taxation est. · year 1
- Rental income
- $25,751
- − Mortgage interest
- −$18,317
- − Property taxes
- −$4,905
- − Insurance
- −$1,635
- − Repairs & maintenance
- −$2,060
- − Management
- −$2,060
- − Depreciation
- −$9,512
- Taxable loss
- −$12,738
- Est. tax savings @ 24.0%
- +$3,057
- After-tax cash flow
- $-3,717/yr
For passive investors: Depreciation is non-cash, so a rental often shows a tax loss while cash-flowing — sheltering income. Rental losses are passive: they offset passive income freely, and up to $25,000/yr can offset ordinary (W-2) income if you actively participate and your MAGI is under $100k (phasing out to $0 by $150k); unused losses carry forward. On sale, claimed depreciation is recaptured at up to 25%, and gains may owe capital-gains tax (a 1031 exchange can defer both). Figures are a year-1 estimate at your 24.0% rate — not tax advice; consult a CPA.
Schools (NCES district)
- District
- Brevard
- NCES district ID
- 1200150
- Math proficiency
- 53% ▼ -9.00%
- Reading proficiency
- 57% ▼ -4.00%
- Median HH income
- $49,426
- Composite
- 46.86/100
- National rank
- #2370
- State rank
- #19 of 73 in FL
Livability — Palm Bay
- Score
- 72/100
- State rank
- #366
- US rank
- #6458
Category grades
Schools grade is shown separately in the Schools card above.
Census & demographics
- Census place
- Palm Bay, FL
- County
- Brevard County · 602,871 people
- City population
- 132,211
- Metro
- Palm Bay-Melbourne-Titusville, FL
- Population (ZIP)
- 41,804
- Household income
- $79,977
- Rent vs Own
- Severe rent burden
- 697.0
Population outlook (Brevard County) Hauer SSP2
- Today (2025)
- 623,254 people
- By 2030
- 648,420 · +4.0%
- By 2040
- 690,009 · +10.7%
- By 2050
- 715,669 · +14.8%
- By 2075
- 775,744 · +24.5%
- By 2100
- 776,687 · +24.6%
Race, ethnicity, and origin ACS 2023
- Neighborhood character
- Diverse neighborhood (Simpson 0.70)
- Race & ethnicity
- White 46% Black 21% Hispanic / Latino 20% Two or more races 16% Asian 4%
- Hispanic origin (detail)
- Mexican 2% Puerto Rican 8% Cuban 5%
- Common ancestry
- Hispanic 3% Slovak 2% Lithuanian 2%
- Foreign-born
- 17% · Canada, China, Jamaica
- Languages at home
- 84% English-only · Spanish 9% French/Haitian/Cajun 4% Chinese 1%
Political lean MEDSL · Brevard
- 2024 margin
- Strong R (+20.8) · D 39.1% · R 59.9% · Other 1.0%
- 2008→2024 swing
- -10.4pp toward R · 2008: -10.4pp · 2024: -20.8pp
- All cycles
- 2024: R+20.8 2020: R+16.4 2016: R+19.8 2012: R+12.7 2008: R+10.4
Not yet ingested
- Civics
- —
Market trends
- HPI YoY
- ▲ 18.81%
- Current HPI
- 330.8595
- Rent YoY
- ▲ 3.67%
- Metro
- Palm Bay-Melbourne-Titusville, FL
- State GDP YoY
- ▲ 3.28%
- F500 in state
- 36
Industry mix (Fortune 500 HQ in FL)
| Industry | F500 HQs | Revenue |
|---|---|---|
| Industrial Technology | 2 | $29B |
|
||
| Insurance | 2 | $17B |
|
||
| Retail | 1 | $60B |
|
||
| Technology Distribution | 1 | $58B |
|
||
| Homebuilding | 1 | $35B |
|
||
| Technology Manufacturing | 1 | $35B |
|
||
Price history
-3.8% since first listed6 events — show timeline
- 2026-04-04 Price Changed $326,990 SCMLS
- 2026-04-02 Relisted — SCMLS
- 2026-03-31 Listing Removed — SCMLS
- 2026-02-05 Price Changed $334,990 SCMLS
- 2026-01-08 Price Changed $329,990 SCMLS
- 2025-12-06 Listed $339,990 SCMLS
Cash-flow waterfall
monthlySold comps — $/sqft
last 12 mo · ≤1 miLoading sold comps…