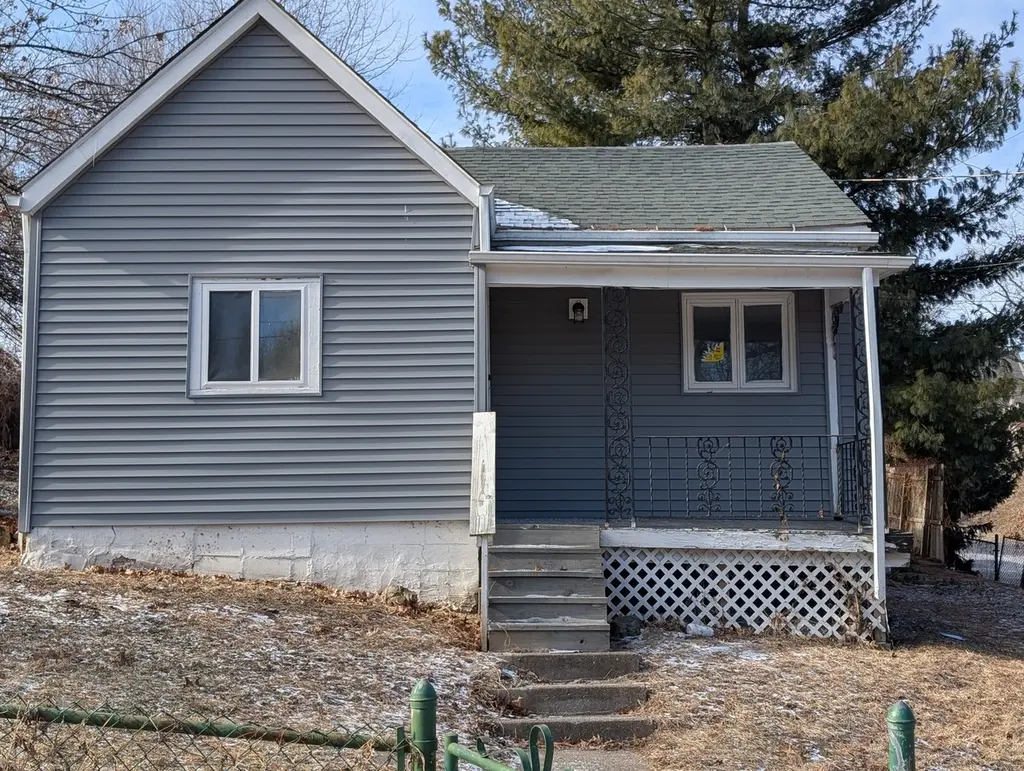
928 Farnam St · Davenport, IA
Flood risk 1/10 · Minimal
- FEMA flood zone
- X (unshaded)
- Chance of flooding over 30 yrs
- 0.0%
- Est. flood insurance / yr
- $473 – $860
Fire risk 1/10 · Minimal
- Est. fire insurance / yr
- $902 – $1,676
Heat risk 3/10 · Minor
- Hot days now (above 103°F)
- 7 days/yr
- Hot days in 30 yrs
- 15 days/yr
Wind risk 2/10 · Minimal
- Chance of severe wind over 30 yrs
- —
Air-quality risk 3/10 · Minor
- Unhealthy air days now
- 2 days/yr
- Unhealthy air days in 30 yrs
- 3 days/yr
Risk factors via First Street. Map © Google.
Why this score? — see what drove the B- grade
The composite is a weighted blend of 9 inputs, each scored 0–100. Each bar is that input's sub-score; the figure is the points it added to the 100-point composite (weight × sub-score).
- Cash flow +24.6/30.0
- ARV discount +15.0/15.0
- DSCR +7.9/10.0
- 1% rule +7.1/10.0
- Livability +4.0/5.0
- Schools +3.9/10.0
- Rent growth +3.6/5.0
- Condition / age +2.5/5.0
- Appreciation +0.0/10.0
$84,900
🖨 Deal sheet 📄 Offer letter ✓ Due diligence
Listing remarks MLS
Classic 1925 home offering original character throughout with thoughtful updates where it counts. The remodeled kitchen complements the style and era of the home without taking away from its charm. This 2-bedroom, 2-bath property features 842 sq ft with a practical, easy-to-live-in layout that makes good use of the space. Period details and a straightforward floor plan give the home a warm, authentic feel that's hard to replicate in newer construction. Located in the City of Davenport and served by the Davenport Community School District. Conveniently situated near downtown Davenport, local parks, and major travel routes, making everyday access simple. The property is vacant and ready for its next owner, offering a solid opportunity for an owner-occupant or investor looking for a well-located home with lasting character.
Key facts
- Original character
- Remodeled kitchen
- Period details
Tags
Neighborhood map
What this means for you Summary
Snapshot
- This is a 2-bed/2.0-bath single-family listed at $85k.
Deal economics
- At list price, monthly cash flow is $175 ($2k/yr) — positive.
- The deal already cash-flows at list — no discount required.
- Meets the 1% rule at list price ($1k rent vs $85k).
- Recommended offer: $75k (12.0% below list) — sets the bar for market timing.
- Cap rate 8.8% vs local median 4.4% in Davenport — top-decile yield for the area; either an underpriced asset or a hidden risk that comps aren't pricing in. Stress-test before assuming the spread holds.
Location & tenants
- Location reads 79/100 on livability (#126 in IA, #2,312 nationally) — a middle-class / working-renter tenant base. Strengths: cost of living A+, housing A+, health & safety A+; Watch: employment C-, crime F.
- Davenport Community School District (urban): math 43% / reading 50% proficiency, ranked #288 of 289 in IA (top 100%) — families likely to look elsewhere, expect single-tenant / working-renter base with shorter leases.
- Market conditions: Rents rising fast (+4.6%/yr); 160 active listings in the ZIP; 40 comparable units currently listed for rent nearby; rentals lingering (median 44d on market — plan ~5-8 weeks vacancy on turnover, expect pricing pressure); 55% of comp listings sitting > 30 days — soft ceiling on asking rent; 805 units permitted in Scott County in 2024 (479 in 5+ unit buildings).
Forward outlook
- Local home prices are declining (-3.0%/yr); year-one equity from $587 of loan paydown is wiped out by about $3k of value loss. Plan a longer hold.
- Scott County population projected at +19% by 2050 — long-run rental-demand tailwind backs the buy-and-hold thesis.
- At projected returns (-3.0% appreciation + 4.6% rent growth), your $24k cash investment doubles in ~10 years — after that, you're playing with house money.
Negotiation context
- It's been on market 135 days — a 12% lower offer ($75k) is reasonable based on typical stale-listing flexibility.
- 5 sale attempts since 25y ago; this cycle's ask has dropped $8k (9%) from the opening price — seller is motivated, your offer sets the floor, not the list.
Risks & watch-outs
- Watch-outs: built in 1925 — expect roof / HVAC / electrical / plumbing capex.
Questions for the listing agent
- It's been on market 135 days. Have you received any prior offers? Is the seller open to a 12% concession, seller financing, or rate buy-down credit?
- Built in 1925 — when were the roof, HVAC, electrical panel, plumbing, and water heater last replaced?
- Why hasn't it sold? Are there any deal-killer items the seller is aware of (foundation, flood, title, zoning, code violations)?
- Is there a deadline driving the sale (1031 exchange, divorce, estate, relocation)? That informs how much negotiation room exists.
- Crime grade is F in this area — have there been break-ins, vandalism, or insurance claims at this property in the last 3 years? What carrier currently insures it and at what premium?
- What's the average days-on-market for RENTAL listings here right now (not sales)? A rising rental-DOM trend means longer vacancies and softer asking-rent achievability than the comps imply.
- What's the recent tenant-quality profile in this submarket — average credit score on applications, eviction rate, late-payment / NSF rate, and stable-employment percentage? A property-management company in the area should have these aggregated.
- How much new for-sale + rental construction is in the pipeline within 1–3 miles? Heavy new supply typically softens prices + rents 12–24 months out; constrained supply supports both.
Investment metrics
- 1% rule
- 1.21% ✓
- Cap rate
- 8.77%
- Cash-on-cash
- 8.83%
- DSCR
- 1.39
- GRM
- 6.9
CMA / ARV
- ARV (median comp)
- $115,936
- List price
- $84,900
- Delta
- -26.77%
- Verdict
- UNDERPRICED
- Comps
- 20 within 1.0 mi
Show comp detail 6 sales within ~0.75 mi
| Address | Dist | Beds/Ba | Sqft | Sold | Price | $/sf | Match |
|---|---|---|---|---|---|---|---|
| 625 E High St | 0.75mi | 2/2.0 | 912 (+8%) | 4mo | $208,242 | $228 | 48 |
| 1310 Kirkwood Blvd Blvd | 0.70mi | 2/1.0 | 895 (+6%) | 6mo | $119,900 | $134 | 48 |
| 1404 Kirkwood Blvd | 0.73mi | 2/1.0 | 725 (-14%) | 2mo | $92,000 | $127 | 37 |
| 2037 Leclaire St | 0.75mi | 3/1.0 (+1) | 960 (+14%) | 2mo | $160,000 | $167 | 31 |
| 1935 N Perry St | 0.72mi | 2/1.0 | 929 (+10%) | 17mo | $115,000 | $124 | 31 |
| 1417 College Ave | 0.65mi | 2/1.0 | 720 (-14%) | 20mo | $90,000 | $125 | 25 |
Match score weights: distance 35% · size 25% · config 20% · recency 20%. Top-matched comps best support the ARV.
Projected returns pro-forma
-3.0% appreciation · 4.57% rent growth · sell at horizon
- IRR
- -1.0%
- Equity multiple
- 0.96×
- Total profit
- $-916
- Equity at exit
- $12,659
- IRR
- 10.4%
- Equity multiple
- 1.87×
- Total profit
- $20,741
- Equity at exit
- $7,341
Cash invested: $23,772 (down + closing). Projections, not guarantees.
Landlord ↔ Tenant lean methodology
- Overall (STATE)
- 83 Strongly Landlord-Friendly
- State Iowa
- 83 Strongly Landlord-Friendly · R+6
- County
- — inherits STATE
- City
- — inherits STATE
ZIP-level market 52803
- Home prices YoY
- -34.5%
- Rents YoY
- 4.6%
- Active inventory
- 160
- Price-to-rent
- 6.9×
Monthly cashflow live
- Estimated rent
- $1,029 high interval (Pro) →
- Mortgage (P&I)
- −$445
- Tax from tax record
- −$158 /mo · $1,892/yr
- Insurance
- −$35
- HOA
- −$0
- Vacancy / Maint / Mgmt
- −$216
- Net cashflow
- $175
Break-even live
UW: 25.0% down · 7.5% · 30yr · 1.5% tax · 5.0% vac · 8.0% maint · 8.0% mgmt
Financing live
Cash to close
- Down payment
- $21,225
- Closing costs
- $2,547
- Reserves months
- —
- Total cash needed
- —
Loan-product check · same deal, 3 products live
Conventional
25% down · 7.5% · 30yr
- Down + closing
- —
- Monthly P&I
- —
- Monthly cashflow
- —
- DSCR
- —
- Eligible?
- —
Personal DTI + credit; lowest rate.
DSCR
20% down · 8.5% · 30yr
- Down + closing
- —
- Monthly P&I
- —
- Monthly cashflow
- —
- DSCR
- —
- Eligible?
- —
No personal income docs; deal must DSCR.
Hard money
10% down · 12.0% · 12mo
- Down + closing
- —
- Monthly P&I
- —
- Monthly cashflow
- —
- DSCR
- —
- Eligible?
- —
Short-term bridge; refi at stabilization.
Rent comps 40 comps
| Address | Beds | Baths | Sqft | Rent | $/sqft | DOM | Units | Dist |
|---|---|---|---|---|---|---|---|---|
| 411 E 8th St Davenport, IA | 2.0 | 1.0 | 600 | $750 | $1.25 | 43d | 1 | 0.20mi |
| 321 E 7th St Davenport, IA | 1.0–2.0 | 1.0 | 825 | $1,050 | $1.27 | 13d | 4 | 0.32mi |
| 811 E 14th St Davenport, IA | 1.0 | 1.0 | 579 | $600 | $1.04 | 43d | 4 | 0.32mi |
| 1105 Tremont Ave Unit 1107 Davenport, IA | 2.0 | 1.0 | 728 | $795 | $1.09 | 13d | 1 | 0.33mi |
| 1301 Arlington Ave Unit 1305 Davenport, IA | 2.0 | 1.0 | 900 | $895 | $0.99 | 13d | 1 | 0.33mi |
| 1228 Tremont Ave Unit 3 Davenport, IA | 1.0 | 1.0 | 600 | $695 | $1.16 | 13d | 1 | 0.34mi |
| 804 E 14th St Apt 1 Davenport, IA | 1.0 | 1.0 | 800 | $775 | $0.97 | 43d | 1 | 0.34mi |
| 1421 Grand Ave Unit 1 Davenport, IA | 2.0 | 1.0 | 1015 | $850 | $0.84 | 43d | 1 | 0.36mi |
| 614 E 15th St Apt 3 Davenport, IA | 1.0 | 1.0 | 560 | $695 | $1.24 | 43d | 1 | 0.37mi |
| 736 Federal St Davenport, IA | 1.0–3.0 | 1.0–2.0 | 1186 | $1,559 | $1.31 | 21d | 1 | 0.38mi |
| 1020 Oneida Ave Unit 1018 Davenport, IA | 1.0 | 1.0 | 546 | $750 | $1.37 | 43d | 1 | 0.39mi |
| 511 Pershing Ave Unit 402W Davenport, IA | 2.0 | 2.0 | 1106 | $1,478 | $1.34 | 43d | 1 | 0.41mi |
| 511 Pershing Ave Apt 304W Davenport, IA | 1.0 | 1.0 | 775 | $1,086 | $1.40 | 43d | 1 | 0.41mi |
| 511 Pershing Ave Unit 609W Davenport, IA | 2.0 | 1.0 | 912 | $1,317 | $1.44 | 43d | 1 | 0.41mi |
| 511 Pershing Ave Unit 105E Davenport, IA | 2.0 | 2.0 | 1100 | $1,635 | $1.49 | 43d | 1 | 0.41mi |
| 511 Pershing Ave Apt 602W Davenport, IA | 2.0 | 2.0 | 948 | $1,367 | $1.44 | 43d | 1 | 0.41mi |
| 427 Iowa St Unit 1-C308 Davenport, IA | 2.0 | 1.5 | 950 | $1,354 | $1.43 | 43d | 1 | 0.42mi |
| 402 E 4th St Davenport, IA | 1.0–2.0 | 1.0 | 805 | $1,188 | $1.48 | 13d | 1 | 0.44mi |
| 402 E 4th St Davenport, IA | 1.0–2.0 | 1.0 | 749 | $1,218 | $1.63 | 43d | 2 | 0.44mi |
| 908 Bridge Ave Apt 5 Davenport, IA | 1.0 | 1.0 | 800 | $750 | $0.94 | 21d | 1 | 0.46mi |
| 1012 Bridge Ave Apt 2 Davenport, IA | 1.0 | 1.0 | 700 | $750 | $1.07 | 21d | 1 | 0.46mi |
| 133 W 13th St Apt 3 Davenport, IA | 2.0 | 1.0 | 800 | $1,150 | $1.44 | 13d | 1 | 0.47mi |
| 1203 E 11th St Davenport, IA | 1.0 | 1.0 | 600 | $775 | $1.29 | 21d | 4 | 0.49mi |
| 1724 Farnam St Unit upper Davenport, IA | 1.0 | 1.0 | 985 | $725 | $0.74 | 21d | 1 | 0.51mi |
| 427 N Brady St Unit 6 Davenport, IA | 2.0 | 1.0 | 916 | $995 | $1.09 | 43d | 1 | 0.52mi |
| 108 W 5th St Unit 5 Davenport, IA | 1.0 | 1.0 | 737 | $875 | $1.19 | 43d | 1 | 0.53mi |
| 421 N Brady St Unit 11 Davenport, IA | 1.0 | 1.0 | 945 | $1,059 | $1.12 | 13d | 1 | 0.54mi |
| 421 N Brady St Unit 5 Davenport, IA | 1.0 | 1.0 | 780 | $968 | $1.24 | 43d | 1 | 0.54mi |
| 401 Brady St Davenport, IA | 1.0–3.0 | 1.0–2.0 | 870 | $1,625 | $1.87 | 13d | 2 | 0.57mi |
| 200 E 3rd St Davenport, IA | 1.0–2.0 | 1.0–2.0 | 900 | $1,700 | $1.89 | 13d | 2 | 0.57mi |
| 1812 Pershing Ave Unit 1 Davenport, IA | 3.0 | 1.0 | 1000 | $1,200 | $1.20 | 21d | 1 | 0.58mi |
| 1606 Brady St Davenport, IA | 1.0 | 1.0 | 487 | $1,145 | $2.35 | 21d | 3 | 0.59mi |
| 410 N Main St Unit 230 Davenport, IA | 2.0 | 1.0 | 800 | $1,250 | $1.56 | 43d | 1 | 0.61mi |
| 106 E 3rd St Davenport, IA | 1.0–2.0 | 1.0 | 812 | $1,299 | $1.60 | 43d | 1 | 0.62mi |
| 201 E Locust St Unit Sw Davenport, IA | 2.0 | 1.0 | 1000 | $875 | $0.88 | 43d | 1 | 0.63mi |
| 1030 E 18th St Davenport, IA | 2.0 | 2.0 | 648 | $1,150 | $1.77 | 21d | 1 | 0.64mi |
| 324 S Brady St Davenport, IA | 1.0–2.0 | 1.0–2.0 | 965 | $1,700 | $1.76 | 21d | 2 | 0.66mi |
| 1615 1/2 N Ripley St Davenport, IA | 2.0 | 1.0 | 900 | $825 | $0.92 | 43d | 1 | 0.74mi |
| 317 W 3rd St Davenport, IA | 1.0 | 1.0 | 600 | $900 | $1.50 | 43d | 1 | 0.77mi |
| 619 W 16th St Unit 4 Davenport, IA | 1.0 | 1.0 | 700 | $745 | $1.06 | 43d | 1 | 0.89mi |
Listing history 29 events
-
2026-06-18days on market $84,900 Active 135 DOM
-
2026-06-17days on market $84,900 Active 134 DOM
-
2026-06-16days on market $84,900 Active 133 DOM
-
2026-06-15days on market $84,900 Active 132 DOM
-
2026-06-14days on market $84,900 Active 130 DOM
-
2026-06-13days on market $84,900 Active 129 DOM
-
2026-06-10days on market $84,900 Active 127 DOM
-
2026-06-09days on market $84,900 Active 126 DOM
-
2026-06-08days on market $84,900 Active 125 DOM
-
2026-06-07days on market $84,900 Active 124 DOM
-
2026-06-03days on market $84,900 Active 120 DOM
-
2026-06-02days on market $84,900 Active 119 DOM
-
2026-06-01days on market $84,900 Active 118 DOM
-
2026-05-31days on market $84,900 Active 117 DOM
-
2026-05-30days on market $84,900 Active 116 DOM
-
2026-04-30price $84,900 835-char remark
Show marketing remark (835 chars)
Classic 1925 home offering original character throughout with thoughtful updates where it counts. The remodeled kitchen complements the style and era of the home without taking away from its charm. This 2-bedroom, 2-bath property features 842 sq ft with a practical, easy-to-live-in layout that makes good use of the space. Period details and a straightforward floor plan give the home a warm, authentic feel that's hard to replicate in newer construction. Located in the City of Davenport and served by the Davenport Community School District. Conveniently situated near downtown Davenport, local parks, and major travel routes, making everyday access simple. The property is vacant and ready for its next owner, offering a solid opportunity for an owner-occupant or investor looking for a well-located home with lasting character.
-
2026-03-05price $89,900 835-char remark
Show marketing remark (835 chars)
Classic 1925 home offering original character throughout with thoughtful updates where it counts. The remodeled kitchen complements the style and era of the home without taking away from its charm. This 2-bedroom, 2-bath property features 842 sq ft with a practical, easy-to-live-in layout that makes good use of the space. Period details and a straightforward floor plan give the home a warm, authentic feel that's hard to replicate in newer construction. Located in the City of Davenport and served by the Davenport Community School District. Conveniently situated near downtown Davenport, local parks, and major travel routes, making everyday access simple. The property is vacant and ready for its next owner, offering a solid opportunity for an owner-occupant or investor looking for a well-located home with lasting character.
-
2026-02-03$93,000 Active 835-char remark
Show marketing remark (835 chars)
Classic 1925 home offering original character throughout with thoughtful updates where it counts. The remodeled kitchen complements the style and era of the home without taking away from its charm. This 2-bedroom, 2-bath property features 842 sq ft with a practical, easy-to-live-in layout that makes good use of the space. Period details and a straightforward floor plan give the home a warm, authentic feel that's hard to replicate in newer construction. Located in the City of Davenport and served by the Davenport Community School District. Conveniently situated near downtown Davenport, local parks, and major travel routes, making everyday access simple. The property is vacant and ready for its next owner, offering a solid opportunity for an owner-occupant or investor looking for a well-located home with lasting character.
-
2024-09-18historical
-
2024-09-18historical
-
2024-05-10Active
-
2021-08-06historical
-
2019-05-29soldstatus $95,000
-
2018-07-23soldstatus $21,000
-
2018-07-23soldstatus $21,000
-
2018-06-26$28,000
-
2018-06-26$28,000
-
2001-09-17soldstatus $44,500
-
2001-03-16$47,900
ⓘ Source: listings_history table (triggers on properties + properties_extension) + one-shot
backfill from property_details.listing_events for pre-trigger history.
Tax reassessment forecast IA · Partial reset (capped growth)
- Current annual tax
- $1,892 · $158/mo
- Projected year-2 tax
- $1,892 · $158/mo
- Expected delta
- $0/yr ($0/mo · 0.0%)
ⓘ Screening estimate from a state-policy table — verify with the county assessor before closing.
Climate risk First Street
- Flood 1/10 Low FEMA zone X (unshaded) · 0% chance over 30 yrs
- Wildfire 1/10 Low
- Heat 3/10 Moderate 7 d/yr ≥103°F today · 15 d/yr by 30 yrs out
- Wind 2/10 Low
- Air quality 3/10 Moderate 2 unhealthy d/yr today · 3 by 30 yrs out
Nearby sold comps map
Loading sold comps map…
Walkable amenities ~0.75 mi
Loading nearby amenities…
Taxation est. · year 1
- Rental income
- $12,353
- − Mortgage interest
- −$4,756
- − Property taxes
- −$1,892
- − Insurance
- −$424
- − Repairs & maintenance
- −$988
- − Management
- −$988
- − Depreciation
- −$2,470
- Taxable income
- $834
- Est. tax owed @ 24.0%
- −$200
- After-tax cash flow
- $1,899/yr
For passive investors: Depreciation is non-cash, so a rental often shows a tax loss while cash-flowing — sheltering income. Rental losses are passive: they offset passive income freely, and up to $25,000/yr can offset ordinary (W-2) income if you actively participate and your MAGI is under $100k (phasing out to $0 by $150k); unused losses carry forward. On sale, claimed depreciation is recaptured at up to 25%, and gains may owe capital-gains tax (a 1031 exchange can defer both). Figures are a year-1 estimate at your 24.0% rate — not tax advice; consult a CPA.
Schools (NCES district)
- District
- Davenport Community School District
- NCES district ID
- 1908580
- Math proficiency
- 43% ▼ -11.00%
- Reading proficiency
- 50% ▼ -3.00%
- Median HH income
- $46,157
- Composite
- 39.49/100
- National rank
- #3951
- State rank
- #288 of 289 in IA
Livability — Davenport
- Score
- 79/100
- State rank
- #126
- US rank
- #2312
Category grades
Schools grade is shown separately in the Schools card above.
Census & demographics
- Census place
- Davenport, IA
- County
- Scott County · 144,583 people
- City population
- 103,319
- Metro
- Davenport-Moline-Rock Island, IA-IL
- Population (ZIP)
- 22,742
- Household income
- $64,543
- Rent vs Own
- Severe rent burden
- 630.0
Population outlook (Scott County) Hauer SSP2
- Today (2025)
- 188,878 people
- By 2030
- 196,648 · +4.1%
- By 2040
- 210,860 · +11.6%
- By 2050
- 224,359 · +18.8%
- By 2075
- 258,884 · +37.1%
- By 2100
- 286,447 · +51.7%
Race, ethnicity, and origin ACS 2023
- Neighborhood character
- Predominantly White (69%)
- Race & ethnicity
- White 69% Black 14% Two or more races 10% Hispanic / Latino 9%
- Hispanic origin (detail)
- Mexican 7%
- Common ancestry
- Romanian 2% Portuguese 2% Iranian 2%
- Foreign-born
- 5% · Canada, United Kingdom, South Korea
- Languages at home
- 93% English-only · Spanish 4% French/Haitian/Cajun 1%
Political lean MEDSL · Scott
- 2024 margin
- Toss-up / Even · D 47.3% · R 51.2% · Other 1.4%
- 2008→2024 swing
- -18.4pp toward R · 2008: 14.6pp · 2024: -3.9pp
- All cycles
- 2024: R+3.9 2020: D+3.5 2016: D+1.4 2012: D+13.8 2008: D+14.6
Not yet ingested
- Civics
- —
Market trends
- HPI YoY
- ▼ -96.00%
- Current HPI
- 182.0976
- Rent YoY
- ▲ 4.57%
- Metro
- Davenport-Moline-Rock Island, IA-IL
- State GDP YoY
- ▲ 2.48%
- F500 in state
- 4
Industry mix (Fortune 500 HQ in IA)
| Industry | F500 HQs | Revenue |
|---|---|---|
| Financial Services | 1 | $16B |
|
||
| Retail / Convenience | 1 | $15B |
|
||
Price history
+77.2% since first listed14 events — show timeline
- 2026-04-30 Price Changed $84,900 MRED as Distributed by MLS Grid
- 2026-03-05 Price Changed $89,900 MRED as Distributed by MLS Grid
- 2026-02-03 Listed $93,000 MRED as Distributed by MLS Grid
- 2024-09-18 Listing Removed — RMLSA as Distributed by MLS Grid
- 2024-09-18 Listing Removed — MRED as Distributed by MLS Grid
- 2024-05-10 Listed — RMLSA as Distributed by MLS Grid
- 2021-08-06 Listing Removed — RMLSA as Distributed by MLS Grid
- 2019-05-29 Sold (Public Records) $95,000 Public Records
- 2018-07-23 Sold (MLS) $21,000 RMLSA as Distributed by MLS Grid
- 2018-07-23 Sold (MLS) $21,000 MRED as Distributed by MLS Grid
- 2018-06-26 Listed $28,000 RMLSA as Distributed by MLS Grid
- 2018-06-26 Listed $28,000 MRED as Distributed by MLS Grid
- 2001-09-17 Sold (MLS) $44,500 RMLSA as Distributed by MLS Grid
- 2001-03-16 Listed $47,900 RMLSA as Distributed by MLS Grid
Property tax history
+5.1%/yrLatest (2025): $1,892 · +11.4% YoY. Source: county tax records.
Cash-flow waterfall
monthlySold comps — $/sqft
last 12 mo · ≤1 miLoading sold comps…