 Multi-family
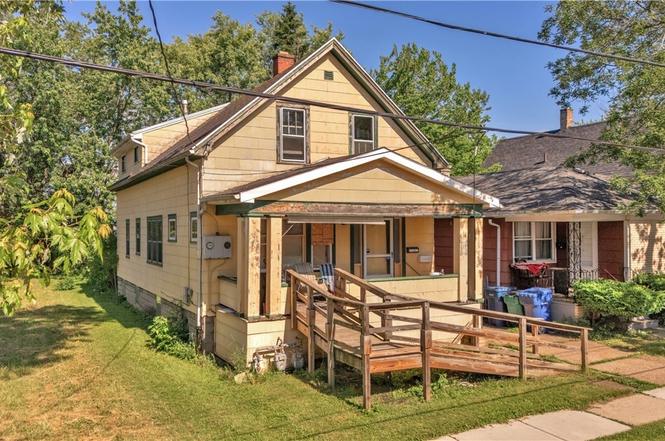
27 Sattler Ave · Buffalo, NY
Flood risk 5/10 · Moderate
- FEMA flood zone
- X (unshaded)
- Chance of flooding over 30 yrs
- 0.51%
- Est. flood insurance / yr
- $507 – $1,088
Fire risk 2/10 · Minimal
- Est. fire insurance / yr
- $691 – $1,283
Heat risk 3/10 · Minor
- Hot days now (above 93°F)
- 7 days/yr
- Hot days in 30 yrs
- 15 days/yr
Wind risk 1/10 · Minimal
- Chance of severe wind over 30 yrs
- —
Air-quality risk 3/10 · Minor
- Unhealthy air days now
- 2 days/yr
- Unhealthy air days in 30 yrs
- 3 days/yr
Risk factors via First Street. Map © Google.
Why this score? — see what drove the A- grade
The composite is a weighted blend of 9 inputs, each scored 0–100. Each bar is that input's sub-score; the figure is the points it added to the 100-point composite (weight × sub-score).
- Cash flow +30.0/30.0
- ARV discount +14.4/15.0
- 1% rule +10.0/10.0
- DSCR +10.0/10.0
- Appreciation +6.0/10.0
- Livability +3.9/5.0
- Schools +3.3/10.0
- Rent growth +2.5/5.0
- Condition / age +2.5/5.0
$79,999
🖨 Deal sheet (PDF) 📄 Offer letter ✓ Due diligence
Multi-family units
County records classify this as Multi-Family (2-4 Unit). Listing-text estimate: 1 unit. estimate disagrees with records
Listing remarks
INVESTMENT OPPORTUNITY! Welcome to 27 Sattler Ave - a versatile 2/1 East Side duplex backing up to Schiller Park that is currently configured as a two-unit home but offers excellent potential for conversion to a spacious single-family residence. Whether you're an investor seeking income-producing possibilities or a homeowner looking to create your dream home, the flexibility here is hard to match. The first-floor unit features a covered front porch, welcoming living room, formal dining room, two generously sized bedrooms, a full bathroom, and a kitchen with plenty of potential. Upstairs, the second unit is presently arranged as a studio with a kitchen, living area, and full bathroom. An ad
Key facts
- Covered front porch
- Formal dining room
- Two-unit home
Tags
Property features AI
Finance
- Financial info: Owner pays water; Rent includes water
- HOA & community: Operating expenses include snow removal, trash, and water/sewer
Exterior
- Parking: One parking space
- Utilities: Electricity connected (circuit breakers); High-speed internet available; Sewer connected; Public water connected
- Home design: Single-story building; Resale property
- Construction: Fiber cement exterior; Copper plumbing; Asphalt shingle roof; Block foundation; Existing (year built details)
- Exterior features: Fully fenced yard; Covered porch; Porch
Interior
- Kitchen: Oven/range; Refrigerator
- Bedrooms: Unit contains 2 bedrooms
- Flooring: Carpet; Hardwood; Laminate; Varies
- Bathrooms: 2 full bathrooms (total in property); Each unit includes 1 full bathroom
- Heating & cooling: Gas heating; Zoned heating; Baseboard heating; Zoned cooling; Window unit(s)
- Interior features: Leaded glass and storm windows; Accessible bedroom; Accessible approach with ramp; Accessible doors; Storage; Bedroom on main level; Programmable thermostat
- Laundry & utility: Washer hookup; Dryer included in unit description; Gas water heater
Neighborhood map
What this means for you Summary
Snapshot
- This is a 3-bed/2.0-bath multifamily listed at $80k.
Deal economics
- At list price, monthly cash flow is $1k ($16k/yr) — positive.
- The deal already cash-flows at list — no discount required.
- Meets the 1% rule at list price ($2k rent vs $80k).
- Cap rate 26.0% vs local median 8.1% in Buffalo — top-decile yield for the area; either an underpriced asset or a hidden risk that comps aren't pricing in. Stress-test before assuming the spread holds.
Location & tenants
- Location reads 77/100 on livability (#195 in NY, #3,011 nationally) — a middle-class / working-renter tenant base. Strengths: commute A+, housing A+, health & safety A+; Watch: crime F, employment D-.
- Buffalo City School District (urban): math 41% / reading 40% proficiency, ranked #535 of 590 in NY (top 91%) — families likely to look elsewhere, expect single-tenant / working-renter base with shorter leases; 75% free/reduced lunch — lower-income household profile, screen leases tightly.
- Zoned schools: International School (math 8% / reading 17%, grade F, #2,048 of 2,108 statewide, top 97%, 981 students, 92% FRL); Hutchinson Central Technical High School (math 96% / reading 32%, grade B-, #807 of 1,100 statewide, top 73%, 1,175 students, 78% FRL).
- Market conditions: 174 active listings in the ZIP; 13 comparable units currently listed for rent nearby; rentals at typical pace (median 26d on market — plan ~3-4 weeks tenant-placement turnaround); lower-income renter base — watch delinquency; 1,244 units permitted in Erie County in 2024 (563 in 5+ unit buildings).
- At $2,272/mo this rent would consume 75% of the median local household income ($36k/yr) (locally 1804% of renters already pay >50% of income on rent) — very limited rent-growth headroom before tenants either downsize or default.
Forward outlook
- In year one you build about $2k of equity ($553 loan paydown + $2k appreciation (2.0% local appreciation)).
- At projected returns (2.0% appreciation + 3.0% rent growth), your $22k cash investment doubles in ~2 years — after that, you're playing with house money.
Negotiation context
- Only 4 days on market — expect competitive offers; lowballing is unlikely to land.
Risks & watch-outs
- Watch-outs: built in 1933 — expect roof / HVAC / electrical / plumbing capex.
- Climate carrying-cost: moderate flood risk — expect insurance premiums to compound above CPI over the hold.
Questions for the listing agent
- Built in 1933 — when were the roof, HVAC, electrical panel, plumbing, and water heater last replaced?
- Is there a deadline driving the sale (1031 exchange, divorce, estate, relocation)? That informs how much negotiation room exists.
- Crime grade is F in this area — have there been break-ins, vandalism, or insurance claims at this property in the last 3 years? What carrier currently insures it and at what premium?
- What's the average days-on-market for RENTAL listings here right now (not sales)? A rising rental-DOM trend means longer vacancies and softer asking-rent achievability than the comps imply.
- What's the recent tenant-quality profile in this submarket — average credit score on applications, eviction rate, late-payment / NSF rate, and stable-employment percentage? A property-management company in the area should have these aggregated.
- How much new apartment / multifamily construction is in the pipeline within 1–3 miles? Heavy new supply (>2% of stock underway) typically softens rents 12–24 months out; light construction supports rent growth.
Investment metrics
- 1% rule
- 2.84% ✓
- Cap rate
- 25.97%
- Cash-on-cash
- 70.29%
- DSCR
- 4.13
- GRM
- 2.9
CMA / ARV
- ARV (on-the-fly)
- $94,611
- Comps found
- 12
Show comp detail 12 sales within ~0.75 mi
| Address | Dist | Beds/Ba | Sqft | Sold | Price | $/sf | Match |
|---|---|---|---|---|---|---|---|
| 60 Sattler Ave | 0.07mi | 4/2.0 (+1) | 1,746 (+13%) | 6mo | $94,500 | $54 | 66 |
| 99 Sattler Ave | 0.14mi | 4/2.0 (+1) | 1,390 (-10%) | 8mo | $82,500 | $59 | 64 |
| 20 Littlefield Ave | 0.37mi | 4/2.0 (+1) | 1,568 (+1%) | 15mo | $95,000 | $61 | 64 |
| 262 Sumner Pl | 0.33mi | 4/2.0 (+1) | 1,660 (+7%) | 11mo | $72,000 | $43 | 59 |
| 50 Newburgh Ave | 0.41mi | 4/2.0 (+1) | 1,519 (-2%) | 20mo | $135,000 | $89 | 56 |
| 213 Hagen St | 0.71mi | 4/2.0 (+1) | 1,509 (-3%) | 9mo | $150,000 | $99 | 50 |
| 78 Freund St | 0.63mi | 4/2.0 (+1) | 1,426 (-8%) | 3mo | $130,000 | $91 | 50 |
| 20 Ericson Ave | 0.69mi | 4/2.0 (+1) | 1,563 (+1%) | 16mo | $123,000 | $79 | 48 |
| 70 Kilhoffer St | 0.59mi | 4/2.0 (+1) | 1,591 (+3%) | 18mo | $90,000 | $57 | 48 |
| 2015 Bailey Ave | 0.39mi | 4/2.0 (+1) | 1,708 (+10%) | 20mo | $80,000 | $47 | 43 |
| 124 Newburgh Ave | 0.54mi | 4/2.0 (+1) | 1,750 (+13%) | 7mo | $95,000 | $54 | 43 |
| 129 Woodell Ave | 0.74mi | 4/2.0 (+1) | 1,748 (+13%) | 9mo | $192,500 | $110 | 32 |
Match score weights: distance 35% · size 25% · config 20% · recency 20%. Top-matched comps best support the ARV.
Projected returns pro-forma
2.05% appreciation · 3.0% rent growth · sell at horizon
- IRR
- 74.1%
- Equity multiple
- 4.98×
- Total profit
- $89,240
- Equity at exit
- $31,767
- IRR
- 74.3%
- Equity multiple
- 10.18×
- Total profit
- $205,688
- Equity at exit
- $45,909
Cash invested: $22,400 (down + closing). Projections, not guarantees.
Landlord ↔ Tenant lean methodology
- Overall (STATE)
- 15 Strongly Tenant-Friendly
- State New York
- 15 Strongly Tenant-Friendly · D+10
- County
- — inherits STATE
- City
- — inherits STATE
ZIP-level market 14211
- Home prices YoY
- 0.6%
- Active inventory
- 174
- Price-to-rent
- 5.7×
Monthly cashflow live
- Estimated rent
- $2,272 high interval (Pro) →
- Mortgage (P&I)
- −$420
- Tax from tax record
- −$30 /mo · $360/yr
- Insurance
- −$33
- HOA
- −$0
- Lot rent
- −$0
- Vacancy / Maint / Mgmt
- −$477
- Net cashflow
- $1,312
Break-even live
Sensitivity live
| Price | -10% $1,357 | -5% $1,335 | +0% $1,312 | +5% $1,289 | +10% $1,267 |
|---|---|---|---|---|---|
| Rent | -10% $1,133 | -5% $1,222 | +0% $1,312 | +5% $1,402 | +10% $1,492 |
| Rate | -1.0pp $1,352 | -0.5pp $1,332 | base $1,312 | +0.5pp $1,291 | +1.0pp $1,270 |
2-unit breakdown (identical units grouped — click to expand)
| Units | Beds | Baths | Est. rent |
|---|---|---|---|
| 1× unit | 2 | 1 | $1,163 |
| 1× unit | 1 | 1 | $1,108 |
| Total (2 units) | $2,272 | ||
UW: 25.0% down · 7.5% · 30yr · 1.5% tax · 5.0% vac · 8.0% maint · 8.0% mgmt
Financing live
Cash to close
- Down payment
- $20,000
- Closing costs
- $2,400
- Reserves months
- —
- Total cash needed
- —
Loan-product check · same deal, 3 products live
Conventional
25% down · 7.5% · 30yr
- Down + closing
- —
- Monthly P&I
- —
- Monthly cashflow
- —
- DSCR
- —
- Eligible?
- —
Personal DTI + credit; lowest rate.
DSCR
20% down · 8.5% · 30yr
- Down + closing
- —
- Monthly P&I
- —
- Monthly cashflow
- —
- DSCR
- —
- Eligible?
- —
No personal income docs; deal must DSCR.
Hard money
10% down · 12.0% · 12mo
- Down + closing
- —
- Monthly P&I
- —
- Monthly cashflow
- —
- DSCR
- —
- Eligible?
- —
Short-term bridge; refi at stabilization.
Rent comps 13 comps
| Address | Beds | Baths | Sqft | Rent | $/sqft | DOM | Units | Dist |
|---|---|---|---|---|---|---|---|---|
| 96 Academy Rd Buffalo, NY | 3.0 | 1.0 | 2247 | $1,400 | $0.62 | 26d | 1 | 0.16mi |
| 65 Domedion Ave Buffalo, NY | 3.0 | 1.0 | 1632 | $1,500 | $0.92 | 0d | 1 | 0.38mi |
| 979 Walden Ave Buffalo, NY | 4.0 | 3.0 | 1793 | $2,000 | $1.12 | 0d | 1 | 0.44mi |
| 24 Euclid Ave Buffalo, NY | 3.0 | 2.0 | 1150 | $1,700 | $1.48 | 46d | 1 | 0.47mi |
| 216 Newburgh Ave Buffalo, NY | 2.0 | 1.0 | 1690 | $1,150 | $0.68 | 26d | 1 | 0.68mi |
| 1202 Walden Ave Unit 3 Buffalo, NY | 3.0 | 1.0 | 1500 | $1,400 | $0.93 | 19d | 1 | 0.77mi |
| 517 Goodyear Ave Buffalo, NY | 3.0 | 1.0 | 1559 | $1,800 | $1.15 | 21d | 1 | 0.82mi |
| 408 Koons Ave Unit Lower Buffalo, NY | 3.0 | 2.0 | 1150 | $1,050 | $0.91 | 0d | 1 | 0.82mi |
| 143 Reo Ave Buffalo, NY | 3.0 | 2.0 | 1143 | $1,600 | $1.40 | 14d | 1 | 0.91mi |
| 1777 Broadway Unit 2 Buffalo, NY | 3.0 | 1.0 | 1300 | $1,200 | $0.92 | 46d | 1 | 0.96mi |
| 71 Gerald Ave Buffalo, NY | 2.0 | 1.0 | 1773 | $1,100 | $0.62 | 46d | 1 | 0.99mi |
| 110 Gerald Ave Buffalo, NY | 2.0 | 1.0 | 2098 | $1,100 | $0.52 | 26d | 1 | 1.01mi |
| 74 Dorris Ave Buffalo, NY | 3.0 | 1.0 | 1200 | $1,450 | $1.21 | 46d | 1 | 1.17mi |
Listing history 4 events
-
2026-06-22days on market $79,999 Active 4 DOM
-
2026-06-21days on market $79,999 Active 3 DOM
-
2026-06-19remarks 699-char remark
-
2026-06-19$79,999 Active 1 DOM
ⓘ Source: listings_history table (triggers on properties + properties_extension) + one-shot
backfill from property_details.listing_events for pre-trigger history.
Tax reassessment forecast NY · Partial reset (capped growth)
- Current annual tax
- $360 · $30/mo
- Projected year-2 tax
- $856 · $71/mo
- Expected delta
- +$496/yr (+$41/mo · 137.8%)
ⓘ Screening estimate from a state-policy table — verify with the county assessor before closing.
Climate risk First Street
- Flood 5/10 Major FEMA zone X (unshaded) · 51% chance over 30 yrs
- Wildfire 2/10 Low
- Heat 3/10 Moderate 7 d/yr ≥93°F today · 15 d/yr by 30 yrs out
- Wind 1/10 Low
- Air quality 3/10 Moderate 2 unhealthy d/yr today · 3 by 30 yrs out
Nearby sold comps map
Loading sold comps map…
Walkable amenities ~0.75 mi
Loading nearby amenities…
Taxation est. · year 1
- Rental income
- $27,264
- − Mortgage interest
- −$4,481
- − Property taxes
- −$360
- − Insurance
- −$400
- − Repairs & maintenance
- −$2,181
- − Management
- −$2,181
- − Depreciation
- −$2,327
- Taxable income
- $15,333
- Est. tax owed @ 24.0%
- −$3,680
- After-tax cash flow
- $12,064/yr
For passive investors: Depreciation is non-cash, so a rental often shows a tax loss while cash-flowing — sheltering income. Rental losses are passive: they offset passive income freely, and up to $25,000/yr can offset ordinary (W-2) income if you actively participate and your MAGI is under $100k (phasing out to $0 by $150k); unused losses carry forward. On sale, claimed depreciation is recaptured at up to 25%, and gains may owe capital-gains tax (a 1031 exchange can defer both). Figures are a year-1 estimate at your 24.0% rate — not tax advice; consult a CPA.
Schools (NCES district)
- District
- Buffalo City School District
- NCES district ID
- 3605850
- Math proficiency
- 41% ▲ 11.00%
- Reading proficiency
- 40% ▲ 7.00%
- Median HH income
- $31,665
- Composite
- 33.17/100
- National rank
- #5544
- State rank
- #535 of 590 in NY
Livability — Buffalo
- Score
- 77/100
- State rank
- #195
- US rank
- #3011
Category grades
Schools grade is shown separately in the Schools card above.
Census & demographics
- Census place
- Buffalo, NY
- County
- Erie County · 714,559 people
- City population
- 440,021
- Metro
- Buffalo-Cheektowaga, NY
- Population (ZIP)
- 24,663
- Household income
- $36,300
- Rent vs Own
- Severe rent burden
- 1804.0
Population outlook (Erie County) Hauer SSP2
- Today (2025)
- 933,037 people
- By 2030
- 935,181 · +0.2%
- By 2040
- 928,531 · -0.5%
- By 2050
- 905,725 · -2.9%
- By 2075
- 834,037 · -10.6%
- By 2100
- 708,033 · -24.1%
Race, ethnicity, and origin ACS 2023
- Neighborhood character
- Diverse neighborhood (Simpson 0.60)
- Race & ethnicity
- Black 59% Asian 20% Hispanic / Latino 9% White 9% Two or more races 5%
- Hispanic origin (detail)
- Puerto Rican 6%
- Common ancestry
- Romanian 4%
- Foreign-born
- 17% · Canada, Philippines, Vietnam
- Languages at home
- 74% English-only · Other Indo-European 14% Spanish 6% Other Asian/Pacific 1%
Political lean MEDSL · Erie
- 2024 margin
- Lean D (+9.7) · D 54.8% · R 45.2%
- 2008→2024 swing
- -7.9pp toward R · 2008: 17.5pp · 2024: 9.7pp
- All cycles
- 2024: D+9.7 2020: D+14.7 2016: D+4.8 2012: D+15.6 2008: D+17.5
Not yet ingested
- Civics
- —
Market trends
- HPI YoY
- ▲ 2.05%
- Current HPI
- 357.6438
- Rent YoY
- —
- Metro
- Buffalo-Cheektowaga, NY
- State GDP YoY
- ▲ 2.60%
- F500 in state
- 92
Industry mix (Fortune 500 HQ in NY)
| Industry | F500 HQs | Revenue |
|---|---|---|
| Financial Services | 10 | $950B |
|
||
| Consumer Goods | 9 | $162B |
|
||
| Insurance | 4 | $225B |
|
||
| Telecommunications | 2 | $144B |
|
||
| Pharmaceuticals | 2 | $112B |
|
||
| Media / Entertainment | 2 | $69B |
|
||
Price history
1 event — show timeline
- 2026-06-18 Listed $79,999 WNYREIS
Property tax history
+10.5%/yrLatest (2025): $360 · +49.4% YoY. Source: county tax records.
Cash-flow waterfall
monthlySold comps — $/sqft
last 12 mo · ≤1 miLoading sold comps…