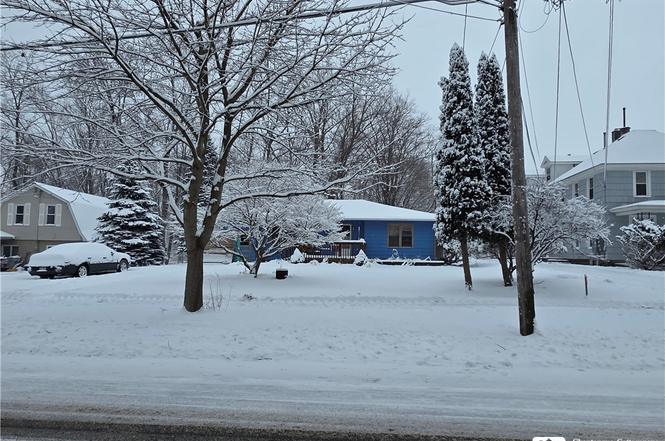
62 Seymour St · Fredonia, NY
Flood risk 1/10 · Minimal
- FEMA flood zone
- X
- Chance of flooding over 30 yrs
- 0.0%
- Est. flood insurance / yr
- $473 – $860
Fire risk 1/10 · Minimal
- Est. fire insurance / yr
- $691 – $1,283
Heat risk 2/10 · Minimal
- Hot days now (above 93°F)
- 7 days/yr
- Hot days in 30 yrs
- 17 days/yr
Wind risk 1/10 · Minimal
- Chance of severe wind over 30 yrs
- —
Air-quality risk 2/10 · Minimal
- Unhealthy air days now
- 1 days/yr
- Unhealthy air days in 30 yrs
- 2 days/yr
Risk factors via First Street. Map © Google.
Why this score? — see what drove the B- grade
The composite is a weighted blend of 9 inputs, each scored 0–100. Each bar is that input's sub-score; the figure is the points it added to the 100-point composite (weight × sub-score).
- Cash flow +26.7/30.0
- 1% rule +10.0/10.0
- DSCR +9.2/10.0
- ARV discount +7.5/15.0
- Schools +4.3/10.0
- Livability +4.0/5.0
- Rent growth +2.5/5.0
- Condition / age +2.5/5.0
- Appreciation +0.0/10.0
$88,600
🖨 Deal sheet (PDF) 📄 Offer letter ✓ Due diligence
Listing remarks
Nice, 3 bedroom, 1 bath, home that needs some tender loving care. Great location. Home to be "Sold As Is". Fredonia Schools. SHORT SALE. Subject to Medicaid Approval. Please include the phrase, "Subject to Medicaid Approval, " on all written offers. Offers should be submitted by 5:00 p. m. Monday, June 22, 2026. Call listing agent for showing instructions - 716.785.5531.
Key facts
- 0.26 acre lot
- Garage
- Built 1960
Property features AI
Exterior
- Parking: Attached garage (1 car)
- Utilities: Public water connected; Sewer connected
- Home design: Single-story home; Frame construction; Resale property
- Construction: Frame construction; Block foundation; Existing (built previously)
- Exterior features: Deck; Dirt driveway; Near public transit; Rectangular residential lot; City street frontage
Interior
- Kitchen: Dishwasher; Electric cooktop; Microwave; Refrigerator
- Bedrooms: Three main-level bedrooms
- Flooring: Hardwood; Varied flooring
- Bathrooms: One full bathroom on the main level
- Heating & cooling: Gas forced-air heating
- Interior features: Country kitchen; Bedroom on main level; Full basement
- Laundry & utility: Gas water heater
Neighborhood map
What this means for you Summary
Snapshot
- This is a 3-bed/1.5-bath single-family listed at $89k.
Deal economics
- At list price, monthly cash flow is $239 ($3k/yr) — positive.
- The deal already cash-flows at list — no discount required.
- Meets the 1% rule at list price ($1k rent vs $89k).
- Cap rate 9.5% vs local median 3.3% in Fredonia — top-decile yield for the area; either an underpriced asset or a hidden risk that comps aren't pricing in. Stress-test before assuming the spread holds.
Location & tenants
- Location reads 81/100 on livability (#95 in NY, #1,446 nationally) — a professional / high-income tenant draw. Strengths: housing A+, health & safety A+, commute A; Watch: amenities C-, employment C-, crime F.
- Fredonia Central School District (town): math 55% / reading 46% proficiency, ranked #376 of 590 in NY (top 64%) — acceptable for families but not a draw, mixed tenant base, ~2y average lease.
- Market conditions: 92 active listings in the ZIP; 1 comparable units currently listed for rent nearby; 127 units permitted in Chautauqua County in 2024 (0 in 5+ unit buildings).
Forward outlook
- Local home prices are declining (-3.0%/yr); year-one equity from $613 of loan paydown is wiped out by about $3k of value loss. Plan a longer hold.
- Chautauqua County population projected at -22% by 2050 — secular population decline; favor cash flow + early exit over multi-decade hold.
- At projected returns (-3.0% appreciation + 3.0% rent growth), your $25k cash investment doubles in ~10 years — after that, you're playing with house money.
Negotiation context
- Only 5 days on market — expect competitive offers; lowballing is unlikely to land.
Risks & watch-outs
- Watch-outs: property tax is 4.9% of price.
Questions for the listing agent
- Built in 1960 — when were the roof, HVAC, electrical panel, plumbing, and water heater last replaced?
- Property tax is high relative to price — has the assessment been appealed recently, and will the sale trigger a re-assessment?
- Is there a deadline driving the sale (1031 exchange, divorce, estate, relocation)? That informs how much negotiation room exists.
- Schools are A-rated — typically a magnet for longer-tenancy family renters. What's the average tenant stay here, and is there a school-zone premium baked into asking?
- Crime grade is F in this area — have there been break-ins, vandalism, or insurance claims at this property in the last 3 years? What carrier currently insures it and at what premium?
- What's the average days-on-market for RENTAL listings here right now (not sales)? A rising rental-DOM trend means longer vacancies and softer asking-rent achievability than the comps imply.
- What's the recent tenant-quality profile in this submarket — average credit score on applications, eviction rate, late-payment / NSF rate, and stable-employment percentage? A property-management company in the area should have these aggregated.
- How much new for-sale + rental construction is in the pipeline within 1–3 miles? Heavy new supply typically softens prices + rents 12–24 months out; constrained supply supports both.
Investment metrics
- 1% rule
- 1.58% ✓
- Cap rate
- 9.54%
- Cash-on-cash
- 11.58%
- DSCR
- 1.52
- GRM
- 5.3
CMA / ARV
- ARV (on-the-fly)
- $179,564
- Comps found
- 10
Show comp detail 10 sales within ~0.75 mi
| Address | Dist | Beds/Ba | Sqft | Sold | Price | $/sf | Match |
|---|---|---|---|---|---|---|---|
| 93 Seymour St | 0.04mi | 3/1.0 | 1,120 (-4%) | 2mo | $180,200 | $161 | 88 |
| 97 Seymour St | 0.06mi | 2/1.5 (-1) | 1,140 (-2%) | 6mo | $205,000 | $180 | 84 |
| 32 Chautauqua St | 0.20mi | 3/1.5 | 1,108 (-5%) | 1mo | $130,000 | $117 | 82 |
| 23 Pine Dr | 0.32mi | 3/1.0 | 1,208 (+4%) | 18mo | $185,500 | $154 | 62 |
| 113 Howard St | 0.15mi | 3/1.0 | 1,296 (+11%) | 19mo | $76,000 | $59 | 57 |
| 31 Summer St | 0.17mi | 3/1.5 | 1,020 (-12%) | 21mo | $42,000 | $41 | 54 |
| 206 Seymour St | 0.39mi | 3/1.0 | 1,080 (-7%) | 21mo | $200,000 | $185 | 50 |
| 117 Eagle St | 0.71mi | 3/1.0 | 1,040 (-11%) | 13mo | $143,100 | $138 | 36 |
| 125 Forest Pl | 0.71mi | 3/1.5 | 1,260 (+8%) | 23mo | $165,000 | $131 | 34 |
| 204 Berry Rd | 0.73mi | 2/1.0 (-1) | 1,008 (-14%) | 7mo | $215,000 | $213 | 31 |
Match score weights: distance 35% · size 25% · config 20% · recency 20%. Top-matched comps best support the ARV.
Projected returns pro-forma
-3.0% appreciation · 3.0% rent growth · sell at horizon
- IRR
- 1.1%
- Equity multiple
- 1.04×
- Total profit
- $1,073
- Equity at exit
- $13,211
- IRR
- 10.9%
- Equity multiple
- 1.86×
- Total profit
- $21,295
- Equity at exit
- $7,661
Cash invested: $24,808 (down + closing). Projections, not guarantees.
Landlord ↔ Tenant lean methodology
- Overall (STATE)
- 15 Strongly Tenant-Friendly
- State New York
- 15 Strongly Tenant-Friendly · D+10
- County
- — inherits STATE
- City
- — inherits STATE
ZIP-level market 14063
- Home prices YoY
- -23.6%
- Active inventory
- 92
- Price-to-rent
- 5.3×
Monthly cashflow live
- Estimated rent
- $1,400 medium interval (Pro) →
- Mortgage (P&I)
- −$465
- Tax from tax record
- −$365 /mo · $4,380/yr
- Insurance
- −$37
- HOA
- −$0
- Vacancy / Maint / Mgmt
- −$294
- Net cashflow
- $239
Break-even live
Sensitivity live
| Price | -10% $555 | -5% $524 | +0% $239 | +5% $214 | +10% $189 |
|---|---|---|---|---|---|
| Rent | -10% $129 | -5% $184 | +0% $239 | +5% $295 | +10% $350 |
| Rate | -1.0pp $284 | -0.5pp $262 | base $239 | +0.5pp $217 | +1.0pp $193 |
UW: 25.0% down · 7.5% · 30yr · 1.5% tax · 5.0% vac · 8.0% maint · 8.0% mgmt
Financing live
Cash to close
- Down payment
- $22,150
- Closing costs
- $2,658
- Reserves months
- —
- Total cash needed
- —
Loan-product check · same deal, 3 products live
Conventional
25% down · 7.5% · 30yr
- Down + closing
- —
- Monthly P&I
- —
- Monthly cashflow
- —
- DSCR
- —
- Eligible?
- —
Personal DTI + credit; lowest rate.
DSCR
20% down · 8.5% · 30yr
- Down + closing
- —
- Monthly P&I
- —
- Monthly cashflow
- —
- DSCR
- —
- Eligible?
- —
No personal income docs; deal must DSCR.
Hard money
10% down · 12.0% · 12mo
- Down + closing
- —
- Monthly P&I
- —
- Monthly cashflow
- —
- DSCR
- —
- Eligible?
- —
Short-term bridge; refi at stabilization.
Rent comps 1 comps
| Address | Beds | Baths | Sqft | Rent | $/sqft | DOM | Units | Dist |
|---|---|---|---|---|---|---|---|---|
| 188 W Main St Fredonia, NY | 2.0 | 1.0 | 1000 | $1,400 | $1.40 | 44d | 1 | 0.17mi |
Listing history 5 events
-
2026-06-21days on market $88,600 Active 5 DOM
-
2026-06-18days on market $88,600 Active 3 DOM
-
2026-06-17days on market $88,600 Active 2 DOM
-
2026-06-16remarks 373-char remark
-
2026-06-16$88,600 Active 1 DOM
ⓘ Source: listings_history table (triggers on properties + properties_extension) + one-shot
backfill from property_details.listing_events for pre-trigger history.
Tax reassessment forecast NY · Partial reset (capped growth)
- Current annual tax
- $4,380 · $365/mo
- Projected year-2 tax
- $4,380 · $365/mo
- Expected delta
- $0/yr ($0/mo · 0.0%)
ⓘ Screening estimate from a state-policy table — verify with the county assessor before closing.
Climate risk First Street
- Flood 1/10 Low FEMA zone X · 0% chance over 30 yrs
- Wildfire 1/10 Low
- Heat 2/10 Low 7 d/yr ≥93°F today · 17 d/yr by 30 yrs out
- Wind 1/10 Low
- Air quality 2/10 Low 1 unhealthy d/yr today · 2 by 30 yrs out
Nearby sold comps map
Loading sold comps map…
Walkable amenities ~0.75 mi
Loading nearby amenities…
Taxation est. · year 1
- Rental income
- $16,800
- − Mortgage interest
- −$4,963
- − Property taxes
- −$4,380
- − Insurance
- −$443
- − Repairs & maintenance
- −$1,344
- − Management
- −$1,344
- − Depreciation
- −$2,577
- Taxable income
- $1,749
- Est. tax owed @ 24.0%
- −$420
- After-tax cash flow
- $2,454/yr
For passive investors: Depreciation is non-cash, so a rental often shows a tax loss while cash-flowing — sheltering income. Rental losses are passive: they offset passive income freely, and up to $25,000/yr can offset ordinary (W-2) income if you actively participate and your MAGI is under $100k (phasing out to $0 by $150k); unused losses carry forward. On sale, claimed depreciation is recaptured at up to 25%, and gains may owe capital-gains tax (a 1031 exchange can defer both). Figures are a year-1 estimate at your 24.0% rate — not tax advice; consult a CPA.
Schools (NCES district)
- District
- Fredonia Central School District
- NCES district ID
- 3611520
- Math proficiency
- 55% ▼ -8.00%
- Reading proficiency
- 46% ▼ -8.00%
- Median HH income
- $48,491
- Composite
- 43.1/100
- National rank
- #3086
- State rank
- #376 of 590 in NY
Livability — Fredonia
- Score
- 81/100
- State rank
- #95
- US rank
- #1446
Category grades
Schools grade is shown separately in the Schools card above.
Census & demographics
- Census place
- Fredonia, NY
- Population (ZIP)
- 12,722
Population outlook (Chautauqua County) Hauer SSP2
- Today (2025)
- 123,454 people
- By 2030
- 118,509 · -4.0%
- By 2040
- 107,311 · -13.1%
- By 2050
- 96,703 · -21.7%
- By 2075
- 76,757 · -37.8%
- By 2100
- 60,984 · -50.6%
Race, ethnicity, and origin ACS 2023
- Neighborhood character
- Predominantly White (83%)
- Race & ethnicity
- White 83% Hispanic / Latino 8% Two or more races 5% Black 3% Asian 2%
- Hispanic origin (detail)
- Puerto Rican 5%
- Common ancestry
- Romanian 14% Italian 3% Iranian 1%
- Foreign-born
- 4% · Canada, China
- Languages at home
- 92% English-only · Spanish 5% Chinese 1% Other Indo-European 1%
Political lean MEDSL · Chautauqua
- 2024 margin
- Strong R (+22.0) · D 39.0% · R 61.0%
- 2008→2024 swing
- -22.9pp toward R · 2008: 0.9pp · 2024: -22.0pp
- All cycles
- 2024: R+22.0 2020: R+19.8 2016: R+24.6 2012: R+8.2 2008: D+0.9
Not yet ingested
- Civics
- —
Market trends
- HPI YoY
- ▼ -78.55%
- Current HPI
- 253.5334
- Rent YoY
- —
- Metro
- —
- State GDP YoY
- ▲ 2.60%
- F500 in state
- 92
Industry mix (Fortune 500 HQ in NY)
| Industry | F500 HQs | Revenue |
|---|---|---|
| Financial Services | 10 | $950B |
|
||
| Consumer Goods | 9 | $162B |
|
||
| Insurance | 4 | $225B |
|
||
| Telecommunications | 2 | $144B |
|
||
| Pharmaceuticals | 2 | $112B |
|
||
| Media / Entertainment | 2 | $69B |
|
||
Price history
1 event — show timeline
- 2026-06-15 Listed $88,600 UNYREIS
Property tax history
+7.5%/yrLatest (2025): $4,380 · +11.2% YoY. Source: county tax records.
Cash-flow waterfall
monthlySold comps — $/sqft
last 12 mo · ≤1 miLoading sold comps…