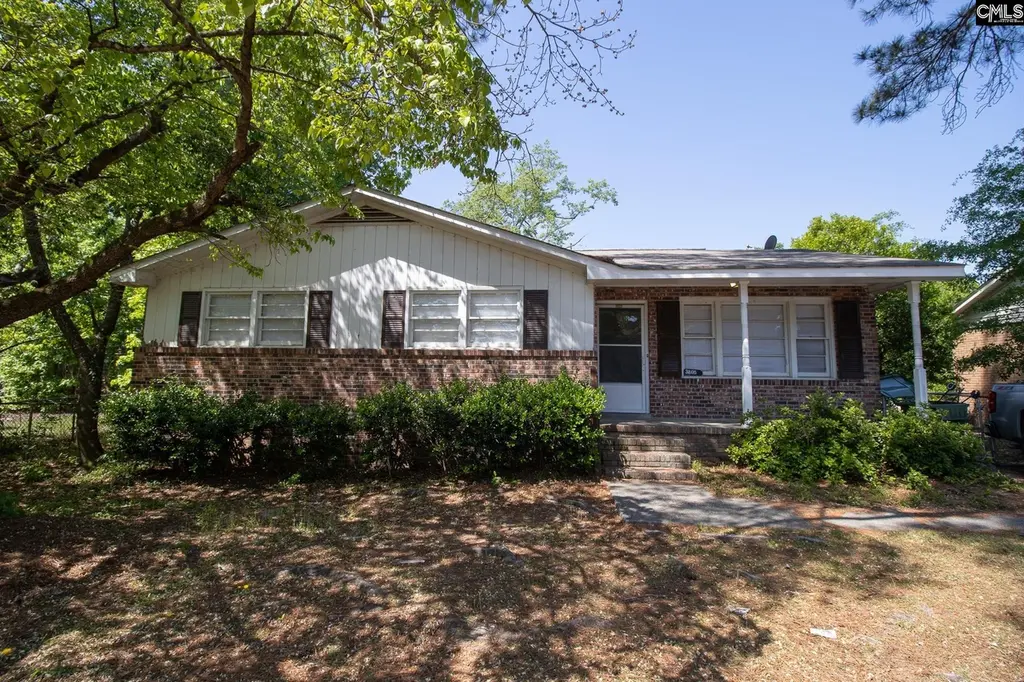
3805 Trotter Rd · Columbia, SC
Flood risk No data
- FEMA flood zone
- —
- Chance of flooding over 30 yrs
- —
- Est. flood insurance / yr
- —
Fire risk No data
- Est. fire insurance / yr
- —
Heat risk No data
- Hot days now (above threshold)
- —
- Hot days in 30 yrs
- —
Wind risk No data
- Chance of severe wind over 30 yrs
- —
Air-quality risk No data
- Unhealthy air days now
- —
- Unhealthy air days in 30 yrs
- —
Risk factors via First Street. Map © Google.
Why this score? — see what drove the C grade
The composite is a weighted blend of 9 inputs, each scored 0–100. Each bar is that input's sub-score; the figure is the points it added to the 100-point composite (weight × sub-score).
- Cash flow +25.2/30.0
- DSCR +8.3/10.0
- ARV discount +7.5/15.0
- 1% rule +6.0/10.0
- Livability +3.9/5.0
- Rent growth +3.0/5.0
- Schools +2.6/10.0
- Condition / age +2.5/5.0
- Appreciation +0.0/10.0
$155,000
🖨 Deal sheet (PDF) 📄 Offer letter ✓ Due diligence
Listing remarks
Charming brick ranch-style home featuring 3 bedrooms and 1.5 bathrooms with a functional layout and timeless appeal. Enjoy a spacious yard perfect for outdoor entertaining, gardening, or relaxing. Conveniently located near shopping, dining, schools, and everyday amenities, this property is a great opportunity for first-time homebuyers, downsizers, or investors alike. Disclaimer: CMLS has not reviewed and, therefore, does not endorse vendors who may appear in listings.
Key facts
- Spacious yard
- Outdoor entertaining
- Conveniently located
Tags
Property features AI
Finance
- Other: Cable TV available
Exterior
- Utilities: Public water; Public sewer; Storm doors
- Home design: Single-story home
- Construction: Crawlspace foundation
- Exterior features: Covered front porch; Partial brick exterior above foundation; Rear chain-link fence
Interior
- Kitchen: Eat-in kitchen; Formica countertops; Stained wood cabinets; Luxury vinyl plank flooring; Free-standing gas range; Refrigerator included
- Bedrooms: Master bedroom on main level with private bath and luxury vinyl plank flooring; Bedroom 2 on main level with shared bath and luxury vinyl plank flooring; Bedroom 3 on main level with shared bath and luxury vinyl plank flooring
- Flooring: Luxury vinyl plank flooring throughout main living areas and bedrooms
- Bathrooms: One full bathroom; One half bathroom
- Heating & cooling: Central heating; Central air conditioning
- Interior features: Smoke detector; Pull-down attic access
Neighborhood map
What this means for you Summary
Snapshot
- This is a 3-bed/1.0-bath single-family listed at $155k.
Deal economics
- At list price, monthly cash flow is $346 ($4k/yr) — positive.
- The deal already cash-flows at list — no discount required.
- Meets the 1% rule at list price ($2k rent vs $155k).
- Recommended offer: $150k (3.0% below list) — sets the bar for market timing.
- Cap rate 9.0% vs local median 5.0% in Columbia — top-decile yield for the area; either an underpriced asset or a hidden risk that comps aren't pricing in. Stress-test before assuming the spread holds.
Location & tenants
- Location reads 78/100 on livability (#18 in SC, #2,436 nationally) — a middle-class / working-renter tenant base. Strengths: amenities A+, commute A+, cost of living A+; Watch: employment D, crime F.
- Richland 01 (urban): math 26% / reading 36% proficiency, ranked #54 of 80 in SC (top 68%) — families likely to look elsewhere, expect single-tenant / working-renter base with shorter leases; 64% free/reduced lunch — lower-income household profile, screen leases tightly.
- Zoned schools: Caughman Road Elementary (math 22% / reading 27%, grade F, #452 of 597 statewide, top 78%, 707 students, 100% FRL); Hopkins Middle (math 8% / reading 17%, grade F, #213 of 229 statewide, top 94%, 493 students, 100% FRL); Lower Richland High (math 5% / reading 64%, grade F, #185 of 196 statewide, top 94%, 1,244 students, 100% FRL) — zoned schools average 100% FRL vs 64% district-wide (36 pts higher); higher-poverty schools than district average — tighter screening recommended.
- Market conditions: Rents rising (+2.1%/yr); 298 active listings in the ZIP; 9 comparable units currently listed for rent nearby; rentals at typical pace (median 25d on market — plan ~3-4 weeks tenant-placement turnaround); 3,472 units permitted in Richland County in 2024 (1,096 in 5+ unit buildings).
- This rent runs 35% of the median local income ($59k/yr) — at the standard rent-burdened threshold; future hikes will face affordability resistance.
Forward outlook
- Local home prices are declining (-3.0%/yr); year-one equity from $1k of loan paydown is wiped out by about $5k of value loss. Plan a longer hold.
- Richland County population projected at +30% by 2050 — long-run rental-demand tailwind backs the buy-and-hold thesis.
Negotiation context
- It's been on market 32 days — a 3% lower offer ($150k) is reasonable based on typical stale-listing flexibility.
- 2 sale attempts since 2y ago with the ask held roughly flat each time — persistent listings suggest the price (not the market) is what's stuck; bring a comps-based counter.
- Current owner paid $43k; list at $155k implies a 260% gain — meaningful room to come down on a strong offer.
Questions for the listing agent
- It's been on market 32 days. Have you received any prior offers? Is the seller open to a 3% concession, seller financing, or rate buy-down credit?
- Built in 1972 — when were the roof, HVAC, electrical panel, plumbing, and water heater last replaced?
- Is there a deadline driving the sale (1031 exchange, divorce, estate, relocation)? That informs how much negotiation room exists.
- Schools are D-rated, which usually means shorter tenancies and higher turnover. Who's the typical renter profile here, and what's been the actual vacancy rate?
- Crime grade is F in this area — have there been break-ins, vandalism, or insurance claims at this property in the last 3 years? What carrier currently insures it and at what premium?
- What's the average days-on-market for RENTAL listings here right now (not sales)? A rising rental-DOM trend means longer vacancies and softer asking-rent achievability than the comps imply.
- What's the recent tenant-quality profile in this submarket — average credit score on applications, eviction rate, late-payment / NSF rate, and stable-employment percentage? A property-management company in the area should have these aggregated.
- How much new for-sale + rental construction is in the pipeline within 1–3 miles? Heavy new supply typically softens prices + rents 12–24 months out; constrained supply supports both.
Investment metrics
- 1% rule
- 1.10% ✓
- Cap rate
- 8.97%
- Cash-on-cash
- 9.57%
- DSCR
- 1.43
- GRM
- 7.5
CMA / ARV
No comps found within radius.
Projected returns pro-forma
-3.0% appreciation · 2.08% rent growth · sell at horizon
- IRR
- -2.9%
- Equity multiple
- 0.89×
- Total profit
- $-4,654
- Equity at exit
- $23,111
- IRR
- 5.8%
- Equity multiple
- 1.41×
- Total profit
- $17,953
- Equity at exit
- $13,402
Cash invested: $43,400 (down + closing). Projections, not guarantees.
Landlord ↔ Tenant lean methodology
- Overall (STATE)
- 90 Strongly Landlord-Friendly
- State South Carolina
- 90 Strongly Landlord-Friendly · R+6
- County
- — inherits STATE
- City
- — inherits STATE
ZIP-level market 29209
- Rents YoY
- 2.1%
- Active inventory
- 298
- Price-to-rent
- 7.5×
Monthly cashflow live
- Estimated rent
- $1,712 high interval (Pro) →
- Mortgage (P&I)
- −$813
- Tax from tax record
- −$129 /mo · $1,549/yr
- Insurance
- −$65
- HOA
- −$0
- Vacancy / Maint / Mgmt
- −$360
- Net cashflow
- $346
Break-even live
Sensitivity live
| Price | -10% $434 | -5% $390 | +0% $346 | +5% $302 | +10% $258 |
|---|---|---|---|---|---|
| Rent | -10% $211 | -5% $279 | +0% $346 | +5% $414 | +10% $481 |
| Rate | -1.0pp $424 | -0.5pp $386 | base $346 | +0.5pp $306 | +1.0pp $265 |
UW: 25.0% down · 7.5% · 30yr · 1.5% tax · 5.0% vac · 8.0% maint · 8.0% mgmt
Financing live
Cash to close
- Down payment
- $38,750
- Closing costs
- $4,650
- Reserves months
- —
- Total cash needed
- —
Loan-product check · same deal, 3 products live
Conventional
25% down · 7.5% · 30yr
- Down + closing
- —
- Monthly P&I
- —
- Monthly cashflow
- —
- DSCR
- —
- Eligible?
- —
Personal DTI + credit; lowest rate.
DSCR
20% down · 8.5% · 30yr
- Down + closing
- —
- Monthly P&I
- —
- Monthly cashflow
- —
- DSCR
- —
- Eligible?
- —
No personal income docs; deal must DSCR.
Hard money
10% down · 12.0% · 12mo
- Down + closing
- —
- Monthly P&I
- —
- Monthly cashflow
- —
- DSCR
- —
- Eligible?
- —
Short-term bridge; refi at stabilization.
Rent comps 9 comps
| Address | Beds | Baths | Sqft | Rent | $/sqft | DOM | Units | Dist |
|---|---|---|---|---|---|---|---|---|
| 313 Shoreditch Dr Columbia, SC | 3.0 | 1.5 | 1056 | $1,775 | $1.68 | 25d | 1 | 0.21mi |
| 305 Shoreditch Dr Columbia, SC | 3.0 | 1.5 | 1378 | $1,586 | $1.15 | 20d | 1 | 0.22mi |
| 302 Crooked Pine Ct Columbia, SC | 3.0 | 2.0 | 1399 | $1,883 | $1.35 | 25d | 1 | 0.42mi |
| 385 Saskatoon Dr Unit 385 Columbia, SC | 3.0 | 2.0 | 1330 | $2,000 | $1.50 | 25d | 1 | 0.53mi |
| 329 Ovanta Rd Columbia, SC | 3.0 | 1.5 | 1100 | $1,200 | $1.09 | 25d | 1 | 0.75mi |
| 4022 Ulmer Rd Columbia, SC | 2.0–3.0 | 1.0–2.0 | 1202 | $1,322 | $1.10 | 20d | 1 | 0.76mi |
| 101 Shagbark Ave Columbia, SC | 3.0 | 1.0 | 1000 | $1,295 | $1.29 | 20d | 1 | 0.78mi |
| 429 Mockernut Ln Columbia, SC | 3.0 | 1.0 | 1010 | $1,250 | $1.24 | 25d | 1 | 0.78mi |
| 2705 Prince Charles Ct Columbia, SC | 4.0 | 2.0 | 1466 | $1,906 | $1.30 | 25d | 1 | 1.47mi |
Listing history 19 events
-
2026-06-21days on market $155,000 Active 32 DOM
-
2026-06-18days on market $155,000 Active 29 DOM
-
2026-06-17days on market $155,000 Active 28 DOM
-
2026-06-16days on market $155,000 Active 27 DOM
-
2026-06-15days on market $155,000 Active 26 DOM
-
2026-06-14days on market $155,000 Active 24 DOM
-
2026-06-10days on market $155,000 Active 21 DOM
-
2026-06-09days on market $155,000 Active 20 DOM
-
2026-06-08days on market $155,000 Active 19 DOM
-
2026-06-07days on market $155,000 Active 18 DOM
-
2026-06-03days on market $155,000 Active 14 DOM
-
2026-06-03days on market $155,000 Active 13 DOM
-
2026-06-01days on market $155,000 Active 12 DOM
-
2026-05-31days on market $155,000 Active 11 DOM
-
2026-05-18$155,000 Active
-
2025-03-09historical $1,300
-
2024-10-15$1,300
-
2023-07-16historical
-
1987-11-01soldstatus $43,000
ⓘ Source: listings_history table (triggers on properties + properties_extension) + one-shot
backfill from property_details.listing_events for pre-trigger history.
Tax reassessment forecast SC · Resets to sale price
- Current annual tax
- $1,549 · $129/mo
- Projected year-2 tax
- $1,549 · $129/mo
- Expected delta
- $0/yr ($0/mo · 0.0%)
ⓘ Screening estimate from a state-policy table — verify with the county assessor before closing.
Nearby sold comps map
Loading sold comps map…
Walkable amenities ~0.75 mi
Loading nearby amenities…
Taxation est. · year 1
- Rental income
- $20,547
- − Mortgage interest
- −$8,682
- − Property taxes
- −$1,549
- − Insurance
- −$775
- − Repairs & maintenance
- −$1,644
- − Management
- −$1,644
- − Depreciation
- −$4,509
- Taxable income
- $1,744
- Est. tax owed @ 24.0%
- −$419
- After-tax cash flow
- $3,735/yr
For passive investors: Depreciation is non-cash, so a rental often shows a tax loss while cash-flowing — sheltering income. Rental losses are passive: they offset passive income freely, and up to $25,000/yr can offset ordinary (W-2) income if you actively participate and your MAGI is under $100k (phasing out to $0 by $150k); unused losses carry forward. On sale, claimed depreciation is recaptured at up to 25%, and gains may owe capital-gains tax (a 1031 exchange can defer both). Figures are a year-1 estimate at your 24.0% rate — not tax advice; consult a CPA.
Schools (NCES district)
- District
- Richland 01
- NCES district ID
- 4503360
- Math proficiency
- 26% ▼ -7.00%
- Reading proficiency
- 36% ▼ -5.00%
- Median HH income
- $38,931
- Composite
- 25.94/100
- National rank
- #7335
- State rank
- #54 of 80 in SC
Livability — Columbia
- Score
- 78/100
- State rank
- #18
- US rank
- #2436
Category grades
Schools grade is shown separately in the Schools card above.
Census & demographics
- County
- Richland County · 389,530 people
- City population
- 335,994
- Metro
- Columbia, SC
- Population (ZIP)
- 38,041
- Household income
- $58,772
- Rent vs Own
- Severe rent burden
- 1716.0
Population outlook (Richland County) Hauer SSP2
- Today (2025)
- 459,667 people
- By 2030
- 487,524 · +6.1%
- By 2040
- 542,035 · +17.9%
- By 2050
- 595,371 · +29.5%
- By 2075
- 732,998 · +59.5%
- By 2100
- 820,415 · +78.5%
Race, ethnicity, and origin ACS 2023
- Neighborhood character
- Diverse neighborhood (Simpson 0.62)
- Race & ethnicity
- Black 48% White 39% Two or more races 6% Hispanic / Latino 6% Asian 2%
- Hispanic origin (detail)
- Mexican 3% Puerto Rican 2%
- Common ancestry
- Slovak 2% Serbian 2% Italian 1%
- Foreign-born
- 6% · Canada, Jamaica
- Languages at home
- 93% English-only · Spanish 3% Arabic 1% Other Indo-European 1%
Political lean MEDSL · Richland
- 2024 margin
- Solid D (+34.6) · D 66.4% · R 31.8% · Other 1.8%
- 2008→2024 swing
- +5.7pp toward D · 2008: 28.9pp · 2024: 34.6pp
- All cycles
- 2024: D+34.6 2020: D+38.3 2016: D+32.9 2012: D+33.3 2008: D+28.9
Not yet ingested
- Civics
- —
Market trends
- HPI YoY
- ▼ -142.10%
- Current HPI
- 205.5679
- Rent YoY
- ▲ 2.08%
- Metro
- Columbia, SC
- State GDP YoY
- ▲ 4.51%
- F500 in state
- 2
Industry mix (Fortune 500 HQ in SC)
| Industry | F500 HQs | Revenue |
|---|---|---|
| Packaging | 1 | $7B |
|
||
Price history
+260.5% since first listed5 events — show timeline
- 2026-05-18 Listed $155,000 Consolidated MLS
- 2025-03-09 Rental Removed $1,300 APPFOLIO
- 2024-10-15 Listed for Rent $1,300 APPFOLIO
- 2023-07-16 Rental Removed — APPFOLIO
- 1987-11-01 Sold (Public Records) $43,000 Public Records
Property tax history
-1.6%/yrLatest (2025): $1,549 · +2.7% YoY. Source: county tax records.
Cash-flow waterfall
monthlySold comps — $/sqft
last 12 mo · ≤1 miLoading sold comps…