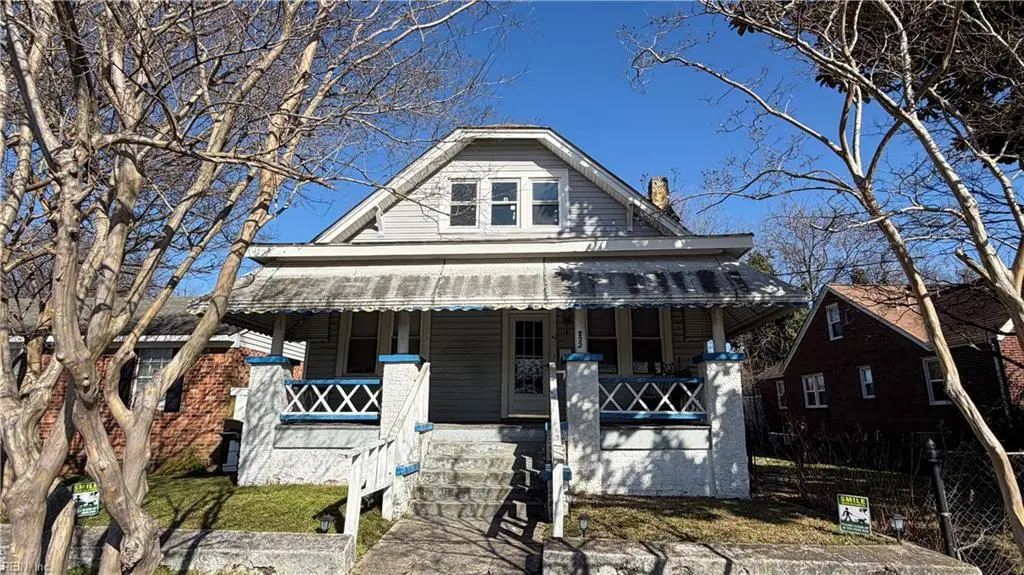
822 Berkley Avenue Ext · Norfolk, VA
Flood risk 4/10 · Minor
- FEMA flood zone
- X (unshaded)
- Chance of flooding over 30 yrs
- 0.23%
- Est. flood insurance / yr
- $507 – $1,088
Fire risk 1/10 · Minimal
- Est. fire insurance / yr
- $666 – $1,236
Heat risk 9/10 · Severe
- Hot days now (above 106°F)
- 7 days/yr
- Hot days in 30 yrs
- 16 days/yr
Wind risk 8/10 · Major
- Chance of severe wind over 30 yrs
- 80.0%
Air-quality risk 5/10 · Moderate
- Unhealthy air days now
- 6 days/yr
- Unhealthy air days in 30 yrs
- 7 days/yr
Risk factors via First Street. Map © Google.
Why this score? — see what drove the B- grade
The composite is a weighted blend of 9 inputs, each scored 0–100. Each bar is that input's sub-score; the figure is the points it added to the 100-point composite (weight × sub-score).
- Cash flow +25.0/30.0
- ARV discount +15.0/15.0
- DSCR +8.2/10.0
- 1% rule +6.3/10.0
- Livability +4.2/5.0
- Schools +3.5/10.0
- Rent growth +2.5/5.0
- Condition / age +2.5/5.0
- Appreciation +0.0/10.0
$185,000
🖨 Deal sheet 📄 Offer letter ✓ Due diligence
Listing remarks MLS
Great investment opportunity in Norfolk! This 3-bedroom, 1-bath home is full of charm and character with great curb appeal and tons of potential. The property needs updating and a complete renovation and is being sold as-is, making it ideal for investors or buyers looking to add value. Conveniently located near military bases, shopping, and major highways.
Key facts
- Complete renovation
- Curb appeal
- Conveniently located
Tags
Neighborhood map
What this means for you Summary
Snapshot
- This is a 2-bed/1.0-bath single-family listed at $185k.
Deal economics
- At list price, monthly cash flow is $405 ($5k/yr) — positive.
- The deal already cash-flows at list — no discount required.
- Meets the 1% rule at list price ($2k rent vs $185k).
- Recommended offer: $163k (12.0% below list) — sets the bar for market timing.
- Cap rate 8.9% vs local median 4.0% in Norfolk — top-decile yield for the area; either an underpriced asset or a hidden risk that comps aren't pricing in. Stress-test before assuming the spread holds.
Location & tenants
- Location reads 83/100 on livability (#43 in VA, #1,026 nationally) — a professional / high-income tenant draw. Strengths: amenities A+, commute A+, health & safety A+; Watch: employment C-, crime F.
- Norfolk City Public School District (urban): math 27% / reading 56% proficiency, ranked #118 of 131 in VA (top 90%) — families likely to look elsewhere, expect single-tenant / working-renter base with shorter leases.
- Market conditions: 24 active listings in the ZIP; 23 comparable units currently listed for rent nearby; rentals at typical pace (median 24d on market — plan ~3-4 weeks tenant-placement turnaround); 438 units permitted in Norfolk city in 2024 (273 in 5+ unit buildings).
Forward outlook
- Local home prices are declining (-3.0%/yr); year-one equity from $1k of loan paydown is wiped out by about $6k of value loss. Plan a longer hold.
Negotiation context
- It's been on market 135 days — a 12% lower offer ($163k) is reasonable based on typical stale-listing flexibility.
Risks & watch-outs
- Watch-outs: built in 1925 — expect roof / HVAC / electrical / plumbing capex.
- Climate carrying-cost: severe wind risk, 80% chance of damaging wind over 30y; extreme-heat days projected 7→16/yr by 2055 (HVAC capex compounding) — expect insurance premiums to compound above CPI over the hold.
Questions for the listing agent
- It's been on market 135 days. Have you received any prior offers? Is the seller open to a 12% concession, seller financing, or rate buy-down credit?
- Built in 1925 — when were the roof, HVAC, electrical panel, plumbing, and water heater last replaced?
- Why hasn't it sold? Are there any deal-killer items the seller is aware of (foundation, flood, title, zoning, code violations)?
- Is there a deadline driving the sale (1031 exchange, divorce, estate, relocation)? That informs how much negotiation room exists.
- Schools are A-rated — typically a magnet for longer-tenancy family renters. What's the average tenant stay here, and is there a school-zone premium baked into asking?
- Crime grade is F in this area — have there been break-ins, vandalism, or insurance claims at this property in the last 3 years? What carrier currently insures it and at what premium?
- What's the average days-on-market for RENTAL listings here right now (not sales)? A rising rental-DOM trend means longer vacancies and softer asking-rent achievability than the comps imply.
- What's the recent tenant-quality profile in this submarket — average credit score on applications, eviction rate, late-payment / NSF rate, and stable-employment percentage? A property-management company in the area should have these aggregated.
- How much new for-sale + rental construction is in the pipeline within 1–3 miles? Heavy new supply typically softens prices + rents 12–24 months out; constrained supply supports both.
Investment metrics
- 1% rule
- 1.13% ✓
- Cap rate
- 8.92%
- Cash-on-cash
- 9.38%
- DSCR
- 1.42
- GRM
- 7.4
CMA / ARV
- ARV (median comp)
- $277,810
- List price
- $185,000
- Delta
- -33.41%
- Verdict
- UNDERPRICED
- Comps
- 20 within 1.0 mi
Show comp detail 12 sales within ~0.75 mi
| Address | Dist | Beds/Ba | Sqft | Sold | Price | $/sf | Match |
|---|---|---|---|---|---|---|---|
| 511 Appomattox Ave | 0.07mi | 3/1.5 (+1) | 1,400 (-12%) | 1mo | $249,700 | $178 | 69 |
| 805 Whitehead Ave | 0.05mi | 3/2.0 (+1) | 1,480 (-7%) | 13mo | $280,000 | $189 | 66 |
| 1302 Hatton St | 0.52mi | 3/2.0 (+1) | 1,600 (+0%) | 2mo | $310,000 | $194 | 65 |
| 808 Joyce St | 0.30mi | 3/2.5 (+1) | 1,656 (+4%) | 7mo | $275,000 | $166 | 63 |
| 1608 Selden Ave | 0.49mi | 3/2.5 (+1) | 1,519 (-5%) | 1mo | $315,000 | $207 | 57 |
| 916 Joyce St | 0.36mi | 3/2.5 (+1) | 1,500 (-6%) | 8mo | $270,000 | $180 | 56 |
| 1001 Grayson St | 0.37mi | 3/2.5 (+1) | 1,458 (-9%) | 2mo | $291,000 | $200 | 55 |
| 204 Patrick St | 0.57mi | 3/2.5 (+1) | 1,560 (-2%) | 11mo | $257,500 | $165 | 49 |
| 125 Irving St | 0.40mi | 3/2.5 (+1) | 1,710 (+7%) | 11mo | $300,000 | $175 | 49 |
| 912 S Main St | 0.43mi | 3/2.5 (+1) | 1,732 (+8%) | 8mo | $342,000 | $197 | 48 |
| 1510 Landsworth St | 0.65mi | 3/2.0 (+1) | 1,722 (+8%) | 1mo | $357,000 | $207 | 47 |
| 638 Quail Ave | 0.73mi | 3/2.0 (+1) | 1,646 (+3%) | 12mo | $324,000 | $197 | 41 |
Match score weights: distance 35% · size 25% · config 20% · recency 20%. Top-matched comps best support the ARV.
Projected returns pro-forma
-3.0% appreciation · 3.0% rent growth · sell at horizon
- IRR
- -2.1%
- Equity multiple
- 0.92×
- Total profit
- $-4,178
- Equity at exit
- $27,584
- IRR
- 7.6%
- Equity multiple
- 1.57×
- Total profit
- $29,615
- Equity at exit
- $15,995
Cash invested: $51,800 (down + closing). Projections, not guarantees.
Landlord ↔ Tenant lean methodology
- Overall (STATE)
- 55 Moderately Landlord-Leaning
- State Virginia
- 55 Moderately Landlord-Leaning · D+2
- County
- — inherits STATE
- City
- — inherits STATE
ZIP-level market 23523
- Home prices YoY
- -16.6%
- Active inventory
- 24
- Price-to-rent
- 7.4×
Monthly cashflow live
- Estimated rent
- $2,090 high interval (Pro) →
- Mortgage (P&I)
- −$970
- Tax from tax record
- −$199 /mo · $2,391/yr
- Insurance
- −$77
- HOA
- −$0
- Vacancy / Maint / Mgmt
- −$439
- Net cashflow
- $405
Break-even live
UW: 25.0% down · 7.5% · 30yr · 1.5% tax · 5.0% vac · 8.0% maint · 8.0% mgmt
Financing live
Cash to close
- Down payment
- $46,250
- Closing costs
- $5,550
- Reserves months
- —
- Total cash needed
- —
Loan-product check · same deal, 3 products live
Conventional
25% down · 7.5% · 30yr
- Down + closing
- —
- Monthly P&I
- —
- Monthly cashflow
- —
- DSCR
- —
- Eligible?
- —
Personal DTI + credit; lowest rate.
DSCR
20% down · 8.5% · 30yr
- Down + closing
- —
- Monthly P&I
- —
- Monthly cashflow
- —
- DSCR
- —
- Eligible?
- —
No personal income docs; deal must DSCR.
Hard money
10% down · 12.0% · 12mo
- Down + closing
- —
- Monthly P&I
- —
- Monthly cashflow
- —
- DSCR
- —
- Eligible?
- —
Short-term bridge; refi at stabilization.
Rent comps 23 comps
| Address | Beds | Baths | Sqft | Rent | $/sqft | DOM | Units | Dist |
|---|---|---|---|---|---|---|---|---|
| 1512 Marsh St Norfolk, VA | 3.0 | 2.5 | 1727 | $2,195 | $1.27 | 44d | 1 | 0.28mi |
| 1008 Grayson St Norfolk, VA | 3.0 | 2.0 | 2200 | $2,495 | $1.13 | 44d | 1 | 0.35mi |
| 127 Poplar Ave Unit 1 Norfolk, VA | 3.0 | 2.0 | 1700 | $2,199 | $1.29 | 24d | 1 | 0.39mi |
| 1729 Todd St Norfolk, VA | 3.0 | 2.5 | 2000 | $2,450 | $1.23 | 24d | 1 | 0.40mi |
| 701 S Main St Norfolk, VA | 3.0 | 2.0 | 1076 | $1,349 | $1.25 | 2d | 2 | 0.46mi |
| 329 S Main St Norfolk, VA | 3.0 | 3.0 | 1652 | $3,000 | $1.82 | 44d | 1 | 0.55mi |
| 1510 Wilson Rd Unit 3 Norfolk, VA | 3.0 | 1.0 | 1273 | $1,200 | $0.94 | 44d | 1 | 0.60mi |
| 1510 Wilson Rd #4 Norfolk, VA | 3.0 | 1.0 | 1273 | $1,400 | $1.10 | 20d | 1 | 0.60mi |
| 1510 Wilson Rd Unit 1 Norfolk, VA | 3.0 | 1.0 | 1100 | $1,325 | $1.20 | 24d | 1 | 0.60mi |
| 1108 Jackson Ave Chesapeake, VA | 3.0 | 2.0 | 1784 | $2,100 | $1.18 | 4d | 1 | 0.86mi |
| 1151 Perry St Chesapeake, VA | 3.0 | 1.0 | 1296 | $2,000 | $1.54 | 17d | 1 | 0.97mi |
| 1110 Park Ave Unit 23324 Chesapeake, VA | 3.0 | 2.0 | 1749 | $2,200 | $1.26 | 24d | 1 | 1.16mi |
| 1110 Park Ave Chesapeake, VA | 3.0 | 2.0 | 1749 | $2,100 | $1.20 | 15d | 1 | 1.16mi |
| 111 High St #409 Portsmouth, VA | 2.0 | 2.5 | 1078 | $2,500 | $2.32 | 7d | 1 | 1.21mi |
| 321 E Main St Norfolk, VA | 3.0 | 1.0–2.0 | 1147 | $3,847 | $3.35 | 2d | 15 | 1.33mi |
| 720 Forbes St Norfolk, VA | 3.0 | 2.0 | 1056 | $2,250 | $2.13 | 44d | 1 | 1.40mi |
| 720 Forbes St Norfolk, VA | 3.0 | 2.0 | 1056 | $2,195 | $2.08 | 15d | 1 | 1.40mi |
| 2800 Chesterfield Blvd Norfolk, VA | 3.0 | 2.5 | 1760 | $2,400 | $1.36 | 4d | 1 | 1.44mi |
| 415 Saint Pauls Blvd Norfolk, VA | 1.0–2.0 | 2.0 | 1186 | $2,200 | $1.85 | 4d | 3 | 1.45mi |
| 415 Saint Pauls Blvd Norfolk, VA | 2.0 | 2.0 | 1185 | $2,348 | $1.98 | 12d | 4 | 1.45mi |
| 533 Columbia St Portsmouth, VA | 2.0 | 2.0 | 1110 | $1,495 | $1.35 | 44d | 1 | 1.48mi |
| 414 London St Unit 3 Portsmouth, VA | 3.0 | 2.0 | 1600 | $1,595 | $1.00 | 24d | 1 | 1.48mi |
| 820 Maltby Cres Norfolk, VA | 3.0 | 2.5 | 1850 | $2,395 | $1.29 | 24d | 1 | 1.49mi |
Listing history 13 events
-
2026-06-18days on market $185,000 Active 135 DOM
-
2026-06-17days on market $185,000 Active 134 DOM
-
2026-06-16days on market $185,000 Active 133 DOM
-
2026-06-15days on market $185,000 Active 132 DOM
-
2026-06-13days on market $185,000 Active 130 DOM
-
2026-06-09days on market $185,000 Active 126 DOM
-
2026-06-08days on market $185,000 Active 125 DOM
-
2026-06-07days on market $185,000 Active 124 DOM
-
2026-06-03days on market $185,000 Active 120 DOM
-
2026-06-02days on market $185,000 Active 119 DOM
-
2026-06-01days on market $185,000 Active 118 DOM
-
2026-05-31days on market $185,000 Active 117 DOM
-
2026-02-02$185,000 Active 358-char remark
Show marketing remark (358 chars)
Great investment opportunity in Norfolk! This 3-bedroom, 1-bath home is full of charm and character with great curb appeal and tons of potential. The property needs updating and a complete renovation and is being sold as-is, making it ideal for investors or buyers looking to add value. Conveniently located near military bases, shopping, and major highways.
ⓘ Source: listings_history table (triggers on properties + properties_extension) + one-shot
backfill from property_details.listing_events for pre-trigger history.
Tax reassessment forecast VA · Resets to sale price
- Current annual tax
- $2,391 · $199/mo
- Projected year-2 tax
- $2,391 · $199/mo
- Expected delta
- $0/yr ($0/mo · 0.0%)
ⓘ Screening estimate from a state-policy table — verify with the county assessor before closing.
Climate risk First Street
- Flood 4/10 Moderate FEMA zone X (unshaded) · 23% chance over 30 yrs
- Wildfire 1/10 Low
- Heat 9/10 Extreme 7 d/yr ≥106°F today · 16 d/yr by 30 yrs out
- Wind 8/10 Severe 80% chance of damaging wind over 30 yrs
- Air quality 5/10 Major 6 unhealthy d/yr today · 7 by 30 yrs out
Nearby sold comps map
Loading sold comps map…
Walkable amenities ~0.75 mi
Loading nearby amenities…
Taxation est. · year 1
- Rental income
- $25,084
- − Mortgage interest
- −$10,363
- − Property taxes
- −$2,391
- − Insurance
- −$925
- − Repairs & maintenance
- −$2,007
- − Management
- −$2,007
- − Depreciation
- −$5,382
- Taxable income
- $2,010
- Est. tax owed @ 24.0%
- −$482
- After-tax cash flow
- $4,376/yr
For passive investors: Depreciation is non-cash, so a rental often shows a tax loss while cash-flowing — sheltering income. Rental losses are passive: they offset passive income freely, and up to $25,000/yr can offset ordinary (W-2) income if you actively participate and your MAGI is under $100k (phasing out to $0 by $150k); unused losses carry forward. On sale, claimed depreciation is recaptured at up to 25%, and gains may owe capital-gains tax (a 1031 exchange can defer both). Figures are a year-1 estimate at your 24.0% rate — not tax advice; consult a CPA.
Schools (NCES district)
- District
- Norfolk City Public School District
- NCES district ID
- 5102670
- Math proficiency
- 27% ▼ -44.00%
- Reading proficiency
- 56% ▼ -10.00%
- Median HH income
- $44,358
- Composite
- 35.08/100
- National rank
- #5026
- State rank
- #118 of 131 in VA
Livability — Norfolk
- Score
- 83/100
- State rank
- #43
- US rank
- #1026
Category grades
Schools grade is shown separately in the Schools card above.
Census & demographics
- Census place
- Norfolk, VA
- City population
- 214,042
- Population (ZIP)
- 7,698
Population outlook (Norfolk County) Hauer SSP2
- Today (2025)
- 249,032 people
- By 2030
- 252,347 · +1.3%
- By 2040
- 253,644 · +1.9%
- By 2050
- 251,913 · +1.2%
- By 2075
- 245,281 · -1.5%
- By 2100
- 219,548 · -11.8%
Race, ethnicity, and origin ACS 2023
- Neighborhood character
- Predominantly Black (87%)
- Race & ethnicity
- Black 87% White 7% Two or more races 5% Hispanic / Latino 2%
- Common ancestry
- Romanian 1%
- Foreign-born
- 2% · Canada
- Languages at home
- 94% English-only · Spanish 3% Other Indo-European 1%
Political lean MEDSL · Norfolk
- 2024 margin
- Solid D (+41.5) · D 70.0% · R 28.5% · Other 1.6%
- 2008→2024 swing
- -1.4pp toward R · 2008: 43.0pp · 2024: 41.5pp
- All cycles
- 2024: D+41.5 2020: D+45.6 2016: D+42.0 2012: D+44.0 2008: D+43.0
Not yet ingested
- Civics
- —
Market trends
- HPI YoY
- ▼ -53.73%
- Current HPI
- 269.0309
- Rent YoY
- —
- Metro
- —
- State GDP YoY
- ▲ 2.40%
- F500 in state
- 50
Industry mix (Fortune 500 HQ in VA)
| Industry | F500 HQs | Revenue |
|---|---|---|
| Aerospace / Defense | 4 | $236B |
|
||
| Technology / Defense | 3 | $32B |
|
||
| Financial Services | 2 | $176B |
|
||
| Utilities | 2 | $27B |
|
||
| Insurance | 2 | $25B |
|
||
| Technology | 2 | $15B |
|
||
Price history
1 event — show timeline
- 2026-02-02 Listed $185,000 REINMLS
Property tax history
+5.3%/yrLatest (2025): $2,391 · +4.9% YoY. Source: county tax records.
Cash-flow waterfall
monthlySold comps — $/sqft
last 12 mo · ≤1 miLoading sold comps…