 Multi-family
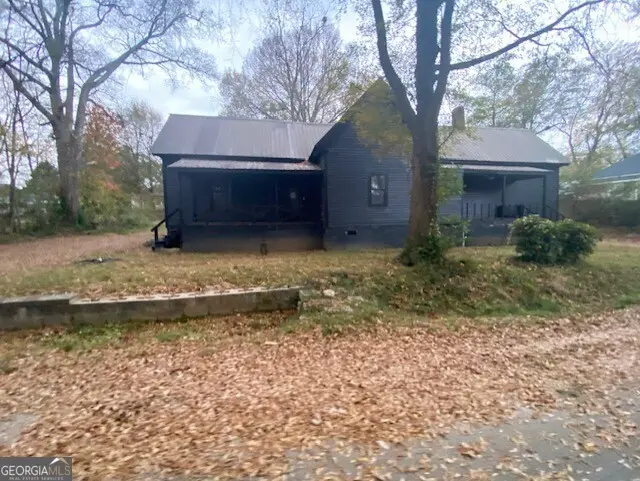
6114 Hopkins St NE · Covington, GA
Flood risk 1/10 · Minimal
- FEMA flood zone
- X (unshaded)
- Chance of flooding over 30 yrs
- 0.0%
- Est. flood insurance / yr
- $507 – $1,088
Fire risk 1/10 · Minimal
- Est. fire insurance / yr
- $963 – $1,789
Heat risk 6/10 · Moderate
- Hot days now (above 106°F)
- 7 days/yr
- Hot days in 30 yrs
- 18 days/yr
Wind risk 5/10 · Moderate
- Chance of severe wind over 30 yrs
- 26.0%
Air-quality risk 4/10 · Minor
- Unhealthy air days now
- 5 days/yr
- Unhealthy air days in 30 yrs
- 6 days/yr
Risk factors via First Street. Map © Google.
Why this score? — see what drove the B- grade
The composite is a weighted blend of 9 inputs, each scored 0–100. Each bar is that input's sub-score; the figure is the points it added to the 100-point composite (weight × sub-score).
- Cash flow +30.0/30.0
- 1% rule +10.0/10.0
- DSCR +10.0/10.0
- ARV discount +7.5/15.0
- Livability +3.0/5.0
- Rent growth +2.6/5.0
- Condition / age +2.5/5.0
- Schools +1.9/10.0
- Appreciation +0.0/10.0
$155,000
🖨 Deal sheet 📄 Offer letter ✓ Due diligence
Multi-family units
County records classify this as Multi-Family (2-4 Unit). Listing-text estimate: 1 unit. estimate disagrees with records
Listing remarks MLS
SMART & EFFICIENT LIVING found here in this nicely laid out 1.5 story duplex on large lot with mature shade trees. Conveniently located in the Covington Cotton Mills historic area once providing housing to mill workers and their families this small neighborhood features classic construction with easy access to parks, churches, schools and more. Each unit has 2 bedrooms and 1 full bath, large kitchen and living area. Easy access to I-20 and shopping along with restaurants.
Key facts
- 0.37 acre lot
- Built 1916
- Listed 112 days
Neighborhood map
What this means for you Summary
Snapshot
- This is a 4-bed/2.0-bath multifamily listed at $155k.
Deal economics
- At list price, monthly cash flow is $855 ($10k/yr) — positive.
- The deal already cash-flows at list — no discount required.
- Meets the 1% rule at list price ($2k rent vs $155k).
- Recommended offer: $141k (9.0% below list) — sets the bar for market timing.
- Cap rate 12.9% vs local median 3.8% in Covington — top-decile yield for the area; either an underpriced asset or a hidden risk that comps aren't pricing in. Stress-test before assuming the spread holds.
Location & tenants
- Location reads 59/100 on livability (#396 in GA) — a working-class tenant base; expect higher turnover. Strengths: cost of living A+, housing A+, health & safety B+; Watch: schools F, crime F, amenities F.
- Newton County (suburban): math 17% / reading 26% proficiency, ranked #137 of 174 in GA (top 79%) — low school quality limits family demand, transient renter base, plan for 1-2y turnover.
- Market conditions: Rents flat; 479 active listings in the ZIP; 8 comparable units currently listed for rent nearby; rentals leasing fast (median 2d on market — plan ~1-2 weeks tenant-placement turnaround); 1,480 units permitted in Newton County in 2024 (702 in 5+ unit buildings).
- This rent runs 41% of the median local income ($72k/yr) — at the standard rent-burdened threshold; future hikes will face affordability resistance.
Forward outlook
- Local home prices are declining (-3.0%/yr); year-one equity from $1k of loan paydown is wiped out by about $5k of value loss. Plan a longer hold.
- Newton County population projected at +23% by 2050 — long-run rental-demand tailwind backs the buy-and-hold thesis.
- At projected returns (-3.0% appreciation + 0.5% rent growth), your $43k cash investment doubles in ~6 years — after that, you're playing with house money.
Negotiation context
- It's been on market 113 days — a 9% lower offer ($141k) is reasonable based on typical stale-listing flexibility.
- 4 sale attempts since 2y ago; this cycle's ask has dropped $10k (6%) from the opening price — seller is motivated, your offer sets the floor, not the list.
- Current owner paid $80k; list at $155k implies a 94% gain — meaningful room to come down on a strong offer.
Risks & watch-outs
- Watch-outs: built in 1916 — expect roof / HVAC / electrical / plumbing capex.
- Climate carrying-cost: moderate wind risk, 26% chance of damaging wind over 30y; extreme-heat days projected 7→18/yr by 2055 (HVAC capex compounding) — expect insurance premiums to compound above CPI over the hold.
Questions for the listing agent
- It's been on market 113 days. Have you received any prior offers? Is the seller open to a 9% concession, seller financing, or rate buy-down credit?
- Built in 1916 — when were the roof, HVAC, electrical panel, plumbing, and water heater last replaced?
- Why hasn't it sold? Are there any deal-killer items the seller is aware of (foundation, flood, title, zoning, code violations)?
- Is there a deadline driving the sale (1031 exchange, divorce, estate, relocation)? That informs how much negotiation room exists.
- Schools are F-rated, which usually means shorter tenancies and higher turnover. Who's the typical renter profile here, and what's been the actual vacancy rate?
- Crime grade is F in this area — have there been break-ins, vandalism, or insurance claims at this property in the last 3 years? What carrier currently insures it and at what premium?
- What's the average days-on-market for RENTAL listings here right now (not sales)? A rising rental-DOM trend means longer vacancies and softer asking-rent achievability than the comps imply.
- What's the recent tenant-quality profile in this submarket — average credit score on applications, eviction rate, late-payment / NSF rate, and stable-employment percentage? A property-management company in the area should have these aggregated.
- How much new apartment / multifamily construction is in the pipeline within 1–3 miles? Heavy new supply (>2% of stock underway) typically softens rents 12–24 months out; light construction supports rent growth.
Investment metrics
- 1% rule
- 1.58% ✓
- Cap rate
- 12.91%
- Cash-on-cash
- 23.64%
- DSCR
- 2.05
- GRM
- 5.3
CMA / ARV
- ARV (median comp)
- $326,583
- List price
- $155,000
- Delta
- -52.54%
- Verdict
- UNDERPRICED
- Comps
- 20 within 1.0 mi
Projected returns pro-forma
-3.0% appreciation · 0.52% rent growth · sell at horizon
- IRR
- 13.9%
- Equity multiple
- 1.54×
- Total profit
- $23,425
- Equity at exit
- $23,111
- IRR
- 20.8%
- Equity multiple
- 2.55×
- Total profit
- $67,410
- Equity at exit
- $13,402
Cash invested: $43,400 (down + closing). Projections, not guarantees.
Landlord ↔ Tenant lean methodology
- Overall (STATE)
- 90 Strongly Landlord-Friendly
- State Georgia
- 90 Strongly Landlord-Friendly · R+3
- County
- — inherits STATE
- City
- — inherits STATE
ZIP-level market 30014
- Home prices YoY
- -19.2%
- Rents YoY
- 0.5%
- Active inventory
- 479
- Price-to-rent
- 5.3×
Monthly cashflow live
- Estimated rent
- $2,450 high interval (Pro) →
- Mortgage (P&I)
- −$813
- Tax from tax record
- −$203 /mo · $2,434/yr
- Insurance
- −$65
- HOA
- −$0
- Vacancy / Maint / Mgmt
- −$514
- Net cashflow
- $855
Break-even live
UW: 25.0% down · 7.5% · 30yr · 1.5% tax · 5.0% vac · 8.0% maint · 8.0% mgmt
Financing live
Cash to close
- Down payment
- $38,750
- Closing costs
- $4,650
- Reserves months
- —
- Total cash needed
- —
Loan-product check · same deal, 3 products live
Conventional
25% down · 7.5% · 30yr
- Down + closing
- —
- Monthly P&I
- —
- Monthly cashflow
- —
- DSCR
- —
- Eligible?
- —
Personal DTI + credit; lowest rate.
DSCR
20% down · 8.5% · 30yr
- Down + closing
- —
- Monthly P&I
- —
- Monthly cashflow
- —
- DSCR
- —
- Eligible?
- —
No personal income docs; deal must DSCR.
Hard money
10% down · 12.0% · 12mo
- Down + closing
- —
- Monthly P&I
- —
- Monthly cashflow
- —
- DSCR
- —
- Eligible?
- —
Short-term bridge; refi at stabilization.
Rent comps 8 comps
| Address | Beds | Baths | Sqft | Rent | $/sqft | DOM | Units | Dist |
|---|---|---|---|---|---|---|---|---|
| 4112 Dorchester Dr SE Covington, GA | 3.0–5.0 | 2.5–4.0 | 2299 | $3,022 | $1.31 | 1d | 1 | 1.00mi |
| 10500 Callaway Dr Covington, GA | 1.0–3.0 | 1.0–2.0 | 981 | $2,627 | $2.68 | 1d | 68 | 1.08mi |
| 9300 Delk Dr Covington, GA | 1.0–3.0 | 1.0–2.0 | 1048 | $2,580 | $2.46 | 1d | 17 | 1.15mi |
| 12250 Town Center Blvd Covington, GA | 3.0–4.0 | 2.5 | 1843 | $2,378 | $1.29 | 1d | 11 | 1.18mi |
| 12301 Town Ctr Blvd Covington, GA | 3.0 | 1.0–2.5 | 1282 | $2,878 | $2.24 | 1d | 20 | 1.29mi |
| 12607 Persky PL Covington, GA | 3.0 | 2.5–3.5 | 1668 | $1,888 | $1.13 | 1d | 10 | 1.37mi |
| 6184 Geiger St NW Covington, GA | 3.0 | 2.0 | 1310 | $1,725 | $1.32 | 44d | 1 | 1.44mi |
| 107 W Bonnell St Oxford, GA | 3.0 | 1.0 | 1356 | $1,650 | $1.22 | 5d | 1 | 1.46mi |
Listing history 25 events
-
2026-06-18days on market $155,000 Active 113 DOM
-
2026-06-17days on market $155,000 Active 112 DOM
-
2026-06-16days on market $155,000 Active 111 DOM
-
2026-06-15days on market $155,000 Active 110 DOM
-
2026-06-13days on market $155,000 Active 108 DOM
-
2026-06-13days on market $155,000 Active 107 DOM
-
2026-06-09days on market $155,000 Active 104 DOM
-
2026-06-08days on market $155,000 Active 103 DOM
-
2026-06-07days on market $155,000 Active 102 DOM
-
2026-06-04days on market $155,000 Active 99 DOM
-
2026-06-03days on market $155,000 Active 98 DOM
-
2026-06-02days on market $155,000 Active 97 DOM
-
2026-06-01days on market $155,000 Active 96 DOM
-
2026-05-31days on market $155,000 Active 95 DOM
-
2026-04-15price $155,000 480-char remark
Show marketing remark (480 chars)
SMART & EFFICIENT LIVING found here in this nicely laid out 1.5 story duplex on large lot with mature shade trees. Conveniently located in the Covington Cotton Mills historic area once providing housing to mill workers and their families this small neighborhood features classic construction with easy access to parks, churches, schools and more. Each unit has 2 bedrooms and 1 full bath, large kitchen and living area. Easy access to I-20 and shopping along with restaurants.
-
2026-02-25$165,000 New 480-char remark
Show marketing remark (480 chars)
SMART & EFFICIENT LIVING found here in this nicely laid out 1.5 story duplex on large lot with mature shade trees. Conveniently located in the Covington Cotton Mills historic area once providing housing to mill workers and their families this small neighborhood features classic construction with easy access to parks, churches, schools and more. Each unit has 2 bedrooms and 1 full bath, large kitchen and living area. Easy access to I-20 and shopping along with restaurants.
-
2025-02-28historical
-
2024-12-04status Back On Market
-
2024-11-30historical
-
2024-09-16status Back On Market
-
2024-08-31historical
-
2024-07-16$299,999 New
-
2022-03-15soldstatus $80,000
-
2019-03-12soldstatus $60,000
-
2017-12-19soldstatus $45,000
ⓘ Source: listings_history table (triggers on properties + properties_extension) + one-shot
backfill from property_details.listing_events for pre-trigger history.
Tax reassessment forecast GA · Resets to sale price
- Current annual tax
- $2,434 · $203/mo
- Projected year-2 tax
- $2,434 · $203/mo
- Expected delta
- $0/yr ($0/mo · 0.0%)
ⓘ Screening estimate from a state-policy table — verify with the county assessor before closing.
Climate risk First Street
- Flood 1/10 Low FEMA zone X (unshaded) · 0% chance over 30 yrs
- Wildfire 1/10 Low
- Heat 6/10 Major 7 d/yr ≥106°F today · 18 d/yr by 30 yrs out
- Wind 5/10 Major 26% chance of damaging wind over 30 yrs
- Air quality 4/10 Moderate 5 unhealthy d/yr today · 6 by 30 yrs out
Nearby sold comps map
Loading sold comps map…
Walkable amenities ~0.75 mi
Loading nearby amenities…
Taxation est. · year 1
- Rental income
- $29,399
- − Mortgage interest
- −$8,682
- − Property taxes
- −$2,434
- − Insurance
- −$775
- − Repairs & maintenance
- −$2,352
- − Management
- −$2,352
- − Depreciation
- −$4,509
- Taxable income
- $8,294
- Est. tax owed @ 24.0%
- −$1,991
- After-tax cash flow
- $8,271/yr
For passive investors: Depreciation is non-cash, so a rental often shows a tax loss while cash-flowing — sheltering income. Rental losses are passive: they offset passive income freely, and up to $25,000/yr can offset ordinary (W-2) income if you actively participate and your MAGI is under $100k (phasing out to $0 by $150k); unused losses carry forward. On sale, claimed depreciation is recaptured at up to 25%, and gains may owe capital-gains tax (a 1031 exchange can defer both). Figures are a year-1 estimate at your 24.0% rate — not tax advice; consult a CPA.
Schools (NCES district)
- District
- Newton County
- NCES district ID
- 1303930
- Math proficiency
- 17% ▼ -13.00%
- Reading proficiency
- 26% ▼ -8.00%
- Median HH income
- $50,768
- Composite
- 19.2/100
- National rank
- #8816
- State rank
- #137 of 174 in GA
Livability — Covington
- Score
- 59/100
- State rank
- #396
- US rank
- #19602
Category grades
Schools grade is shown separately in the Schools card above.
Census & demographics
- Census place
- Covington, GA
- County
- Newton County · 104,393 people
- City population
- 104,393
- Metro
- Atlanta-Sandy Springs-Alpharetta, GA
- Population (ZIP)
- 41,425
- Household income
- $72,254
- Rent vs Own
- Severe rent burden
- 1934.0
Population outlook (Newton County) Hauer SSP2
- Today (2025)
- 118,372 people
- By 2030
- 124,234 · +5.0%
- By 2040
- 135,550 · +14.5%
- By 2050
- 145,309 · +22.8%
- By 2075
- 166,843 · +40.9%
- By 2100
- 175,800 · +48.5%
Race, ethnicity, and origin ACS 2023
- Neighborhood character
- Diverse neighborhood (Simpson 0.59)
- Race & ethnicity
- White 53% Black 35% Hispanic / Latino 7% Two or more races 6% Asian 2%
- Hispanic origin (detail)
- Mexican 3%
- Common ancestry
- Italian 2% Slovak 2% Serbian 1%
- Foreign-born
- 7% · Canada
- Languages at home
- 93% English-only · Spanish 5% Other Indo-European 1%
Political lean MEDSL · Newton
- 2024 margin
- D (+15.1) · D 57.3% · R 42.2%
- 2008→2024 swing
- +14.0pp toward D · 2008: 1.2pp · 2024: 15.1pp
- All cycles
- 2024: D+15.1 2020: D+10.9 2016: D+2.4 2012: D+2.0 2008: D+1.2
Not yet ingested
- Civics
- —
Market trends
- HPI YoY
- ▼ -64.50%
- Current HPI
- 270.9868
- Rent YoY
- ▲ 0.52%
- Metro
- Atlanta-Sandy Springs-Alpharetta, GA
- State GDP YoY
- ▲ 2.66%
- F500 in state
- 28
Industry mix (Fortune 500 HQ in GA)
| Industry | F500 HQs | Revenue |
|---|---|---|
| Paper / Packaging | 2 | $29B |
|
||
| Retail | 1 | $160B |
|
||
| Transportation / Logistics | 1 | $91B |
|
||
| Airlines | 1 | $62B |
|
||
| Consumer Goods | 1 | $47B |
|
||
| Utilities | 1 | $25B |
|
||
Price history
+244.4% since first listed11 events — show timeline
- 2026-04-15 Price Changed $155,000 GAMLS
- 2026-02-25 Listed $165,000 GAMLS
- 2025-02-28 Listing Removed — GAMLS
- 2024-12-04 Relisted — GAMLS
- 2024-11-30 Listing Removed — GAMLS
- 2024-09-16 Relisted — GAMLS
- 2024-08-31 Listing Removed — GAMLS
- 2024-07-16 Listed $299,999 GAMLS
- 2022-03-15 Sold (Public Records) $80,000 Public Records
- 2019-03-12 Sold (Public Records) $60,000 Public Records
- 2017-12-19 Sold (Public Records) $45,000 Public Records
Property tax history
+4.7%/yrLatest (2025): $2,434 · +27.5% YoY. Source: county tax records.
Cash-flow waterfall
monthlySold comps — $/sqft
last 12 mo · ≤1 miLoading sold comps…