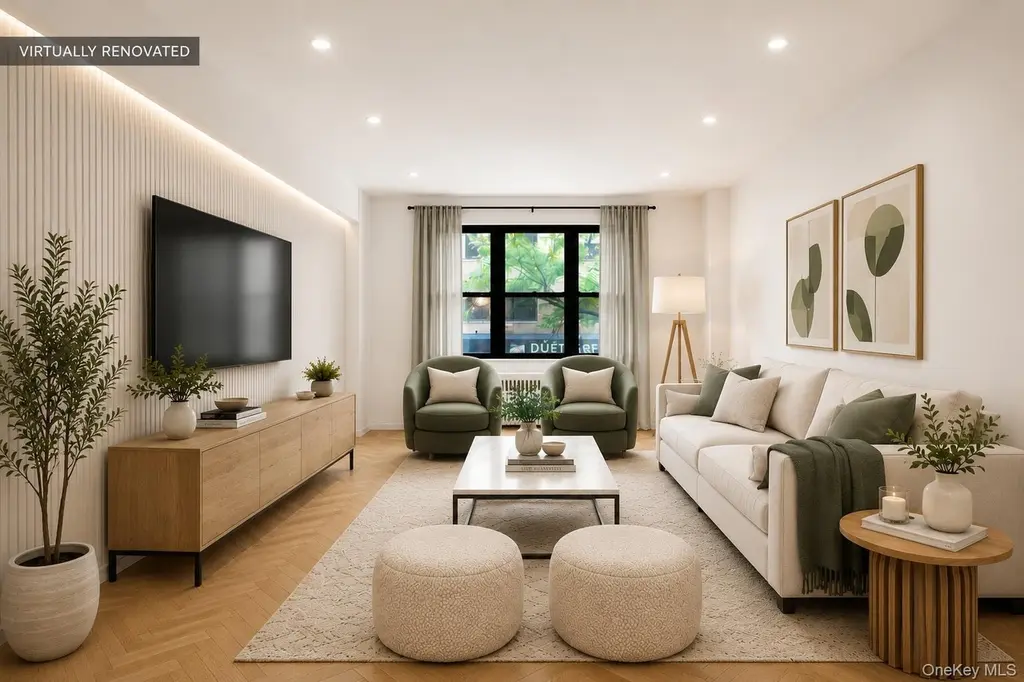
301 E 48th St Unit 2C · New York, NY
Flood risk 8/10 · Major
- FEMA flood zone
- X (unshaded)
- Chance of flooding over 30 yrs
- 0.78%
- Est. flood insurance / yr
- $507 – $1,088
Fire risk 1/10 · Minimal
- Est. fire insurance / yr
- $691 – $1,283
Heat risk 6/10 · Moderate
- Hot days now (above 99°F)
- 7 days/yr
- Hot days in 30 yrs
- 15 days/yr
Wind risk 6/10 · Moderate
- Chance of severe wind over 30 yrs
- 27.0%
Air-quality risk 4/10 · Minor
- Unhealthy air days now
- 5 days/yr
- Unhealthy air days in 30 yrs
- 6 days/yr
Risk factors via First Street. Map © Google.
Why this score? — see what drove the D grade
The composite is a weighted blend of 9 inputs, each scored 0–100. Each bar is that input's sub-score; the figure is the points it added to the 100-point composite (weight × sub-score).
- ARV discount +7.5/15.0
- Appreciation +6.7/10.0
- Cash flow +6.0/30.0
- Schools +5.0/10.0
- 1% rule +4.9/10.0
- Condition / age +4.8/5.0
- Rent growth +4.0/5.0
- Livability +3.8/5.0
- DSCR +0.3/10.0
$725,000
🖨 Deal sheet 📄 Offer letter ✓ Due diligence
Listing remarks
Welcome to a rare opportunity to create a home that reflects your style—not someone else’s renovation choices. This oversized Junior 4 / potential two-bedroom apartment offers over 1,000 square feet of space, incredible layout flexibility, maintenance below $2000, and the kind of storage that feels nearly impossible to find in Manhattan. While everyone else is complaining about tiny closets, this apartment delivers THREE walk-in closets, a pantry and a coat closet—giving you room to actually live. The space is bright, functional, and full of potential for a buyer with vision. Some listing photos have been virtually renovated to help showcase possible design ideas and moder
Key facts
- Abundance of closets
- 24-hour doorman
- Entry foyer
Tags
Property features AI
Finance
- Financial info: Additional monthly assessment: $475.90
- HOA & community: Door attendant; Elevator(s); Live-in superintendent; Roof deck; Monthly assessment fee
Exterior
- Parking: Garage; Underground parking
- Security: Building security; Fire alarm; Fire sprinkler system; Video cameras
- Utilities: Public sewer; Cable available; Electricity available; Natural gas available; Sewer connected; Water connected
- Home design: Stock cooperative; One level; Located on the second floor; Part of a 20-story building
- Construction: Construction materials: Other/Unknown; Foundation: Other
- Exterior features: Corner lot; No waterfront
Interior
- Kitchen: Convection oven; Cooktop; Gas cooktop; Gas range; Dishwasher; Refrigerator; Stainless steel appliances
- Bedrooms: Located on entry level 2
- Flooring: Carpet; Ceramic tile
- Bathrooms: 1 full bathroom
- Heating & cooling: Forced air heating; Central air conditioning
- Interior features: Entrance foyer; Galley kitchen; Granite counters; High ceilings; Walk-in closet(s); Basement storage space; Six total rooms
- Laundry & utility: Common area laundry; In basement; Laundry room
Neighborhood map
What this means for you Summary
Snapshot
- This is a 2-bed/1.0-bath condo listed at $725k. Condition is rated excellent.
Deal economics
- At list price, monthly cash flow is $-1k ($-18k/yr) — negative.
- The deal already cash-flows at list — no discount required.
- To meet the 1% rule (rent ≥ 1% of price), the offer needs to be $717k (1.1% below list).
- Recommended offer: $703k (3.0% below list) — sets the bar for market timing.
- Cap rate 4.0% vs local median 2.6% in New York — top-decile yield for the area; either an underpriced asset or a hidden risk that comps aren't pricing in. Stress-test before assuming the spread holds.
Location & tenants
- Location reads 75/100 on livability (#268 in NY, #4,188 nationally) — a middle-class / working-renter tenant base. Strengths: amenities A+, commute A+, health & safety A; Watch: crime F, cost of living F.
- Market conditions: Rents rising fast (+6.2%/yr); 264 active listings in the ZIP; 40 comparable units currently listed for rent nearby; rentals at typical pace (median 15d on market — plan ~3-4 weeks tenant-placement turnaround); high-income renter base; 4,467 units permitted in New York County in 2024 (4,463 in 5+ unit buildings).
- At $7,172/mo this rent would consume 63% of the median local household income ($137k/yr) (locally 2167% of renters already pay >50% of income on rent) — very limited rent-growth headroom before tenants either downsize or default.
Forward outlook
- In year one you build about $30k of equity ($5k loan paydown + $25k appreciation (3.4% local appreciation)).
- New York County population projected at +21% by 2050 — long-run rental-demand tailwind backs the buy-and-hold thesis.
- By year 2, paydown + projected appreciation supports a ~$48k cash-out refi (75% LTV) — recoverable capital for the next deal without selling this one.
Negotiation context
- It's been on market 43 days — a 3% lower offer ($703k) is reasonable based on typical stale-listing flexibility.
- 3 sale attempts with the ask held roughly flat each time — persistent listings suggest the price (not the market) is what's stuck; bring a comps-based counter.
Risks & watch-outs
- Watch-outs: flood insurance adds $66/mo; HOA is 29% of rent.
- Climate carrying-cost: severe flood risk; major wind risk, 27% chance of damaging wind over 30y; extreme-heat days projected 7→15/yr by 2055 (HVAC capex compounding) — expect insurance premiums to compound above CPI over the hold.
Questions for the listing agent
- What do current leases actually rent for vs. the listed asking? Can we see a recent rent roll and the last 12 months of T-12 income?
- It's been on market 43 days. Have you received any prior offers? Is the seller open to a 3% concession, seller financing, or rate buy-down credit?
- Built in 1964 — when were the roof, HVAC, electrical panel, plumbing, and water heater last replaced?
- What's the actual annual flood-insurance premium (NFIP or private), and is the property in a SFHA with mandatory coverage?
- What does the HOA fee cover, when was the last increase, and are there any pending special assessments or reserve-fund shortfalls?
- Any open or pending special assessments — roof, HVAC, plumbing, elevator, façade? What's the per-unit balance and payoff schedule, and is the seller paying it off at close or rolling it to the buyer?
- Is there a deadline driving the sale (1031 exchange, divorce, estate, relocation)? That informs how much negotiation room exists.
- Schools are B-rated — typically a magnet for longer-tenancy family renters. What's the average tenant stay here, and is there a school-zone premium baked into asking?
- Crime grade is F in this area — have there been break-ins, vandalism, or insurance claims at this property in the last 3 years? What carrier currently insures it and at what premium?
- The area grade is low — what's the realistic commute time and amenity access for the typical tenant pool here? Any planned neighborhood developments (good or bad) we should know about?
- What's the average days-on-market for RENTAL listings here right now (not sales)? A rising rental-DOM trend means longer vacancies and softer asking-rent achievability than the comps imply.
- What's the recent tenant-quality profile in this submarket — average credit score on applications, eviction rate, late-payment / NSF rate, and stable-employment percentage? A property-management company in the area should have these aggregated.
- How much new apartment / multifamily construction is in the pipeline within 1–3 miles? Heavy new supply (>2% of stock underway) typically softens rents 12–24 months out; light construction supports rent growth.
Investment metrics
- 1% rule
- 0.99% ✗
- Cap rate
- 3.97%
- Cash-on-cash
- -8.28%
- DSCR
- 0.63
- GRM
- 8.4
CMA / ARV
No comps found within radius.
Projected returns pro-forma
3.38% appreciation · 6.16% rent growth · sell at horizon
- IRR
- 2.8%
- Equity multiple
- 1.17×
- Total profit
- $33,591
- Equity at exit
- $341,738
- IRR
- 8.0%
- Equity multiple
- 2.35×
- Total profit
- $274,352
- Equity at exit
- $539,244
Cash invested: $203,000 (down + closing). Projections, not guarantees.
Landlord ↔ Tenant lean methodology
- Overall (CITY)
- 0 Strongly Tenant-Friendly
- State New York
- 15 Strongly Tenant-Friendly · D+10
- County
- — inherits STATE
- City New York
- 0 Strongly Tenant-Friendly · D+34
ZIP-level market 10017
- Home prices YoY
- 1.1%
- Rents YoY
- 6.2%
- Active inventory
- 264
- Price-to-rent
- 8.4×
Monthly cashflow live
- Estimated rent
- $7,172 high interval (Pro) →
- Mortgage (P&I)
- −$3,802
- Tax est. 1.5%
- −$906 /mo · $10,875/yr
- Insurance
- −$302
- Flood insurance flood zone
- −$66 /mo · $798/yr
- HOA est. from 1 same-building comp
- −$2,057
- Vacancy / Maint / Mgmt
- −$1,506
- Net cashflow
- $-1,468
Break-even live
UW: 25.0% down · 7.5% · 30yr · 1.5% tax · 5.0% vac · 8.0% maint · 8.0% mgmt
Financing live
Cash to close
- Down payment
- $181,250
- Closing costs
- $21,750
- Reserves months
- —
- Total cash needed
- —
Loan-product check · same deal, 3 products live
Conventional
25% down · 7.5% · 30yr
- Down + closing
- —
- Monthly P&I
- —
- Monthly cashflow
- —
- DSCR
- —
- Eligible?
- —
Personal DTI + credit; lowest rate.
DSCR
20% down · 8.5% · 30yr
- Down + closing
- —
- Monthly P&I
- —
- Monthly cashflow
- —
- DSCR
- —
- Eligible?
- —
No personal income docs; deal must DSCR.
Hard money
10% down · 12.0% · 12mo
- Down + closing
- —
- Monthly P&I
- —
- Monthly cashflow
- —
- DSCR
- —
- Eligible?
- —
Short-term bridge; refi at stabilization.
Rent comps 40 comps
| Address | Beds | Baths | Sqft | Rent | $/sqft | DOM | Units | Dist |
|---|---|---|---|---|---|---|---|---|
| 250 E 49th St Unit 4A New York, NY | 1.0 | 1.0 | 802 | $6,400 | $7.98 | 25d | 1 | 0.04mi |
| 220 E 49th St Unit 1021974P New York, NY | 2.0 | 1.0 | 742 | $5,190 | $6.99 | 15d | 1 | 0.09mi |
| 300 E 51st St New York, NY | 2.0 | 1.0–2.0 | 875 | $7,930 | $9.06 | 3d | 3 | 0.11mi |
| 340 E 51st St New York, NY | 2.0 | 1.0–2.0 | 791 | $7,630 | $9.65 | 4d | 3 | 0.12mi |
| 323 E 51st St Unit 1024750P New York, NY | 2.0–4.0 | 2.0–3.5 | 2093 | $21,945 | $10.48 | 8d | 2 | 0.14mi |
| 300-302 E 46th St Unit 12J New York, NY | 3.0 | 1.0 | 900 | $8,000 | $8.89 | 5d | 1 | 0.14mi |
| 300 E 46th St New York, NY | 2.0–3.0 | 1.0 | 716 | $4,300 | $6.00 | 25d | 2 | 0.14mi |
| 160 E 48th St New York, NY | 3.0 | 1.0–2.0 | 878 | $8,572 | $9.76 | 4d | 9 | 0.17mi |
| 250 E 53rd St #403 New York, NY | 1.0 | 1.0 | 823 | $5,850 | $7.11 | 25d | 1 | 0.21mi |
| 138 E 50th St New York, NY | 2.0 | 2.0–2.5 | 1432 | $13,650 | $9.53 | 25d | 1 | 0.21mi |
| 135 E 47th St Unit 22F New York, NY | 1.0 | 1.0 | 700 | $7,500 | $10.71 | 22d | 1 | 0.21mi |
| 279 E 44th St #894 New York, NY | 1.0 | 1.0 | 950 | $7,190 | $7.57 | 6d | 1 | 0.22mi |
| 959 1st Ave Unit 6X New York, NY | 1.0 | 1.0 | 739 | $6,000 | $8.12 | 25d | 1 | 0.23mi |
| 230 E 44th St #2165 New York, NY | 1.0–2.0 | 1.0 | 568 | $5,320 | $9.36 | 25d | 2 | 0.25mi |
| 420 E 54th St New York, NY | 3.0 | 1.0–2.5 | 1104 | $10,299 | $9.32 | 1d | 14 | 0.31mi |
| 303 Park Ave #2203 New York, NY | 1.0 | 1.5 | 796 | $13,500 | $16.96 | 8d | 1 | 0.32mi |
| 303 Park Ave #2321 New York, NY | 1.0 | 1.5 | 808 | $14,500 | $17.95 | 8d | 1 | 0.32mi |
| 412 E 55th St New York, NY | 1.0 | 1.0 | 767 | $5,250 | $6.84 | 25d | 1 | 0.36mi |
| 500 E 54th St Unit 601 New York, NY | 3.0 | 2.0 | 860 | $7,390 | $8.59 | 8d | 1 | 0.37mi |
| 300 E 57th St #1714 New York, NY | 1.0 | 1.0 | 820 | $5,800 | $7.07 | 21d | 1 | 0.40mi |
| 400 E 57th St New York, NY | 1.0–2.0 | 1.0–2.0 | 1436 | $6,595 | $4.59 | 25d | 3 | 0.42mi |
| 400 E 57th St #2106 New York, NY | 2.0 | 1.0–2.0 | 903 | $8,590 | $9.51 | 4d | 3 | 0.43mi |
| 227 E 57th St Unit 14C New York, NY | 1.0 | 1.0 | 780 | $4,750 | $6.09 | 25d | 1 | 0.43mi |
| 150 E 57th St New York, NY | 5.0 | 1.0–7.5 | 2750 | $15,738 | $5.72 | 2d | 5 | 0.44mi |
| 685 1st Ave Unit 1321817P New York, NY | 2.0 | 2.0 | 1367 | $17,447 | $12.76 | 22d | 1 | 0.47mi |
| 222 E 39th St New York, NY | 1.0–4.0 | 1.0–2.0 | 1100 | $6,850 | $6.23 | 6d | 19 | 0.51mi |
| 222 E 39th St New York, NY | 1.0–4.0 | 1.0–2.0 | 1100 | $6,783 | $6.17 | 25d | 18 | 0.51mi |
| 222 E 39th St New York, NY | 1.0–4.0 | 1.0–2.0 | 1100 | $6,783 | $6.17 | 21d | 19 | 0.51mi |
| 222 E 39th St New York, NY | 4.0 | 1.0–2.0 | 1100 | $6,972 | $6.34 | 10d | 19 | 0.51mi |
| 222 E 39th St New York, NY | 1.0–4.0 | 1.0–2.0 | 1100 | $6,133 | $5.58 | 3d | 20 | 0.51mi |
| 117 E 57th St New York, NY | 1.0 | 1.0 | 732 | $5,975 | $8.16 | 5d | 2 | 0.52mi |
| 138 E 38th St New York, NY | 3.0 | 1.0–2.0 | 750 | $6,420 | $8.56 | 25d | 4 | 0.58mi |
| 415 E 37th St Unit 36A New York, NY | 2.0 | 2.0 | 1210 | $8,700 | $7.19 | 25d | 1 | 0.59mi |
| 252 E 61st St #638 New York, NY | 1.0 | 1.0 | 666 | $5,530 | $8.30 | 2d | 2 | 0.60mi |
| 15 W 55th St #736 New York, NY | 2.0–3.0 | 1.0–2.0 | 1250 | $8,550 | $6.84 | 2d | 2 | 0.67mi |
| 41 Park Ave New York, NY | 2.0 | 1.0–2.0 | 815 | $8,170 | $10.02 | 8d | 3 | 0.69mi |
| 40 W 55th St Unit 5D New York, NY | 2.0 | 2.5 | 1070 | $6,500 | $6.07 | 25d | 1 | 0.70mi |
| 220 E 63rd St #567 New York, NY | 1.0 | 1.0 | 800 | $6,460 | $8.07 | 21d | 1 | 0.70mi |
| 70 W 45th St #1131 New York, NY | 1.0–2.0 | 1.0–2.0 | 902 | $8,370 | $9.27 | 8d | 2 | 0.71mi |
| 40-44 E 61st St Unit 15B New York, NY | 2.0 | 2.0 | 1200 | $15,000 | $12.50 | 15d | 1 | 0.71mi |
HOA detail condo
- Monthly dues
- $0 · $0/yr
- Assessments
- None detected in remarks — confirm with the listing agent.
Listing history 23 events
-
2026-06-18days on market $725,000 Active 43 DOM
-
2026-06-17days on market $725,000 Active 42 DOM
-
2026-06-16days on market $725,000 Active 41 DOM
-
2026-06-15days on market $725,000 Active 40 DOM
-
2026-06-13days on market $725,000 Active 38 DOM
-
2026-06-10days on market $725,000 Active 34 DOM
-
2026-06-08days on market $725,000 Active 33 DOM
-
2026-06-08days on market $725,000 Active 32 DOM
-
2026-06-04days on market $725,000 Active 29 DOM
-
2026-06-03days on market $725,000 Active 28 DOM
-
2026-06-01days on market $725,000 Active 26 DOM
-
2026-05-31days on market $725,000 Active 25 DOM
-
2026-05-06$725,000 Active
-
2026-01-03historical
-
2025-10-02$748,000 Active
-
2025-09-15historical
-
2025-08-01price $748,000
-
2025-06-30price $782,000
-
2025-06-17price $784,000
-
2025-04-18price $789,000
-
2025-02-22price $794,000
-
2025-01-23$799,000 Active
-
2025-01-23historical
ⓘ Source: listings_history table (triggers on properties + properties_extension) + one-shot
backfill from property_details.listing_events for pre-trigger history.
Climate risk First Street
- Flood 8/10 Severe FEMA zone X (unshaded) · 78% chance over 30 yrs
- Wildfire 1/10 Low
- Heat 6/10 Major 7 d/yr ≥99°F today · 15 d/yr by 30 yrs out
- Wind 6/10 Major 27% chance of damaging wind over 30 yrs
- Air quality 4/10 Moderate 5 unhealthy d/yr today · 6 by 30 yrs out
Nearby sold comps map
Loading sold comps map…
Walkable amenities ~0.75 mi
Loading nearby amenities…
Taxation est. · year 1
- Rental income
- $86,065
- − Mortgage interest
- −$40,611
- − Property taxes
- −$10,875
- − Insurance
- −$4,422
- − Repairs & maintenance
- −$6,885
- − Management
- −$6,885
- − HOA
- −$24,684
- − Depreciation
- −$21,091
- Taxable loss
- −$29,389
- Est. tax savings @ 24.0%
- +$7,053
- After-tax cash flow
- $-10,560/yr
For passive investors: Depreciation is non-cash, so a rental often shows a tax loss while cash-flowing — sheltering income. Rental losses are passive: they offset passive income freely, and up to $25,000/yr can offset ordinary (W-2) income if you actively participate and your MAGI is under $100k (phasing out to $0 by $150k); unused losses carry forward. On sale, claimed depreciation is recaptured at up to 25%, and gains may owe capital-gains tax (a 1031 exchange can defer both). Figures are a year-1 estimate at your 24.0% rate — not tax advice; consult a CPA.
Condition & rehab AI · 6 photos
This property is in excellent condition with a modern and well-maintained interior. It offers a great opportunity for a buyer with vision to make it their own. Consider painting the exterior and landscaping to enhance curb appeal and adding smart home technology for a modern touch.
Value-add opportunities
- Both Painting the exterior and landscaping — Enhances curb appeal and can increase both resale and rental value.
- Resale Upgrading the kitchen backsplash — Modernizes the kitchen and adds visual interest.
- Both Adding a smart home system — Improves convenience and can increase both resale and rental value.
- Resale Upgrading the flooring in the bathrooms — Modernizes the bathrooms and adds value to the property.
Renovation cost estimate screening
Value-add ROI direction
- Both Painting the exterior and landscaping — Enhances curb appeal and can increase both resale and rental value. ↑
- Resale Upgrading the kitchen backsplash — Modernizes the kitchen and adds visual interest. ↑
- Both Adding a smart home system — Improves convenience and can increase both resale and rental value. ↑
- Resale Upgrading the flooring in the bathrooms — Modernizes the bathrooms and adds value to the property. ↑
ⓘ Cost ranges are severity-bucket heuristics (US national rule-of-thumb). Get contractor quotes + a written scope before underwriting a rehab budget.
Schools (NCES district)
No district data.
Livability — New York
- Score
- 75/100
- State rank
- #268
- US rank
- #4188
Category grades
Schools grade is shown separately in the Schools card above.
Census & demographics
- Census place
- New York, NY
- County
- New York County · 1,599,927 people
- City population
- 7,731,280
- Metro
- New York-Newark-Jersey City, NY-NJ-PA
- Population (ZIP)
- 15,297
- Household income
- $136,705
- Rent vs Own
- Severe rent burden
- 2167.0
Population outlook (New York County) Hauer SSP2
- Today (2025)
- 1,825,725 people
- By 2030
- 1,904,611 · +4.3%
- By 2040
- 2,052,719 · +12.4%
- By 2050
- 2,206,601 · +20.9%
- By 2075
- 2,509,427 · +37.4%
- By 2100
- 2,702,933 · +48.0%
Race, ethnicity, and origin ACS 2023
- Neighborhood character
- Predominantly White (66%)
- Race & ethnicity
- White 66% Asian 18% Two or more races 7% Hispanic / Latino 4% Black 3%
- Common ancestry
- Romanian 8% Scotch-Irish 5% Italian 4%
- Foreign-born
- 32% · Canada, China, Jamaica
- Languages at home
- 76% English-only · Other Indo-European 6% Spanish 5% French/Haitian/Cajun 4%
Political lean MEDSL · New York
- 2024 margin
- Solid D (+64.8) · D 82.4% · R 17.6%
- 2008→2024 swing
- -7.4pp toward R · 2008: 72.2pp · 2024: 64.8pp
- All cycles
- 2024: D+64.8 2020: D+74.5 2016: D+77.2 2012: D+69.6 2008: D+72.2
Not yet ingested
- Civics
- —
Market trends
- HPI YoY
- ▲ 3.38%
- Current HPI
- 303.3659
- Rent YoY
- ▲ 6.16%
- Metro
- New York-Newark-Jersey City, NY-NJ-PA
- State GDP YoY
- ▲ 2.60%
- F500 in state
- 92
Industry mix (Fortune 500 HQ in NY)
| Industry | F500 HQs | Revenue |
|---|---|---|
| Financial Services | 10 | $950B |
|
||
| Consumer Goods | 9 | $162B |
|
||
| Insurance | 4 | $225B |
|
||
| Telecommunications | 2 | $144B |
|
||
| Pharmaceuticals | 2 | $112B |
|
||
| Media / Entertainment | 2 | $69B |
|
||
Price history
-9.3% since first listed11 events — show timeline
- 2026-05-06 Listed $725,000 OneKey® MLS as Distributed by MLS Grid
- 2026-01-03 Listing Removed — OneKey® MLS as Distributed by MLS Grid
- 2025-10-02 Listed $748,000 OneKey® MLS as Distributed by MLS Grid
- 2025-09-15 Listing Removed — OneKey® MLS as Distributed by MLS Grid
- 2025-08-01 Price Changed $748,000 OneKey® MLS as Distributed by MLS Grid
- 2025-06-30 Price Changed $782,000 OneKey® MLS as Distributed by MLS Grid
- 2025-06-17 Price Changed $784,000 OneKey® MLS as Distributed by MLS Grid
- 2025-04-18 Price Changed $789,000 OneKey® MLS as Distributed by MLS Grid
- 2025-02-22 Price Changed $794,000 OneKey® MLS as Distributed by MLS Grid
- 2025-01-23 Listed $799,000 OneKey® MLS as Distributed by MLS Grid
- 2025-01-23 Coming Soon — OneKey® MLS as Distributed by MLS Grid
Cash-flow waterfall
monthlySold comps — $/sqft
last 12 mo · ≤1 miLoading sold comps…