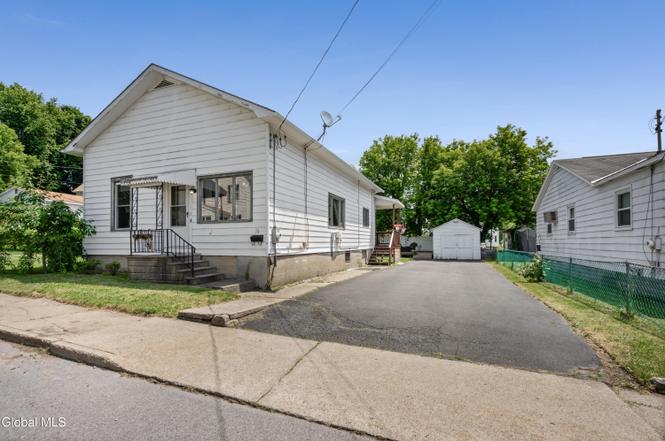
36 Maple St · Mechanicville, NY
Flood risk 1/10 · Minimal
- FEMA flood zone
- —
- Chance of flooding over 30 yrs
- 0.0%
- Est. flood insurance / yr
- —
Fire risk 2/10 · Minimal
- Est. fire insurance / yr
- $691 – $1,283
Heat risk 4/10 · Minor
- Hot days now (above 97°F)
- 7 days/yr
- Hot days in 30 yrs
- 17 days/yr
Wind risk 3/10 · Minor
- Chance of severe wind over 30 yrs
- 6.0%
Air-quality risk 2/10 · Minimal
- Unhealthy air days now
- 0 days/yr
- Unhealthy air days in 30 yrs
- 1 days/yr
Risk factors via First Street. Map © Google.
Why this score? — see what drove the F grade
The composite is a weighted blend of 9 inputs, each scored 0–100. Each bar is that input's sub-score; the figure is the points it added to the 100-point composite (weight × sub-score).
- Appreciation +10.0/10.0
- Cash flow +6.9/30.0
- Schools +4.9/10.0
- Livability +3.4/5.0
- Rent growth +2.5/5.0
- Condition / age +2.5/5.0
- 1% rule +2.3/10.0
- DSCR +1.1/10.0
- ARV discount +0.0/15.0
$229,999
🖨 Deal sheet (PDF) 📄 Offer letter ✓ Due diligence
Listing remarks MLS
This is it! The move in ready home you have been waiting for! Whether you are downsizing to one floor living or buying your very first home, this one has everything you need with bonus items you will love. Two bedrooms, plus a bonus room (office, den, etc), a laundry/pantry and a gorgeous kitchen as well! Lovingly maintained with a great patio and yard for entertaining--come see this fantastic home before it's gone!
Key facts
- 5,227 sq ft lot
- Garage
- Built 1915
Property features AI
Exterior
- Parking: Detached garage; 1 garage space; Total 5 parking spaces
- Security: Carbon monoxide detector(s)
- Utilities: 150 amp electric service; Public water; Public sewer; Cable available
- Home design: Single family residence; Basement with interior entry (full, unfinished); Solar generation
- Construction: Aluminum siding; Asphalt roof; Concrete perimeter foundation; Built on a 0.12-acre lot (approx. 54 x 97.9)
- Exterior features: Covered patio/porch; Driveway is paved; Level, cleared lot
Interior
- Kitchen: Dishwasher; Gas oven; Range; Range hood; Refrigerator; Solid surface counters
- Bedrooms: Three bedrooms on the first floor
- Flooring: Tile; Carpet; Laminate
- Bathrooms: One full bathroom on the first floor
- Heating & cooling: Natural gas heating; Radiant heat
- Interior features: Paddle fan; Solid surface counters; Mirrored closet doors; Bay windows; 8 total rooms
- Laundry & utility: Main level laundry room; Washer; Dryer
Neighborhood map
What this means for you Summary
Snapshot
- This is a 3-bed/1.0-bath single-family listed at $230k.
Deal economics
- At list price, monthly cash flow is $-352 ($-4k/yr) — negative.
- To cash-flow at today's rent, offer at most $168k (27.1% below list).
- To meet the 1% rule (rent ≥ 1% of price), the offer needs to be $169k (26.7% below list).
- Recommended offer: $168k (27.1% below list) — sets the bar for cash-flow.
- Cap rate 4.5% vs local median 1.9% in Mechanicville — top-decile yield for the area; either an underpriced asset or a hidden risk that comps aren't pricing in. Stress-test before assuming the spread holds.
Location & tenants
- Location reads 67/100 on livability (#568 in NY) — a middle-class / working-renter tenant base. Strengths: housing A+, health & safety A+, cost of living B+; Watch: amenities C-, crime D+, employment D.
- Mechanicville City School District (rural): math 57% / reading 57% proficiency, ranked #270 of 590 in NY (top 46%) — acceptable for families but not a draw, mixed tenant base, ~2y average lease.
- Zoned schools: Mechanicville Elementary School (math 57% / reading 53%, grade C, #905 of 2,108 statewide, top 43%, 600 students, 52% FRL); Mechanicville Junior/Senior High School (math 60% / reading 62%, grade C+, #843 of 1,100 statewide, top 77%, 746 students, 45% FRL) — zoned schools average 48% FRL vs 30% district-wide (18 pts higher); higher-poverty schools than district average — tighter screening recommended.
- Market conditions: 145 active listings in the ZIP; 5 comparable units currently listed for rent nearby; rentals at typical pace (median 17d on market — plan ~3-4 weeks tenant-placement turnaround); solid renter incomes; 1,132 units permitted in Saratoga County in 2024 (378 in 5+ unit buildings).
Forward outlook
- In year one you build about $25k of equity ($2k loan paydown + $23k appreciation (10.0% local appreciation)).
- Saratoga County population projected at +4% by 2050 — modest demand growth; plan on rents tracking national, not racing it.
- By year 2, paydown + projected appreciation supports a ~$40k cash-out refi (75% LTV) — recoverable capital for the next deal without selling this one.
Negotiation context
- Only 5 days on market — expect competitive offers; lowballing is unlikely to land.
- 5 sale attempts since 28y ago with the ask held roughly flat each time — persistent listings suggest the price (not the market) is what's stuck; bring a comps-based counter.
- Current owner paid $175k; 31% above their basis — modest negotiation headroom, anchor on the comps not their cost.
Risks & watch-outs
- Watch-outs: built in 1915 — expect roof / HVAC / electrical / plumbing capex.
Questions for the listing agent
- What do current leases actually rent for vs. the listed asking? Can we see a recent rent roll and the last 12 months of T-12 income?
- Built in 1915 — when were the roof, HVAC, electrical panel, plumbing, and water heater last replaced?
- Is there a deadline driving the sale (1031 exchange, divorce, estate, relocation)? That informs how much negotiation room exists.
- Schools are B-rated — typically a magnet for longer-tenancy family renters. What's the average tenant stay here, and is there a school-zone premium baked into asking?
- Crime grade is D in this area — have there been break-ins, vandalism, or insurance claims at this property in the last 3 years? What carrier currently insures it and at what premium?
- The area grade is low — what's the realistic commute time and amenity access for the typical tenant pool here? Any planned neighborhood developments (good or bad) we should know about?
- What's the average days-on-market for RENTAL listings here right now (not sales)? A rising rental-DOM trend means longer vacancies and softer asking-rent achievability than the comps imply.
- What's the recent tenant-quality profile in this submarket — average credit score on applications, eviction rate, late-payment / NSF rate, and stable-employment percentage? A property-management company in the area should have these aggregated.
- How much new for-sale + rental construction is in the pipeline within 1–3 miles? Heavy new supply typically softens prices + rents 12–24 months out; constrained supply supports both.
Investment metrics
- 1% rule
- 0.73% ✗
- Cap rate
- 4.46%
- Cash-on-cash
- -6.56%
- DSCR
- 0.71
- GRM
- 11.4
CMA / ARV
- ARV (on-the-fly)
- $180,481
- Comps found
- 4
Show comp detail 4 sales within ~0.75 mi
| Address | Dist | Beds/Ba | Sqft | Sold | Price | $/sf | Match |
|---|---|---|---|---|---|---|---|
| 137 Viall Ave | 0.12mi | 3/1.0 | 1,196 (+7%) | 6mo | $277,000 | $232 | 78 |
| 9 Tenandaho Ln | 0.16mi | 3/1.5 | 1,140 (+2%) | 14mo | $145,000 | $127 | 76 |
| 42 Warsaw Ave | 0.04mi | 3/1.5 | 1,260 (+12%) | 3mo | $200,000 | $159 | 73 |
| 25 Warsaw Ave Apt 15 | 0.09mi | 2/1.5 (-1) | 960 (-14%) | 9mo | $155,000 | $161 | 57 |
Match score weights: distance 35% · size 25% · config 20% · recency 20%. Top-matched comps best support the ARV.
Projected returns pro-forma
10.0% appreciation · 3.0% rent growth · sell at horizon
- IRR
- 19.7%
- Equity multiple
- 2.60×
- Total profit
- $102,913
- Equity at exit
- $207,201
- IRR
- 18.1%
- Equity multiple
- 5.98×
- Total profit
- $320,871
- Equity at exit
- $446,837
Cash invested: $64,400 (down + closing). Projections, not guarantees.
Landlord ↔ Tenant lean methodology
- Overall (STATE)
- 15 Strongly Tenant-Friendly
- State New York
- 15 Strongly Tenant-Friendly · D+10
- County
- — inherits STATE
- City
- — inherits STATE
ZIP-level market 12118
- Home prices YoY
- 8.3%
- Active inventory
- 145
- Price-to-rent
- 11.4×
Monthly cashflow live
- Estimated rent
- $1,687 high interval (Pro) →
- Mortgage (P&I)
- −$1,206
- Tax from tax record
- −$383 /mo · $4,593/yr
- Insurance
- −$96
- HOA
- −$0
- Lot rent
- −$0
- Vacancy / Maint / Mgmt
- −$354
- Net cashflow
- $-352
Break-even live
Sensitivity live
| Price | -10% $-222 | -5% $-287 | +0% $-352 | +5% $-417 | +10% $-482 |
|---|---|---|---|---|---|
| Rent | -10% $-485 | -5% $-419 | +0% $-352 | +5% $-286 | +10% $-219 |
| Rate | -1.0pp $-236 | -0.5pp $-294 | base $-352 | +0.5pp $-412 | +1.0pp $-472 |
UW: 25.0% down · 7.5% · 30yr · 1.5% tax · 5.0% vac · 8.0% maint · 8.0% mgmt
Financing live
Cash to close
- Down payment
- $57,500
- Closing costs
- $6,900
- Reserves months
- —
- Total cash needed
- —
Loan-product check · same deal, 3 products live
Conventional
25% down · 7.5% · 30yr
- Down + closing
- —
- Monthly P&I
- —
- Monthly cashflow
- —
- DSCR
- —
- Eligible?
- —
Personal DTI + credit; lowest rate.
DSCR
20% down · 8.5% · 30yr
- Down + closing
- —
- Monthly P&I
- —
- Monthly cashflow
- —
- DSCR
- —
- Eligible?
- —
No personal income docs; deal must DSCR.
Hard money
10% down · 12.0% · 12mo
- Down + closing
- —
- Monthly P&I
- —
- Monthly cashflow
- —
- DSCR
- —
- Eligible?
- —
Short-term bridge; refi at stabilization.
Rent comps 5 comps
| Address | Beds | Baths | Sqft | Rent | $/sqft | DOM | Units | Dist |
|---|---|---|---|---|---|---|---|---|
| 23 Warsaw Ave Mechanicville, NY | 2.0 | 1.5 | 960 | $1,550 | $1.61 | 16d | 1 | 0.07mi |
| 26 Penrose Ave Mechanicville, NY | 3.0 | 1.0 | 1200 | $1,850 | $1.54 | 16d | 1 | 0.24mi |
| 61 S Main St #2 Mechanicville, NY | 2.0 | 1.0 | 1100 | $1,300 | $1.18 | 25d | 1 | 0.69mi |
| 25 Green St Mechanicville, NY | 2.0 | 1.0 | 916 | $1,450 | $1.58 | 16d | 1 | 0.72mi |
| 26 Lee St Mechanicville, NY | 2.0 | 1.0 | 1100 | $1,399 | $1.27 | 46d | 1 | 0.81mi |
Listing history 4 events
-
2026-06-21days on market $229,999 Active 5 DOM
-
2026-06-18days on market $229,999 Active 2 DOM
-
2026-06-16remarks 596-char remark
-
2026-06-16$229,999 Active 1 DOM
ⓘ Source: listings_history table (triggers on properties + properties_extension) + one-shot
backfill from property_details.listing_events for pre-trigger history.
Tax reassessment forecast NY · Partial reset (capped growth)
- Current annual tax
- $4,593 · $383/mo
- Projected year-2 tax
- $4,593 · $383/mo
- Expected delta
- $0/yr ($0/mo · 0.0%)
ⓘ Screening estimate from a state-policy table — verify with the county assessor before closing.
Climate risk First Street
- Flood 1/10 Low 0% chance over 30 yrs
- Wildfire 2/10 Low
- Heat 4/10 Moderate 7 d/yr ≥97°F today · 17 d/yr by 30 yrs out
- Wind 3/10 Moderate 6% chance of damaging wind over 30 yrs
- Air quality 2/10 Low 0 unhealthy d/yr today · 1 by 30 yrs out
Nearby sold comps map
Loading sold comps map…
Walkable amenities ~0.75 mi
Loading nearby amenities…
Taxation est. · year 1
- Rental income
- $20,241
- − Mortgage interest
- −$12,884
- − Property taxes
- −$4,593
- − Insurance
- −$1,150
- − Repairs & maintenance
- −$1,619
- − Management
- −$1,619
- − Depreciation
- −$6,691
- Taxable loss
- −$8,316
- Est. tax savings @ 24.0%
- +$1,996
- After-tax cash flow
- $-2,231/yr
For passive investors: Depreciation is non-cash, so a rental often shows a tax loss while cash-flowing — sheltering income. Rental losses are passive: they offset passive income freely, and up to $25,000/yr can offset ordinary (W-2) income if you actively participate and your MAGI is under $100k (phasing out to $0 by $150k); unused losses carry forward. On sale, claimed depreciation is recaptured at up to 25%, and gains may owe capital-gains tax (a 1031 exchange can defer both). Figures are a year-1 estimate at your 24.0% rate — not tax advice; consult a CPA.
Schools (NCES district)
- District
- Mechanicville City School District
- NCES district ID
- 3618900
- Math proficiency
- 57% ▼ -3.00%
- Reading proficiency
- 57% ▲ 5.00%
- Median HH income
- $57,701
- Composite
- 49.33/100
- National rank
- #2021
- State rank
- #270 of 590 in NY
Livability — Mechanicville
- Score
- 67/100
- State rank
- #568
- US rank
- #10227
Category grades
Schools grade is shown separately in the Schools card above.
Census & demographics
- Census place
- Mechanicville, NY
- County
- Saratoga County · 166,192 people
- City population
- 17,069
- Metro
- Albany-Schenectady-Troy, NY
- Population (ZIP)
- 17,069
- Household income
- $92,710
- Rent vs Own
- Severe rent burden
- 552.0
Population outlook (Saratoga County) Hauer SSP2
- Today (2025)
- 238,889 people
- By 2030
- 243,681 · +2.0%
- By 2040
- 249,118 · +4.3%
- By 2050
- 248,638 · +4.1%
- By 2075
- 241,675 · +1.2%
- By 2100
- 213,150 · -10.8%
Race, ethnicity, and origin ACS 2023
- Neighborhood character
- Predominantly White (88%)
- Race & ethnicity
- White 88% Two or more races 5% Hispanic / Latino 4% Asian 3%
- Common ancestry
- Lithuanian 8% Romanian 8% Iranian 2%
- Foreign-born
- 5% · Canada, China
- Languages at home
- 92% English-only · Spanish 3% Other Indo-European 2% Chinese 1%
Political lean MEDSL · Saratoga
- 2024 margin
- Toss-up / Even · D 50.9% · R 49.1%
- 2008→2024 swing
- -1.6pp toward R · 2008: 3.4pp · 2024: 1.8pp
- All cycles
- 2024: D+1.8 2020: D+5.4 2016: R+4.4 2012: D+2.1 2008: D+3.4
Not yet ingested
- Civics
- —
Market trends
- HPI YoY
- ▲ 26.43%
- Current HPI
- 343.9893
- Rent YoY
- —
- Metro
- Albany-Schenectady-Troy, NY
- State GDP YoY
- ▲ 2.60%
- F500 in state
- 92
Industry mix (Fortune 500 HQ in NY)
| Industry | F500 HQs | Revenue |
|---|---|---|
| Financial Services | 10 | $950B |
|
||
| Consumer Goods | 9 | $162B |
|
||
| Insurance | 4 | $225B |
|
||
| Telecommunications | 2 | $144B |
|
||
| Pharmaceuticals | 2 | $112B |
|
||
| Media / Entertainment | 2 | $69B |
|
||
Price history
+284.0% since first listed17 events — show timeline
- 2026-06-16 Listed $229,999 Global MLS
- 2020-11-12 Sold (Public Records) $175,000 Public Records
- 2020-10-22 Sold (MLS) $175,100 Global MLS
- 2020-08-21 Pending — Global MLS
- 2020-08-17 Listed $162,500 Global MLS
- 2015-09-28 Sold (Public Records) $125,000 Public Records
- 2015-08-28 Sold (MLS) $125,000 Global MLS
- 2015-07-23 Listing Removed — Global MLS
- 2015-07-14 Listed $125,000 Global MLS
- 2008-02-22 Sold (Public Records) $80,000 Public Records
- 2008-02-13 Sold (MLS) $80,000 Global MLS
- 2007-11-29 Listing Removed — Global MLS
- 2007-10-15 Listed $99,500 Global MLS
- 1998-10-14 Sold (Public Records) $56,000 Public Records
- 1998-10-02 Sold (MLS) $56,000 Global MLS
- 1998-08-24 Listing Removed — Global MLS
- 1998-05-14 Listed $59,900 Global MLS
Property tax history
+1.3%/yrLatest (2025): $4,593 · +116.2% YoY. Source: county tax records.
Cash-flow waterfall
monthlySold comps — $/sqft
last 12 mo · ≤1 miLoading sold comps…