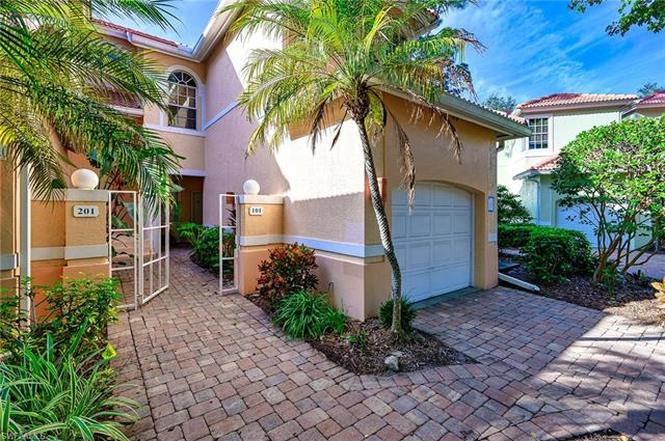
15161 Storrington Pl Unit F101 · Bonita Springs, FL
Flood risk 7/10 · Major
- FEMA flood zone
- X (shaded)
- Chance of flooding over 30 yrs
- 0.87%
- Est. flood insurance / yr
- $507 – $1,088
Fire risk 3/10 · Minor
- Est. fire insurance / yr
- $947 – $1,759
Heat risk 10/10 · Severe
- Hot days now (above 107°F)
- 7 days/yr
- Hot days in 30 yrs
- 30 days/yr
Wind risk 10/10 · Severe
- Chance of severe wind over 30 yrs
- 99.0%
Air-quality risk 2/10 · Minimal
- Unhealthy air days now
- 1 days/yr
- Unhealthy air days in 30 yrs
- 1 days/yr
Risk factors via First Street. Map © Google.
Why this score? — see what drove the D grade
The composite is a weighted blend of 9 inputs, each scored 0–100. Each bar is that input's sub-score; the figure is the points it added to the 100-point composite (weight × sub-score).
- Cash flow +11.3/30.0
- ARV discount +7.5/15.0
- 1% rule +6.1/10.0
- Schools +5.0/10.0
- Condition / age +4.0/5.0
- Livability +3.5/5.0
- DSCR +3.3/10.0
- Rent growth +2.2/5.0
- Appreciation +0.0/10.0
$429,000
🖨 Deal sheet (PDF) 📄 Offer letter ✓ Due diligence
Listing remarks
Nestled in the quiet and beautifully maintained conclave of coach homes is this rarely available first floor Bay Forest home with attached 1 car garage. Welcome to 15161 Storrington Place in Bay Forest; perfect for the full time resident or snowbirds. With almost 1800 square feet (1779 sq. feet) of indoor living space, this home offers a perfectly designed open floor plan, featuring a granite kitchen, full dining room, spacious great room, large lanai, large master bedroom, 2nd bedroom, bath and den. The Great Room provides spacious room for entertaining featuring 4 large sliding doors to the large Lanai which is surrounded by beautiful plantings and creates an atmosphere of privacy and ser
Key facts
- Spa like soaking tub
- Large lanai
- Granite kitchen
Tags
Property features AI
Finance
- Other: Part of a complex with 60 units; 4 units per building; 2 total floors; 1 unit per floor; Lot is regular and identified as unit 101; total area recorded as 2,231 (source: Property Appraiser Office); Restrictions: No RV, No truck
- HOA & community: Mandatory HOA (professional management); Quarterly condo fee; Condo fee $2,876 per quarter; Total annual recurring HOA fees $11,504; One-time fees $100; HOA maintenance covers cable, internet/WiFi access, irrigation water, lawn/land maintenance, and exterior pest control; Community amenities include clubhouse, community pool, exercise room, library, bike and jog path, bocce court, pickleball, shuffleboard, tennis court, and underground utilities
Exterior
- Parking: Attached 1-car garage
- Security: Gated community
- Utilities: Central water; Central sewer; Cable available
- Home design: Townhouse (Carriage/Coach); Residential property; Rear exposure facing southwest; Built in 1995; Located in the gated Bay Forest community (Storrington Place)
- Construction: Concrete block construction; Stucco exterior; Tile roof; Double-hung windows
- Exterior features: Patio; Landscaped area view; Reclaimed irrigation
Interior
- Kitchen: Range; Microwave; Dishwasher; Refrigerator
- Bedrooms: 2 bedrooms plus den; Split bedroom floor plan
- Flooring: Tile; Vinyl
- Bathrooms: 2 full bathrooms; Master bath with dual sinks and separate tub and shower
- Heating & cooling: Central electric heat; Central electric cooling
- Interior features: Cable prewire; Smoke detectors; Walk-in closet; Den (study); Screened lanai/porch; Dining in living area and eat-in kitchen; Unfurnished
- Laundry & utility: Washer and dryer in residence; Auto garage door
Neighborhood map
What this means for you Summary
Snapshot
- This is a 2-bed/2.0-bath townhouse listed at $429k. Condition is rated good.
Deal economics
- At list price, monthly cash flow is $-221 ($-3k/yr) — negative.
- To cash-flow at today's rent, offer at most $397k (7.5% below list).
- Meets the 1% rule at list price ($5k rent vs $429k).
- Recommended offer: $378k (12.0% below list) — sets the bar for market timing.
- Cap rate 5.9% vs local median 1.7% in Bonita Springs — top-decile yield for the area; either an underpriced asset or a hidden risk that comps aren't pricing in. Stress-test before assuming the spread holds.
Location & tenants
- Location reads 70/100 on livability (#428 in FL) — a middle-class / working-renter tenant base. Strengths: crime A+, housing A+, employment A; Watch: cost of living C-, health & safety D, amenities F.
- Collier (suburban): math 60% / reading 56% proficiency, ranked #16 of 73 in FL (top 22%) — acceptable for families but not a draw, mixed tenant base, ~2y average lease.
- Zoned schools: Naples Park Elementary School (math 67% / reading 57%, grade B, #608 of 2,144 statewide, top 29%, 395 students, 48% FRL); North Naples Middle School (math 79% / reading 73%, grade A, #34 of 571 statewide, top 6%, 903 students, 25% FRL); Gulf Coast High School (math 57% / reading 68%, grade B-, #93 of 667 statewide, top 14%, 2,447 students, 20% FRL) — zoned schools average 31% FRL vs 55% district-wide (24 pts lower); this property's tenant base skews higher-income than the district average.
- Market conditions: Rents soft (-1.1%/yr); 594 active listings in the ZIP; 40 comparable units currently listed for rent nearby; rentals at typical pace (median 26d on market — plan ~3-4 weeks tenant-placement turnaround); solid renter incomes; 3,520 units permitted in Collier County in 2024 (959 in 5+ unit buildings).
- At $4,771/mo this rent would consume 59% of the median local household income ($98k/yr) (locally 1006% of renters already pay >50% of income on rent) — very limited rent-growth headroom before tenants either downsize or default.
Forward outlook
- Local home prices are declining (-3.0%/yr); year-one equity from $3k of loan paydown is wiped out by about $13k of value loss. Plan a longer hold.
- Collier County population projected at +30% by 2050 — long-run rental-demand tailwind backs the buy-and-hold thesis.
Negotiation context
- It's been on market 191 days — a 12% lower offer ($378k) is reasonable based on typical stale-listing flexibility.
Risks & watch-outs
- Watch-outs: flood insurance adds $66/mo; HOA is 20% of rent.
- Climate carrying-cost: major flood risk; severe wind risk, 99% chance of damaging wind over 30y; extreme-heat days projected 7→30/yr by 2055 (HVAC capex compounding) — expect insurance premiums to compound above CPI over the hold.
Questions for the listing agent
- What do current leases actually rent for vs. the listed asking? Can we see a recent rent roll and the last 12 months of T-12 income?
- It's been on market 191 days. Have you received any prior offers? Is the seller open to a 12% concession, seller financing, or rate buy-down credit?
- What's the actual annual flood-insurance premium (NFIP or private), and is the property in a SFHA with mandatory coverage?
- What does the HOA fee cover, when was the last increase, and are there any pending special assessments or reserve-fund shortfalls?
- Why hasn't it sold? Are there any deal-killer items the seller is aware of (foundation, flood, title, zoning, code violations)?
- Is there a deadline driving the sale (1031 exchange, divorce, estate, relocation)? That informs how much negotiation room exists.
- The area grade is low — what's the realistic commute time and amenity access for the typical tenant pool here? Any planned neighborhood developments (good or bad) we should know about?
- What's the average days-on-market for RENTAL listings here right now (not sales)? A rising rental-DOM trend means longer vacancies and softer asking-rent achievability than the comps imply.
- What's the recent tenant-quality profile in this submarket — average credit score on applications, eviction rate, late-payment / NSF rate, and stable-employment percentage? A property-management company in the area should have these aggregated.
- How much new for-sale + rental construction is in the pipeline within 1–3 miles? Heavy new supply typically softens prices + rents 12–24 months out; constrained supply supports both.
Investment metrics
- 1% rule
- 1.11% ✓
- Cap rate
- 5.86%
- Cash-on-cash
- -1.55%
- DSCR
- 0.93
- GRM
- 7.5
CMA / ARV
No comps found within radius.
Projected returns pro-forma
-3.0% appreciation · 0.0% rent growth · sell at horizon
- IRR
- -24.5%
- Equity multiple
- 0.19×
- Total profit
- $-96,892
- Equity at exit
- $63,965
- IRR
- -39.8%
- Equity multiple
- -0.28×
- Total profit
- $-153,702
- Equity at exit
- $37,092
Cash invested: $120,120 (down + closing). Projections, not guarantees.
Landlord ↔ Tenant lean methodology
- Overall (STATE)
- 87 Strongly Landlord-Friendly
- State Florida
- 87 Strongly Landlord-Friendly · R+3
- County
- — inherits STATE
- City
- — inherits STATE
ZIP-level market 34110
- Rents YoY
- -1.1%
- Active inventory
- 594
- Price-to-rent
- 7.5×
Monthly cashflow live
- Estimated rent
- $4,771 high interval (Pro) →
- Mortgage (P&I)
- −$2,250
- Tax est. 1.5%
- −$536 /mo · $6,435/yr
- Insurance
- −$179
- Flood insurance flood zone
- −$66 /mo · $798/yr
- HOA
- −$959
- Lot rent
- −$0
- Vacancy / Maint / Mgmt
- −$1,002
- Net cashflow
- $-221
Break-even live
Sensitivity live
| Price | -10% $75 | -5% $-73 | +0% $-221 | +5% $-370 | +10% $-518 |
|---|---|---|---|---|---|
| Rent | -10% $-598 | -5% $-410 | +0% $-221 | +5% $-33 | +10% $156 |
| Rate | -1.0pp $-5 | -0.5pp $-112 | base $-221 | +0.5pp $-332 | +1.0pp $-446 |
UW: 25.0% down · 7.5% · 30yr · 1.5% tax · 5.0% vac · 8.0% maint · 8.0% mgmt
Financing live
Cash to close
- Down payment
- $107,250
- Closing costs
- $12,870
- Reserves months
- —
- Total cash needed
- —
Loan-product check · same deal, 3 products live
Conventional
25% down · 7.5% · 30yr
- Down + closing
- —
- Monthly P&I
- —
- Monthly cashflow
- —
- DSCR
- —
- Eligible?
- —
Personal DTI + credit; lowest rate.
DSCR
20% down · 8.5% · 30yr
- Down + closing
- —
- Monthly P&I
- —
- Monthly cashflow
- —
- DSCR
- —
- Eligible?
- —
No personal income docs; deal must DSCR.
Hard money
10% down · 12.0% · 12mo
- Down + closing
- —
- Monthly P&I
- —
- Monthly cashflow
- —
- DSCR
- —
- Eligible?
- —
Short-term bridge; refi at stabilization.
Rent comps 40 comps
| Address | Beds | Baths | Sqft | Rent | $/sqft | DOM | Units | Dist |
|---|---|---|---|---|---|---|---|---|
| 386 Emerald Bay Cir Unit G4 Naples, FL | 3.0 | 2.0 | 1490 | $2,500 | $1.68 | 26d | 1 | 0.17mi |
| 306 Emerald Bay Cir Unit J8 Naples, FL | 2.0 | 2.0 | 1350 | $4,000 | $2.96 | 26d | 1 | 0.19mi |
| 306 Emerald Bay Cir Unit J5 Naples, FL | 3.0 | 2.0 | 1490 | $5,900 | $3.96 | 26d | 1 | 0.19mi |
| 290 Naples Cove Dr Naples, FL | 2.0 | 2.0 | 1327 | $3,400 | $2.56 | 26d | 3 | 0.23mi |
| 15191 Cedarwood Ln #2602 Naples, FL | 2.0 | 2.0 | 1267 | $2,300 | $1.82 | 26d | 1 | 0.23mi |
| 15161 Cedarwood Ln Naples, FL | 2.0 | 2.0 | 1267 | $4,000 | $3.16 | 26d | 3 | 0.24mi |
| 15400 Cedarwood Ln Unit 1-201 Naples, FL | 2.0 | 2.0 | 1286 | $6,000 | $4.67 | 26d | 1 | 0.25mi |
| 15400 Cedarwood Ln #102 Naples, FL | 2.0 | 2.0 | 1286 | $6,300 | $4.90 | 16d | 1 | 0.25mi |
| 285 Naples Cove Dr #1103 Naples, FL | 2.0 | 2.0 | 1267 | $2,475 | $1.95 | 26d | 1 | 0.26mi |
| 505 Lake Louise Cir #101 Naples, FL | 2.0 | 2.0 | 1444 | $5,500 | $3.81 | 26d | 1 | 0.27mi |
| 270 Naples Cove Dr #3506 Naples, FL | 3.0 | 2.0 | 1475 | $2,500 | $1.69 | 23d | 1 | 0.29mi |
| 15415 Cedarwood Ln Unit 3 Naples, FL | 2.0 | 2.0 | 1428 | $2,200 | $1.54 | 16d | 1 | 0.32mi |
| 513 Lake Louise Cir #202 Naples, FL | 2.0 | 2.0 | 1444 | $5,300 | $3.67 | 26d | 1 | 0.34mi |
| 341 Emerald Bay Cir Unit T5 Naples, FL | 3.0 | 2.0 | 1611 | $4,500 | $2.79 | 26d | 1 | 0.35mi |
| 526 Lake Louise Cir Unit 4-403 Naples, FL | 3.0 | 2.0 | 1740 | $6,500 | $3.74 | 26d | 1 | 0.47mi |
| 1001 Arbor Lake Dr Naples, FL | 2.0–3.0 | 2.0–2.5 | 1755 | $3,800 | $2.16 | 26d | 2 | 0.47mi |
| 14780 Glen Eden Dr Naples, FL | 3.0 | 2.5 | 2184 | $8,000 | $3.66 | 26d | 1 | 0.49mi |
| 28070 Winthrop Cir Bonita Springs, FL | 3.0 | 3.0 | 2008 | $12,000 | $5.98 | 26d | 1 | 0.84mi |
| 28712 Carmel Way Bonita Springs, FL | 3.0 | 2.5 | 1626 | $9,250 | $5.69 | 26d | 1 | 0.87mi |
| 28211 Winthrop Cir Bonita Springs, FL | 3.0 | 2.0 | 1918 | $10,500 | $5.47 | 26d | 1 | 0.93mi |
| 3930 Windward Passage Cir #202 Bonita Springs, FL | 2.0 | 2.0 | 1478 | $1,900 | $1.29 | 18d | 1 | 0.95mi |
| 817 Carrick Bend Cir #101 Naples, FL | 3.0 | 2.0 | 1660 | $5,995 | $3.61 | 16d | 1 | 0.95mi |
| 28650 Carriage Home Dr Unit 1049692P Bonita Springs, FL | 3.0 | 2.0 | 1528 | $3,980 | $2.60 | 18d | 1 | 0.98mi |
| 3951 Windward Passage Cir #102 Bonita Springs, FL | 2.0 | 2.0 | 1397 | $5,200 | $3.72 | 26d | 1 | 0.99mi |
| 360 Horse Creek Dr Naples, FL | 2.0 | 2.0 | 1589 | $5,250 | $3.30 | 16d | 4 | 1.04mi |
| 784 Carrick Bend Cir #101 Naples, FL | 3.0 | 2.0 | 1515 | $3,500 | $2.31 | 26d | 1 | 1.04mi |
| 340 Horse Creek Dr #304 Naples, FL | 2.0 | 2.0 | 1326 | $2,950 | $2.22 | 26d | 1 | 1.05mi |
| 62 8th St Unit 1073526P Bonita Springs, FL | 2.0 | 2.0 | 1593 | $5,435 | $3.41 | 26d | 1 | 1.05mi |
| 28611 Carriage Home Dr #101 Bonita Springs, FL | 2.0 | 2.0 | 1433 | $2,550 | $1.78 | 26d | 1 | 1.07mi |
| 945 Carrick Bend Cir #201 Naples, FL | 3.0 | 2.0 | 2360 | $2,995 | $1.27 | 16d | 1 | 1.08mi |
| 320 Horse Creek Dr #105 Naples, FL | 2.0 | 2.0 | 1326 | $5,600 | $4.22 | 26d | 1 | 1.08mi |
| 999 E Valley Dr Unit 1073522P Bonita Springs, FL | 3.0 | 2.5 | 1668 | $9,929 | $5.95 | 23d | 1 | 1.08mi |
| 1360 Sweetwater Cv #202 Naples, FL | 2.0 | 2.0 | 1279 | $5,500 | $4.30 | 26d | 1 | 1.08mi |
| 1390 Sweetwater Cv #203 Naples, FL | 2.0 | 2.0 | 1279 | $2,200 | $1.72 | 16d | 1 | 1.09mi |
| 28450 Winthrop Cir Unit 1546014P Bonita Springs, FL | 3.0 | 2.0 | 1894 | $7,804 | $4.12 | 16d | 1 | 1.09mi |
| 480 Bermuda Cove Way Unit 1-104 Naples, FL | 2.0 | 2.0 | 1372 | $4,250 | $3.10 | 26d | 1 | 1.10mi |
| 1405 Sweetwater Cv #204 Naples, FL | 3.0 | 2.0 | 1381 | $6,000 | $4.34 | 16d | 1 | 1.10mi |
| 1405 Sweetwater Cv #204 Naples, FL | 3.0 | 2.0 | 1381 | $6,000 | $4.34 | 26d | 1 | 1.10mi |
| 300 Horse Creek Dr #408 Naples, FL | 2.0 | 2.0 | 1434 | $5,500 | $3.84 | 26d | 1 | 1.10mi |
| 1025 Tarpon Cove Dr #203 Naples, FL | 2.0 | 2.0 | 1225 | $5,500 | $4.49 | 16d | 1 | 1.10mi |
HOA detail
- Monthly dues
- $959 · $11,508/yr
Listing history 13 events
-
2026-06-23days on market $429,000 Active 191 DOM
-
2026-06-21days on market $429,000 Active 190 DOM
-
2026-06-18days on market $429,000 Active 187 DOM
-
2026-06-17days on market $429,000 Active 186 DOM
-
2026-06-16days on market $429,000 Active 185 DOM
-
2026-06-15days on market $429,000 Active 184 DOM
-
2026-06-10days on market $429,000 Active 179 DOM
-
2026-06-09days on market $429,000 Active 178 DOM
-
2026-06-08days on market $429,000 Active 177 DOM
-
2026-06-07days on market $429,000 Active 176 DOM
-
2026-06-03days on market $429,000 Active 172 DOM
-
2026-06-03remarks 699-char remark
-
2026-06-03$429,000 Active 171 DOM
ⓘ Source: listings_history table (triggers on properties + properties_extension) + one-shot
backfill from property_details.listing_events for pre-trigger history.
Climate risk First Street
- Flood 7/10 Severe FEMA zone X (shaded) · 87% chance over 30 yrs
- Wildfire 3/10 Moderate
- Heat 10/10 Extreme 7 d/yr ≥107°F today · 30 d/yr by 30 yrs out
- Wind 10/10 Extreme 99% chance of damaging wind over 30 yrs
- Air quality 2/10 Low 1 unhealthy d/yr today · 1 by 30 yrs out
Nearby sold comps map
Loading sold comps map…
Walkable amenities ~0.75 mi
Loading nearby amenities…
Taxation est. · year 1
- Rental income
- $57,248
- − Mortgage interest
- −$24,031
- − Property taxes
- −$6,435
- − Insurance
- −$2,942
- − Repairs & maintenance
- −$4,580
- − Management
- −$4,580
- − HOA
- −$11,508
- − Depreciation
- −$12,480
- Taxable loss
- −$9,308
- Est. tax savings @ 24.0%
- +$2,234
- After-tax cash flow
- $-422/yr
For passive investors: Depreciation is non-cash, so a rental often shows a tax loss while cash-flowing — sheltering income. Rental losses are passive: they offset passive income freely, and up to $25,000/yr can offset ordinary (W-2) income if you actively participate and your MAGI is under $100k (phasing out to $0 by $150k); unused losses carry forward. On sale, claimed depreciation is recaptured at up to 25%, and gains may owe capital-gains tax (a 1031 exchange can defer both). Figures are a year-1 estimate at your 24.0% rate — not tax advice; consult a CPA.
Condition & rehab AI · 14 photos
This well-maintained townhouse in Bay Forest offers a good condition with minimal repairs needed. It's ready for immediate occupancy and would benefit from some exterior painting and landscaping maintenance to further enhance its value.
Value-add opportunities
- Resale Paint exterior trim — Enhances curb appeal and value
- Rental Clean gutters — Keeps property in good condition for tenants
- Both Inspect and replace any damaged landscaping — Improves curb appeal and maintains property value
Renovation cost estimate screening
Value-add ROI direction
- Resale Paint exterior trim — Enhances curb appeal and value ↑
- Rental Clean gutters — Keeps property in good condition for tenants ↑
- Both Inspect and replace any damaged landscaping — Improves curb appeal and maintains property value ↑
ⓘ Cost ranges are severity-bucket heuristics (US national rule-of-thumb). Get contractor quotes + a written scope before underwriting a rehab budget.
Schools (NCES district)
- District
- Collier
- NCES district ID
- 1200330
- Math proficiency
- 60% ▼ -4.00%
- Reading proficiency
- 56% ▼ -2.00%
- Median HH income
- $58,275
- Composite
- 50.23/100
- National rank
- #1892
- State rank
- #16 of 73 in FL
Livability — Bonita Springs
- Score
- 70/100
- State rank
- #428
- US rank
- #7576
Category grades
Schools grade is shown separately in the Schools card above.
Census & demographics
- County
- Collier County · 396,295 people
- City population
- 64,727
- Metro
- Naples-Marco Island, FL
- Population (ZIP)
- 25,630
- Household income
- $97,564
- Rent vs Own
- Severe rent burden
- 1006.0
Population outlook (Collier County) Hauer SSP2
- Today (2025)
- 420,858 people
- By 2030
- 450,054 · +6.9%
- By 2040
- 502,232 · +19.3%
- By 2050
- 544,932 · +29.5%
- By 2075
- 627,203 · +49.0%
- By 2100
- 659,015 · +56.6%
Race, ethnicity, and origin ACS 2023
- Neighborhood character
- Predominantly White (84%)
- Race & ethnicity
- White 84% Hispanic / Latino 10% Two or more races 9% Asian 2% Black 1%
- Hispanic origin (detail)
- Mexican 2% Puerto Rican 1% Cuban 3%
- Common ancestry
- Romanian 4% Lithuanian 3% Slovak 2%
- Foreign-born
- 11% · Canada, South Korea
- Languages at home
- 87% English-only · Spanish 7% Other Indo-European 3% French/Haitian/Cajun 1%
Political lean MEDSL · Collier
- 2024 margin
- Solid R (+33.1) · D 33.1% · R 66.2%
- 2008→2024 swing
- -10.6pp toward R · 2008: -22.5pp · 2024: -33.1pp
- All cycles
- 2024: R+33.1 2020: R+24.7 2016: R+26.0 2012: R+30.1 2008: R+22.5
Not yet ingested
- Civics
- —
Market trends
- HPI YoY
- ▼ -172.68%
- Current HPI
- 267.4644
- Rent YoY
- ▼ -1.06%
- Metro
- Naples-Marco Island, FL
- State GDP YoY
- ▲ 3.28%
- F500 in state
- 36
Industry mix (Fortune 500 HQ in FL)
| Industry | F500 HQs | Revenue |
|---|---|---|
| Industrial Technology | 2 | $29B |
|
||
| Insurance | 2 | $17B |
|
||
| Retail | 1 | $60B |
|
||
| Technology Distribution | 1 | $58B |
|
||
| Homebuilding | 1 | $35B |
|
||
| Technology Manufacturing | 1 | $35B |
|
||
Price history
-14.2% since first listed3 events — show timeline
- 2026-04-07 Price Changed $429,000 NAPLESMLS
- 2026-02-18 Price Changed $459,000 NAPLESMLS
- 2025-12-13 Listed $499,900 NAPLESMLS
Cash-flow waterfall
monthlySold comps — $/sqft
last 12 mo · ≤1 miLoading sold comps…