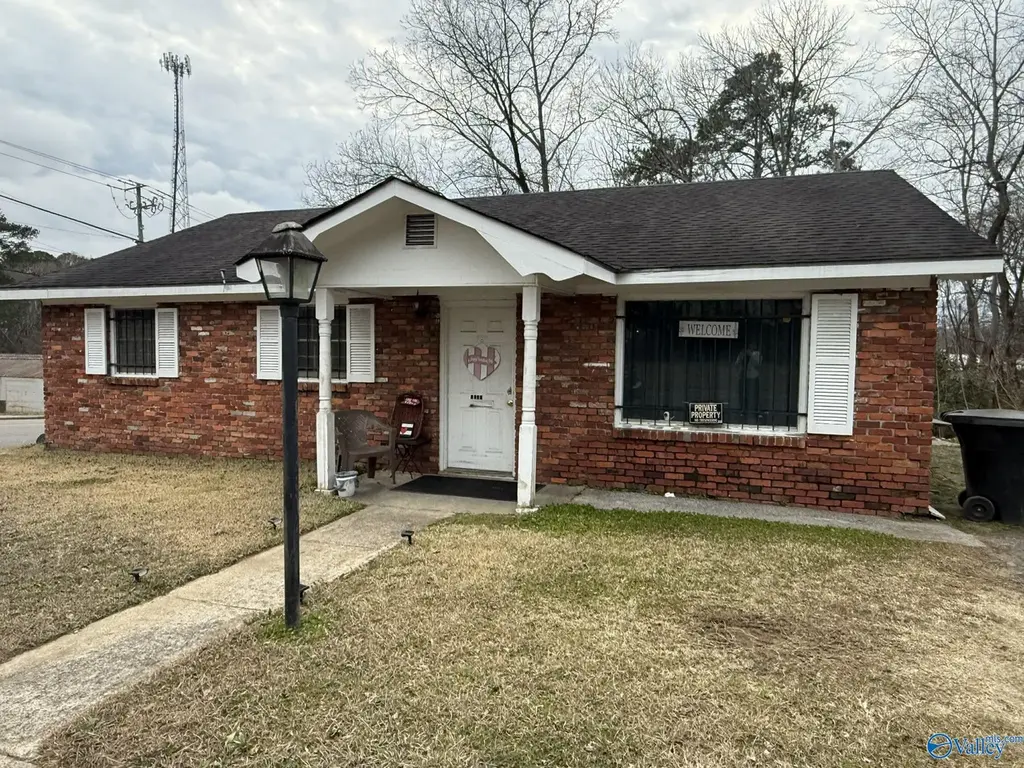
1601 Forrest Ave · Gadsden, AL
Flood risk No data
- FEMA flood zone
- —
- Chance of flooding over 30 yrs
- —
- Est. flood insurance / yr
- —
Fire risk No data
- Est. fire insurance / yr
- —
Heat risk No data
- Hot days now (above threshold)
- —
- Hot days in 30 yrs
- —
Wind risk No data
- Chance of severe wind over 30 yrs
- —
Air-quality risk No data
- Unhealthy air days now
- —
- Unhealthy air days in 30 yrs
- —
Risk factors via First Street. Map © Google.
Why this score? — see what drove the C grade
The composite is a weighted blend of 9 inputs, each scored 0–100. Each bar is that input's sub-score; the figure is the points it added to the 100-point composite (weight × sub-score).
- Cash flow +29.6/30.0
- DSCR +10.0/10.0
- 1% rule +8.3/10.0
- Livability +3.0/5.0
- Rent growth +2.5/5.0
- Schools +2.2/10.0
- Condition / age +2.2/5.0
- ARV discount +0.0/15.0
- Appreciation +0.0/10.0
$84,900
🖨 Deal sheet (PDF) 📄 Offer letter ✓ Due diligence
Listing remarks MLS
Updated 1,100+ sq ft brick home in the heart of Gadsden. This move-in ready property blends classic character with comfortable living space, featuring a spacious layout ideal for relaxing. The kitchen offers ample cabinet space and functionality for everyday use. Comfortable bedrooms provide great natural light. Enjoy the convenience of being just minutes from downtown shops, restaurants, parks, and everyday essentials. A low-maintenance exterior and large lot complete this inviting home. HVAC 2 years old.
Key facts
- Great natural light
- Large lot
- Brick home
Tags
Neighborhood map
What this means for you Summary
Snapshot
- This is a 4-bed/1.5-bath single-family listed at $85k. Condition is rated fair.
Deal economics
- At list price, monthly cash flow is $305 ($4k/yr) — positive.
- The deal already cash-flows at list — no discount required.
- Meets the 1% rule at list price ($1k rent vs $85k).
- Recommended offer: $75k (12.0% below list) — sets the bar for market timing.
- Cap rate 10.6% vs local median 5.0% in Gadsden — top-decile yield for the area; either an underpriced asset or a hidden risk that comps aren't pricing in. Stress-test before assuming the spread holds.
Location & tenants
- Location reads 59/100 on livability (#335 in AL) — a working-class tenant base; expect higher turnover. Strengths: cost of living A+, housing A+; Watch: crime F, amenities F, commute F.
- Gadsden City (urban): math 15% / reading 39% proficiency, ranked #87 of 129 in AL (top 67%) — low school quality limits family demand, transient renter base, plan for 1-2y turnover; 66% free/reduced lunch — lower-income household profile, screen leases tightly.
- Zoned schools: Floyd Elementary School (math 17% / reading 27%, grade F, #442 of 627 statewide, top 72%, 367 students, 85% FRL); Sansom Middle School (math 7% / reading 38%, grade F, #180 of 257 statewide, top 70%, 376 students, 84% FRL); Gadsden City High School (math 17% / reading 24%, grade F, #159 of 305 statewide, top 53%, 1,318 students, 76% FRL) — zoned schools average 82% FRL vs 66% district-wide (15 pts higher); higher-poverty schools than district average — tighter screening recommended.
- Market conditions: 88 active listings in the ZIP; 119 units permitted in Etowah County in 2024 (0 in 5+ unit buildings).
Forward outlook
- Local home prices are declining (-3.0%/yr); year-one equity from $587 of loan paydown is wiped out by about $3k of value loss. Plan a longer hold.
- Etowah County population projected at -12% by 2050 — secular population decline; favor cash flow + early exit over multi-decade hold.
- At projected returns (-3.0% appreciation + 3.0% rent growth), your $24k cash investment doubles in ~8 years — after that, you're playing with house money.
Negotiation context
- It's been on market 128 days — a 12% lower offer ($75k) is reasonable based on typical stale-listing flexibility.
Questions for the listing agent
- It's been on market 128 days. Have you received any prior offers? Is the seller open to a 12% concession, seller financing, or rate buy-down credit?
- Have any recent inspections been done? Can we get a copy of the seller's disclosures and any deferred-maintenance estimates?
- Built in 1966 — when were the roof, HVAC, electrical panel, plumbing, and water heater last replaced?
- Why hasn't it sold? Are there any deal-killer items the seller is aware of (foundation, flood, title, zoning, code violations)?
- Is there a deadline driving the sale (1031 exchange, divorce, estate, relocation)? That informs how much negotiation room exists.
- Crime grade is F in this area — have there been break-ins, vandalism, or insurance claims at this property in the last 3 years? What carrier currently insures it and at what premium?
- What's the average days-on-market for RENTAL listings here right now (not sales)? A rising rental-DOM trend means longer vacancies and softer asking-rent achievability than the comps imply.
- What's the recent tenant-quality profile in this submarket — average credit score on applications, eviction rate, late-payment / NSF rate, and stable-employment percentage? A property-management company in the area should have these aggregated.
- How much new for-sale + rental construction is in the pipeline within 1–3 miles? Heavy new supply typically softens prices + rents 12–24 months out; constrained supply supports both.
Investment metrics
- 1% rule
- 1.33% ✓
- Cap rate
- 10.61%
- Cash-on-cash
- 15.41%
- DSCR
- 1.69
- GRM
- 6.3
CMA / ARV
- ARV (median comp)
- $59,728
- List price
- $84,900
- Delta
- 42.14%
- Verdict
- OVERPRICED
- Comps
- 20 within 1.0 mi
Show comp detail 7 sales within ~0.75 mi
| Address | Dist | Beds/Ba | Sqft | Sold | Price | $/sf | Match |
|---|---|---|---|---|---|---|---|
| 1511 Malone St W #1 | 0.12mi | 3/1.0 (-1) | 1,197 (-0%) | 16mo | $25,000 | $21 | 74 |
| 1337 Alabama St | 0.23mi | 3/1.0 (-1) | 1,190 (-1%) | 14mo | $20,000 | $17 | 69 |
| 2201 Chestnut St | 0.54mi | 3/1.0 (-1) | 1,264 (+5%) | 7mo | $80,000 | $63 | 53 |
| 1403 Hill Ave | 0.24mi | 3/1.5 (-1) | 1,360 (+13%) | 13mo | $139,900 | $103 | 51 |
| 807 S 11th St | 0.74mi | 3/2.0 (-1) | 1,281 (+7%) | 2mo | $95,500 | $75 | 45 |
| 1033 4th Ave | 0.60mi | 3/1.0 (-1) | 1,100 (-8%) | 24mo | $50,000 | $45 | 31 |
| 1609 Tuscaloosa Ave | 0.62mi | 4/1.0 | 1,345 (+12%) | 22mo | $77,000 | $57 | 30 |
Match score weights: distance 35% · size 25% · config 20% · recency 20%. Top-matched comps best support the ARV.
Projected returns pro-forma
-3.0% appreciation · 3.0% rent growth · sell at horizon
- IRR
- 6.2%
- Equity multiple
- 1.24×
- Total profit
- $5,701
- Equity at exit
- $12,659
- IRR
- 15.6%
- Equity multiple
- 2.26×
- Total profit
- $30,068
- Equity at exit
- $7,341
Cash invested: $23,772 (down + closing). Projections, not guarantees.
Landlord ↔ Tenant lean methodology
- Overall (STATE)
- 90 Strongly Landlord-Friendly
- State Alabama
- 90 Strongly Landlord-Friendly · R+15
- County
- — inherits STATE
- City
- — inherits STATE
ZIP-level market 35904
- Home prices YoY
- -17.1%
- Active inventory
- 88
- Price-to-rent
- 6.3×
Monthly cashflow live
- Estimated rent
- $1,129 medium interval (Pro) →
- Mortgage (P&I)
- −$445
- Tax est. 1.5%
- −$106 /mo · $1,274/yr
- Insurance
- −$35
- HOA
- −$0
- Vacancy / Maint / Mgmt
- −$237
- Net cashflow
- $305
Break-even live
Sensitivity live
| Price | -10% $364 | -5% $335 | +0% $305 | +5% $276 | +10% $247 |
|---|---|---|---|---|---|
| Rent | -10% $216 | -5% $261 | +0% $305 | +5% $350 | +10% $394 |
| Rate | -1.0pp $348 | -0.5pp $327 | base $305 | +0.5pp $283 | +1.0pp $261 |
UW: 25.0% down · 7.5% · 30yr · 1.5% tax · 5.0% vac · 8.0% maint · 8.0% mgmt
Financing live
Cash to close
- Down payment
- $21,225
- Closing costs
- $2,547
- Reserves months
- —
- Total cash needed
- —
Loan-product check · same deal, 3 products live
Conventional
25% down · 7.5% · 30yr
- Down + closing
- —
- Monthly P&I
- —
- Monthly cashflow
- —
- DSCR
- —
- Eligible?
- —
Personal DTI + credit; lowest rate.
DSCR
20% down · 8.5% · 30yr
- Down + closing
- —
- Monthly P&I
- —
- Monthly cashflow
- —
- DSCR
- —
- Eligible?
- —
No personal income docs; deal must DSCR.
Hard money
10% down · 12.0% · 12mo
- Down + closing
- —
- Monthly P&I
- —
- Monthly cashflow
- —
- DSCR
- —
- Eligible?
- —
Short-term bridge; refi at stabilization.
Listing history 19 events
-
2026-06-21days on market $84,900 Active 128 DOM
-
2026-06-19days on market $84,900 Active 126 DOM
-
2026-06-18days on market $84,900 Active 125 DOM
-
2026-06-17days on market $84,900 Active 124 DOM
-
2026-06-16days on market $84,900 Active 123 DOM
-
2026-06-15days on market $84,900 Active 122 DOM
-
2026-06-14days on market $84,900 Active 120 DOM
-
2026-06-12days on market $84,900 Active 119 DOM
-
2026-06-09days on market $84,900 Active 116 DOM
-
2026-06-08days on market $84,900 Active 115 DOM
-
2026-06-07days on market $84,900 Active 114 DOM
-
2026-06-07days on market $84,900 Active 113 DOM
-
2026-06-04days on market $84,900 Active 110 DOM
-
2026-06-02days on market $84,900 Active 109 DOM
-
2026-06-01days on market $84,900 Active 108 DOM
-
2026-05-31days on market $84,900 Active 107 DOM
-
2026-05-31days on market $84,900 Active 106 DOM
-
2026-04-08price $84,900 511-char remark
Show marketing remark (511 chars)
Updated 1,100+ sq ft brick home in the heart of Gadsden. This move-in ready property blends classic character with comfortable living space, featuring a spacious layout ideal for relaxing. The kitchen offers ample cabinet space and functionality for everyday use. Comfortable bedrooms provide great natural light. Enjoy the convenience of being just minutes from downtown shops, restaurants, parks, and everyday essentials. A low-maintenance exterior and large lot complete this inviting home. HVAC 2 years old.
-
2026-02-13$89,000 Active 511-char remark
Show marketing remark (511 chars)
Updated 1,100+ sq ft brick home in the heart of Gadsden. This move-in ready property blends classic character with comfortable living space, featuring a spacious layout ideal for relaxing. The kitchen offers ample cabinet space and functionality for everyday use. Comfortable bedrooms provide great natural light. Enjoy the convenience of being just minutes from downtown shops, restaurants, parks, and everyday essentials. A low-maintenance exterior and large lot complete this inviting home. HVAC 2 years old.
ⓘ Source: listings_history table (triggers on properties + properties_extension) + one-shot
backfill from property_details.listing_events for pre-trigger history.
Nearby sold comps map
Loading sold comps map…
Walkable amenities ~0.75 mi
Loading nearby amenities…
Taxation est. · year 1
- Rental income
- $13,549
- − Mortgage interest
- −$4,756
- − Property taxes
- −$1,274
- − Insurance
- −$424
- − Repairs & maintenance
- −$1,084
- − Management
- −$1,084
- − Depreciation
- −$2,470
- Taxable income
- $2,458
- Est. tax owed @ 24.0%
- −$590
- After-tax cash flow
- $3,073/yr
For passive investors: Depreciation is non-cash, so a rental often shows a tax loss while cash-flowing — sheltering income. Rental losses are passive: they offset passive income freely, and up to $25,000/yr can offset ordinary (W-2) income if you actively participate and your MAGI is under $100k (phasing out to $0 by $150k); unused losses carry forward. On sale, claimed depreciation is recaptured at up to 25%, and gains may owe capital-gains tax (a 1031 exchange can defer both). Figures are a year-1 estimate at your 24.0% rate — not tax advice; consult a CPA.
Condition & rehab AI · 12 photos
This 1,100+ sq ft brick home requires moderate renovations to update the kitchen and bathrooms, and improve the exterior paint. It has a good roof and foundation, making it a solid investment opportunity.
Repairs flagged
- Moderate kitchen cabinets — dated and worn
- Moderate bathroom fixtures — dated and worn
- Minor exterior paint — some discoloration
Value-add opportunities
- Both paint interior walls — enhances curb appeal and interior aesthetics
- Both replace kitchen cabinets — modernizes the space and increases functionality
- Both replace bathroom fixtures — modernizes the space and increases functionality
- Both landscaping — enhances curb appeal and adds value
Renovation cost estimate screening
| Repair item | Severity | Est. cost |
|---|---|---|
| kitchen cabinets · dated and worn | Moderate | $3,000–15,000 |
| bathroom fixtures · dated and worn | Moderate | $3,000–15,000 |
| exterior paint · some discoloration | Minor | $500–3,000 |
| Total estimated repair cost · 3 items | $6,500–33,000 |
Value-add ROI direction
- Both paint interior walls — enhances curb appeal and interior aesthetics ↑
- Both replace kitchen cabinets — modernizes the space and increases functionality ↑
- Both replace bathroom fixtures — modernizes the space and increases functionality ↑
- Both landscaping — enhances curb appeal and adds value ↑
ⓘ Cost ranges are severity-bucket heuristics (US national rule-of-thumb). Get contractor quotes + a written scope before underwriting a rehab budget.
Schools (NCES district)
- District
- Gadsden City
- NCES district ID
- 0101620
- Math proficiency
- 15% ▼ -27.00%
- Reading proficiency
- 39% ▼ -2.00%
- Median HH income
- $29,099
- Composite
- 21.62/100
- National rank
- #8292
- State rank
- #87 of 129 in AL
Livability — Gadsden
- Score
- 59/100
- State rank
- #335
- US rank
- #20131
Category grades
Schools grade is shown separately in the Schools card above.
Census & demographics
- Census place
- Gadsden, AL
- Population (ZIP)
- 13,571
Population outlook (Etowah County) Hauer SSP2
- Today (2025)
- 100,500 people
- By 2030
- 98,488 · -2.0%
- By 2040
- 93,731 · -6.7%
- By 2050
- 88,681 · -11.8%
- By 2075
- 76,746 · -23.6%
- By 2100
- 65,373 · -35.0%
Race, ethnicity, and origin ACS 2023
- Neighborhood character
- Predominantly White (77%)
- Race & ethnicity
- White 77% Black 13% Hispanic / Latino 8% Two or more races 2%
- Hispanic origin (detail)
- Mexican 5%
- Common ancestry
- Slovak 3% Serbian 1% Iranian 1%
- Foreign-born
- 3% · Canada
- Languages at home
- 93% English-only · Spanish 6%
Political lean MEDSL · Etowah
- 2024 margin
- Solid R (+55.7) · D 21.8% · R 77.5%
- 2008→2024 swing
- -17.5pp toward R · 2008: -38.2pp · 2024: -55.7pp
- All cycles
- 2024: R+55.7 2020: R+50.2 2016: R+50.1 2012: R+38.4 2008: R+38.2
Not yet ingested
- Civics
- —
Market trends
- HPI YoY
- ▼ -44.06%
- Current HPI
- 213.3981
- Rent YoY
- —
- Metro
- —
- State GDP YoY
- ▲ 2.94%
- F500 in state
- 4
Industry mix (Fortune 500 HQ in AL)
| Industry | F500 HQs | Revenue |
|---|---|---|
| Financial Services | 1 | $8B |
|
||
| Healthcare | 1 | $5B |
|
||
Price history
-4.6% since first listed2 events — show timeline
- 2026-04-08 Price Changed $84,900 VMLS
- 2026-02-13 Listed $89,000 VMLS
Cash-flow waterfall
monthlySold comps — $/sqft
last 12 mo · ≤1 miLoading sold comps…