 7-Plex
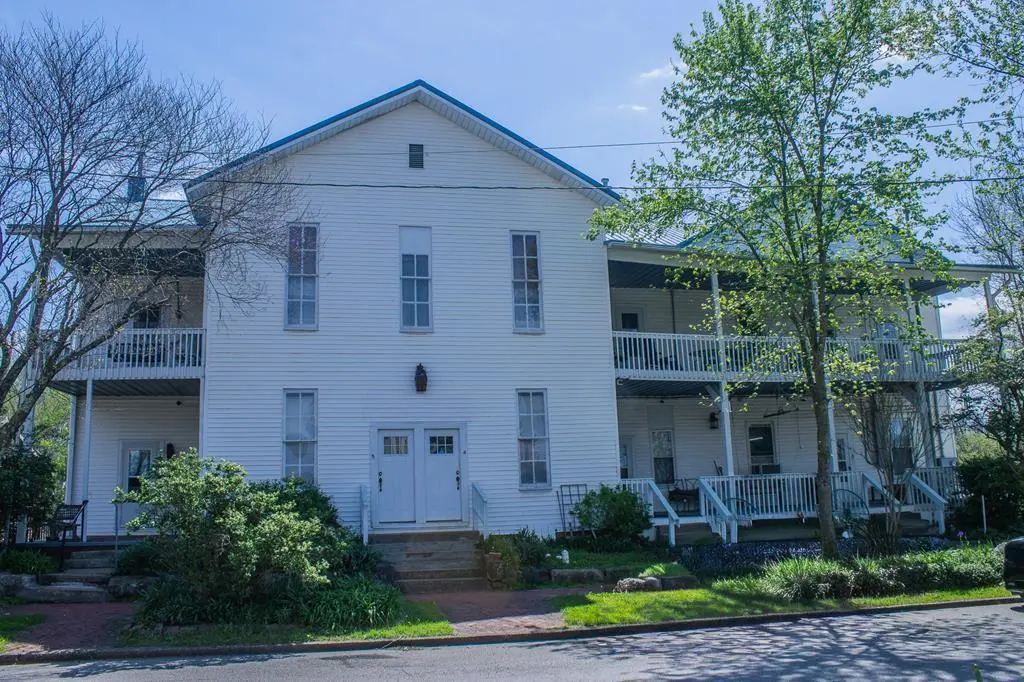
301 East St · Middlebourne, WV
Flood risk 1/10 · Minimal
- FEMA flood zone
- X (unshaded)
- Chance of flooding over 30 yrs
- 0.0%
- Est. flood insurance / yr
- $473 – $860
Fire risk 2/10 · Minimal
- Est. fire insurance / yr
- $787 – $1,461
Heat risk 4/10 · Minor
- Hot days now (above 98°F)
- 7 days/yr
- Hot days in 30 yrs
- 19 days/yr
Wind risk 1/10 · Minimal
- Chance of severe wind over 30 yrs
- 1.0%
Air-quality risk 1/10 · Minimal
- Unhealthy air days now
- 0 days/yr
- Unhealthy air days in 30 yrs
- 0 days/yr
Risk factors via First Street. Map © Google.
Why this score? — see what drove the B+ grade
The composite is a weighted blend of 9 inputs, each scored 0–100. Each bar is that input's sub-score; the figure is the points it added to the 100-point composite (weight × sub-score).
- Cash flow +30.0/30.0
- 1% rule +10.0/10.0
- DSCR +10.0/10.0
- ARV discount +7.5/15.0
- Appreciation +7.5/10.0
- Livability +3.2/5.0
- Schools +2.9/10.0
- Rent growth +2.5/5.0
- Condition / age +2.2/5.0
$225,000
🖨 Deal sheet (PDF) 📄 Offer letter ✓ Due diligence
Multi-family units
County records classify this as Multi-Family (5+ Unit). Listing-text estimate: 7 units. confirmed
5+ unit building — per-unit beds/baths from public records are typically unavailable; the breakdown below (if shown) is an estimate from the listing text.
Listing remarks
7-unit investment opportunity in Tyler County! The units come fully furnished! This multifamily property offers a strong income-producing setup with a unit mix of 4 two-bedroom units, 2 one-bedroom units, and 1 three-bedroom unit. Current rents provide immediate cash flow with additional upside potential through rent adjustments. Property is being sold as-is and is ideal for investors looking to expand or start their portfolio. Convenient location with steady rental demand. Don't miss this opportunity to own a 7-unit income property!
Key facts
- Fully furnished
- Steady rental demand
- 0.24 acre lot
Tags
Property features AI
Finance
- Other: Property listed as multi-unit residential income
- Financial info: Annual tax amount listed
Exterior
- Utilities: Public water; Public sewer
- Home design: Multi-family residential income property; Two-story building
- Construction: Vinyl siding
- Exterior features: Commercially zoned lot
Interior
- Flooring: Carpet
- Heating & cooling: Window Unit(s) cooling; Gas water heater
- Interior features: Gas water heater; Carpet flooring; Window air conditioning units
Neighborhood map
What this means for you Summary
Snapshot
- This is a 4×2bd/1ba + 2×1bd/1ba + 1×3bd/1ba units multifamily listed at $225k. Condition is rated fair.
Deal economics
- At list price, monthly cash flow is $3k ($40k/yr) — positive. Per door: $472/mo.
- The deal already cash-flows at list — no discount required.
- Meets the 1% rule at list price ($6k rent vs $225k).
- Recommended offer: $212k (6.0% below list) — sets the bar for market timing.
Location & tenants
- Location reads 64/100 on livability (#153 in WV) — a middle-class / working-renter tenant base. Strengths: cost of living A+, housing A+, crime B+; Watch: employment C-, health & safety C-, schools F.
- Tyler County Schools (rural): math 31% / reading 39% proficiency, ranked #18 of 55 in WV (top 33%) — families likely to look elsewhere, expect single-tenant / working-renter base with shorter leases.
- Market conditions: 6 active listings in the ZIP.
Forward outlook
- In year one you build about $13k of equity ($2k loan paydown + $11k appreciation (5.0% local appreciation)).
- Tyler County population projected at -23% by 2050 — secular population decline; favor cash flow + early exit over multi-decade hold.
- At projected returns (5.0% appreciation + 3.0% rent growth), your $63k cash investment doubles in ~2 years — after that, you're playing with house money.
- By year 3, paydown + projected appreciation supports a ~$32k cash-out refi (75% LTV) — recoverable capital for the next deal without selling this one.
Negotiation context
- It's been on market 61 days — a 6% lower offer ($212k) is reasonable based on typical stale-listing flexibility.
- 2 sale attempts with the ask held roughly flat each time — persistent listings suggest the price (not the market) is what's stuck; bring a comps-based counter.
Risks & watch-outs
- Watch-outs: built in 1895 — expect roof / HVAC / electrical / plumbing capex.
Questions for the listing agent
- It's been on market 61 days. Have you received any prior offers? Is the seller open to a 6% concession, seller financing, or rate buy-down credit?
- Can we see the unit-by-unit rent roll, current vacancy, and any below-market leases? What's the average tenancy length?
- What capital expenditures (roof, boiler, parking lot, exteriors) have been made in the last 5 years, and what's planned in the next 2?
- Have any recent inspections been done? Can we get a copy of the seller's disclosures and any deferred-maintenance estimates?
- Built in 1895 — when were the roof, HVAC, electrical panel, plumbing, and water heater last replaced?
- Why hasn't it sold? Are there any deal-killer items the seller is aware of (foundation, flood, title, zoning, code violations)?
- Is there a deadline driving the sale (1031 exchange, divorce, estate, relocation)? That informs how much negotiation room exists.
- Schools are F-rated, which usually means shorter tenancies and higher turnover. Who's the typical renter profile here, and what's been the actual vacancy rate?
- What's the average days-on-market for RENTAL listings here right now (not sales)? A rising rental-DOM trend means longer vacancies and softer asking-rent achievability than the comps imply.
- What's the recent tenant-quality profile in this submarket — average credit score on applications, eviction rate, late-payment / NSF rate, and stable-employment percentage? A property-management company in the area should have these aggregated.
- How much new apartment / multifamily construction is in the pipeline within 1–3 miles? Heavy new supply (>2% of stock underway) typically softens rents 12–24 months out; light construction supports rent growth.
Investment metrics
- 1% rule
- 2.73% ✓
- Cap rate
- 23.92%
- Cash-on-cash
- 62.97%
- DSCR
- 3.80
- GRM
- 3.0
CMA / ARV
No comps found within radius.
Projected returns pro-forma
4.99% appreciation · 3.0% rent growth · sell at horizon
- IRR
- 69.8%
- Equity multiple
- 5.17×
- Total profit
- $262,426
- Equity at exit
- $127,416
- IRR
- 67.6%
- Equity multiple
- 10.71×
- Total profit
- $611,538
- Equity at exit
- $219,829
Cash invested: $63,000 (down + closing). Projections, not guarantees.
Landlord ↔ Tenant lean methodology
- Overall (STATE)
- 83 Strongly Landlord-Friendly
- State West Virginia
- 83 Strongly Landlord-Friendly · R+22
- County
- — inherits STATE
- City
- — inherits STATE
ZIP-level market 26149
- Home prices YoY
- 3.2%
- Active inventory
- 6
- Price-to-rent
- 21.4×
Monthly cashflow live
- Estimated rent
- $6,153 medium interval (Pro) →
- Mortgage (P&I)
- −$1,180
- Tax est. 1.5%
- −$281 /mo · $3,375/yr
- Insurance
- −$94
- HOA
- −$0
- Vacancy / Maint / Mgmt
- −$1,292
- Net cashflow
- $3,306
Break-even live
Sensitivity live
| Price | -10% $3,461 | -5% $3,384 | +0% $3,306 | +5% $3,228 | +10% $3,150 |
|---|---|---|---|---|---|
| Rent | -10% $2,820 | -5% $3,063 | +0% $3,306 | +5% $3,549 | +10% $3,792 |
| Rate | -1.0pp $3,419 | -0.5pp $3,363 | base $3,306 | +0.5pp $3,248 | +1.0pp $3,188 |
7-unit breakdown (identical units grouped — click to expand)
| Units | Beds | Baths | Est. rent |
|---|---|---|---|
| 4× units | 2 | 1 | $3,512 |
| #1 | 2 | 1 | $878 |
| #2 | 2 | 1 | $878 |
| #3 | 2 | 1 | $878 |
| #4 | 2 | 1 | $878 |
| 2× units | 1 | 1 | $1,756 |
| #5 | 1 | 1 | $878 |
| #6 | 1 | 1 | $878 |
| 1× unit | 3 | 1 | $884 |
| Total (7 units) | $6,153 | ||
UW: 25.0% down · 7.5% · 30yr · 1.5% tax · 5.0% vac · 8.0% maint · 8.0% mgmt
Financing live
Cash to close
- Down payment
- $56,250
- Closing costs
- $6,750
- Reserves months
- —
- Total cash needed
- —
Loan-product check · same deal, 3 products live
Conventional
25% down · 7.5% · 30yr
- Down + closing
- —
- Monthly P&I
- —
- Monthly cashflow
- —
- DSCR
- —
- Eligible?
- —
Personal DTI + credit; lowest rate.
DSCR
20% down · 8.5% · 30yr
- Down + closing
- —
- Monthly P&I
- —
- Monthly cashflow
- —
- DSCR
- —
- Eligible?
- —
No personal income docs; deal must DSCR.
Hard money
10% down · 12.0% · 12mo
- Down + closing
- —
- Monthly P&I
- —
- Monthly cashflow
- —
- DSCR
- —
- Eligible?
- —
Short-term bridge; refi at stabilization.
Listing history 18 events
-
2026-06-18days on market $225,000 Active 61 DOM
-
2026-06-17days on market $225,000 Active 60 DOM
-
2026-06-16days on market $225,000 Active 59 DOM
-
2026-06-15days on market $225,000 Active 58 DOM
-
2026-06-15days on market $225,000 Active 57 DOM
-
2026-06-13days on market $225,000 Active 56 DOM
-
2026-06-12days on market $225,000 Active 55 DOM
-
2026-06-09days on market $225,000 Active 52 DOM
-
2026-06-08days on market $225,000 Active 51 DOM
-
2026-06-08days on market $225,000 Active 50 DOM
-
2026-06-07days on market $225,000 Active 49 DOM
-
2026-06-04days on market $225,000 Active 47 DOM
-
2026-06-03days on market $225,000 Active 46 DOM
-
2026-06-02days on market $225,000 Active 45 DOM
-
2026-06-01days on market $225,000 Active 44 DOM
-
2026-05-31days on market $225,000 Active 43 DOM
-
2026-04-14$225,000 Active
-
2026-04-14$225,000 Active
ⓘ Source: listings_history table (triggers on properties + properties_extension) + one-shot
backfill from property_details.listing_events for pre-trigger history.
Climate risk First Street
- Flood 1/10 Low FEMA zone X (unshaded) · 0% chance over 30 yrs
- Wildfire 2/10 Low
- Heat 4/10 Moderate 7 d/yr ≥98°F today · 19 d/yr by 30 yrs out
- Wind 1/10 Low 100% chance of damaging wind over 30 yrs
- Air quality 1/10 Low 0 unhealthy d/yr today · 0 by 30 yrs out
Nearby sold comps map
Loading sold comps map…
Walkable amenities ~0.75 mi
Loading nearby amenities…
Taxation est. · year 1
- Rental income
- $73,836
- − Mortgage interest
- −$12,603
- − Property taxes
- −$3,375
- − Insurance
- −$1,125
- − Repairs & maintenance
- −$5,907
- − Management
- −$5,907
- − Depreciation
- −$6,545
- Taxable income
- $38,373
- Est. tax owed @ 24.0%
- −$9,210
- After-tax cash flow
- $30,462/yr
For passive investors: Depreciation is non-cash, so a rental often shows a tax loss while cash-flowing — sheltering income. Rental losses are passive: they offset passive income freely, and up to $25,000/yr can offset ordinary (W-2) income if you actively participate and your MAGI is under $100k (phasing out to $0 by $150k); unused losses carry forward. On sale, claimed depreciation is recaptured at up to 25%, and gains may owe capital-gains tax (a 1031 exchange can defer both). Figures are a year-1 estimate at your 24.0% rate — not tax advice; consult a CPA.
Condition & rehab AI · 13 photos
This 7-unit multifamily property requires moderate renovations to its kitchens and bathrooms, as well as a paint refresh. The property is currently in fair condition and has a good roof and exterior. With updates, it has the potential to significantly increase its value.
Repairs flagged
- Major kitchen cabinets — dated and in need of replacement
- Major bathroom fixtures — outdated and in need of replacement
- Major kitchen countertops — dated and in need of replacement
- Major kitchen appliances — outdated and in need of replacement
- Minor paint — faded and could be refreshed
Value-add opportunities
- Both kitchen renovation — modernizing the kitchen would increase both resale and rental value
- Both bathroom renovation — modernizing the bathrooms would increase both resale and rental value
- Both paint refresh — refreshing the paint would improve the home's curb appeal and interior aesthetics
Renovation cost estimate screening
| Repair item | Severity | Est. cost |
|---|---|---|
| kitchen cabinets · dated and in need of replacement | Major | $15,000–50,000 |
| bathroom fixtures · outdated and in need of replacement | Major | $15,000–50,000 |
| kitchen countertops · dated and in need of replacement | Major | $15,000–50,000 |
| kitchen appliances · outdated and in need of replacement | Major | $15,000–50,000 |
| paint · faded and could be refreshed | Minor | $500–3,000 |
| Total estimated repair cost · 5 items | $60,500–203,000 |
Value-add ROI direction
- Both kitchen renovation — modernizing the kitchen would increase both resale and rental value ↑
- Both bathroom renovation — modernizing the bathrooms would increase both resale and rental value ↑
- Both paint refresh — refreshing the paint would improve the home's curb appeal and interior aesthetics ↑
ⓘ Cost ranges are severity-bucket heuristics (US national rule-of-thumb). Get contractor quotes + a written scope before underwriting a rehab budget.
Schools (NCES district)
- District
- Tyler County Schools
- NCES district ID
- 5401440
- Math proficiency
- 31% ▼ -11.00%
- Reading proficiency
- 39% ▼ -8.00%
- Median HH income
- $37,906
- Composite
- 29.17/100
- National rank
- #6576
- State rank
- #18 of 55 in WV
Livability — Middlebourne
- Score
- 64/100
- State rank
- #153
- US rank
- #14794
Category grades
Schools grade is shown separately in the Schools card above.
Census & demographics
- Census place
- Middlebourne, WV
- Population (ZIP)
- 2,330
Population outlook (Tyler County) Hauer SSP2
- Today (2025)
- 8,409 people
- By 2030
- 8,035 · -4.4%
- By 2040
- 7,233 · -14.0%
- By 2050
- 6,460 · -23.2%
- By 2075
- 4,823 · -42.6%
- By 2100
- 3,342 · -60.3%
Race, ethnicity, and origin ACS 2023
- Neighborhood character
- Predominantly White (97%)
- Race & ethnicity
- White 97% Two or more races 3%
- Common ancestry
- Italian 2% Slovak 2% Serbian 1%
- Foreign-born
- 0%
- Languages at home
- 99% English-only · Spanish 1%
Political lean MEDSL · Tyler
- 2024 margin
- Solid R (+67.4) · D 15.3% · R 82.7% · Other 2.0%
- 2008→2024 swing
- -36.0pp toward R · 2008: -31.4pp · 2024: -67.4pp
- All cycles
- 2024: R+67.4 2020: R+66.2 2016: R+68.0 2012: R+43.5 2008: R+31.4
Not yet ingested
- Civics
- —
Market trends
- HPI YoY
- ▲ 4.99%
- Current HPI
- 160.8357
- Rent YoY
- —
- Metro
- —
- State GDP YoY
- —
- F500 in state
- 0
Price history
+0.0% since first listed2 events — show timeline
- 2026-04-14 Listed $225,000 WBOR
- 2026-04-14 Listed $225,000 WBOR
Cash-flow waterfall
monthlySold comps — $/sqft
last 12 mo · ≤1 miLoading sold comps…