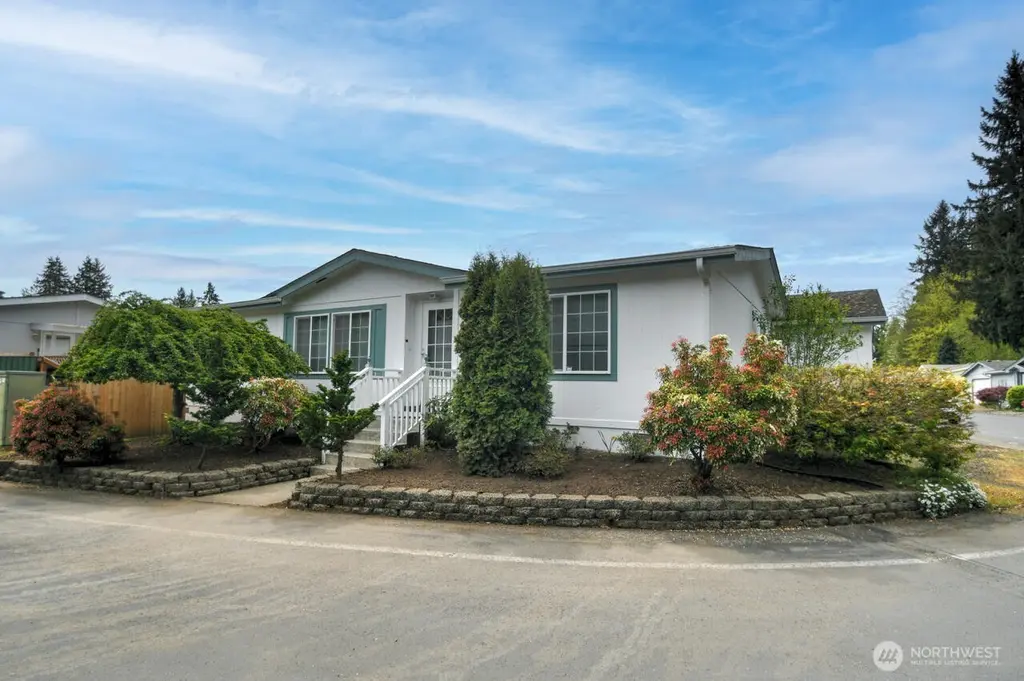
5088 W Gray Sea Eagle Ln SW · Tumwater, WA
Flood risk 1/10 · Minimal
- FEMA flood zone
- X (unshaded)
- Chance of flooding over 30 yrs
- 0.0%
- Est. flood insurance / yr
- $507 – $1,088
Fire risk 1/10 · Minimal
- Est. fire insurance / yr
- $604 – $1,122
Heat risk 3/10 · Minor
- Hot days now (above 88°F)
- 7 days/yr
- Hot days in 30 yrs
- 15 days/yr
Wind risk 1/10 · Minimal
- Chance of severe wind over 30 yrs
- —
Air-quality risk 6/10 · Moderate
- Unhealthy air days now
- 7 days/yr
- Unhealthy air days in 30 yrs
- 8 days/yr
Risk factors via First Street. Map © Google.
Why this score? — see what drove the B grade
The composite is a weighted blend of 9 inputs, each scored 0–100. Each bar is that input's sub-score; the figure is the points it added to the 100-point composite (weight × sub-score).
- Cash flow +25.8/30.0
- ARV discount +14.6/15.0
- DSCR +8.7/10.0
- 1% rule +6.3/10.0
- Schools +5.6/10.0
- Livability +4.2/5.0
- Rent growth +3.1/5.0
- Condition / age +2.5/5.0
- Appreciation +0.0/10.0
$186,000
🖨 Deal sheet (PDF) 📄 Offer letter ✓ Due diligence
Listing remarks
Beautifully updated 2 bed, 2 full bath manufactured home in a desirable 55+ community! This 1,173 sq ft home features all new interior paint, brand new flooring throughout (LVP and carpet), updated kitchen lighting, and new outlet/switch cover plates throughout. Major system updates include a newer roof (2011/2012), HVAC (2017), water heater (2023/2024), and fresh exterior paint (September 2024). Enjoy outdoor living with a fully fenced backyard (updated fencing) and a private patio—perfect for relaxing or entertaining. The oversized two-car garage offers excellent storage and flexibility. Seller offering a $6,000 credit at closing with acceptable offer—an ideal opportunity to p
Key facts
- Hvac
- Newer roof
- Water heater
Tags
Neighborhood map
What this means for you Summary
Snapshot
- This is a 2-bed/2.0-bath manufactured listed at $186k.
Deal economics
- At list price, monthly cash flow is $454 ($5k/yr) — positive.
- The deal already cash-flows at list — no discount required.
- Meets the 1% rule at list price ($2k rent vs $186k).
- Recommended offer: $180k (3.0% below list) — sets the bar for market timing.
- Cap rate 9.2% vs local median 2.7% in Tumwater — top-decile yield for the area; either an underpriced asset or a hidden risk that comps aren't pricing in. Stress-test before assuming the spread holds.
Location & tenants
- Location reads 84/100 on livability (#39 in WA, #700 nationally) — a professional / high-income tenant draw. Strengths: commute A+, housing A+, health & safety A+; Watch: amenities D, cost of living D-.
- Tumwater School District (urban): math 57% / reading 69% proficiency, ranked #37 of 291 in WA (top 13%) — acceptable for families but not a draw, mixed tenant base, ~2y average lease.
- Market conditions: Rents rising (+2.3%/yr); 233 active listings in the ZIP; 21 comparable units currently listed for rent nearby; rentals at typical pace (median 22d on market — plan ~3-4 weeks tenant-placement turnaround); solid renter incomes; 1,222 units permitted in Thurston County in 2024 (508 in 5+ unit buildings).
Forward outlook
- Local home prices are declining (-3.0%/yr); year-one equity from $1k of loan paydown is wiped out by about $6k of value loss. Plan a longer hold.
- Thurston County population projected at +27% by 2050 — long-run rental-demand tailwind backs the buy-and-hold thesis.
Negotiation context
- It's been on market 57 days — a 3% lower offer ($180k) is reasonable based on typical stale-listing flexibility.
Questions for the listing agent
- It's been on market 57 days. Have you received any prior offers? Is the seller open to a 3% concession, seller financing, or rate buy-down credit?
- Is there a deadline driving the sale (1031 exchange, divorce, estate, relocation)? That informs how much negotiation room exists.
- Schools are A-rated — typically a magnet for longer-tenancy family renters. What's the average tenant stay here, and is there a school-zone premium baked into asking?
- What's the average days-on-market for RENTAL listings here right now (not sales)? A rising rental-DOM trend means longer vacancies and softer asking-rent achievability than the comps imply.
- What's the recent tenant-quality profile in this submarket — average credit score on applications, eviction rate, late-payment / NSF rate, and stable-employment percentage? A property-management company in the area should have these aggregated.
- How much new for-sale + rental construction is in the pipeline within 1–3 miles? Heavy new supply typically softens prices + rents 12–24 months out; constrained supply supports both.
Investment metrics
- 1% rule
- 1.13% ✓
- Cap rate
- 9.22%
- Cash-on-cash
- 10.46%
- DSCR
- 1.47
- GRM
- 7.4
CMA / ARV
- ARV (median comp)
- $220,796
- List price
- $186,000
- Delta
- -15.76%
- Verdict
- UNDERPRICED
- Comps
- 20 within 1.0 mi
Show comp detail 12 sales within ~0.75 mi
| Address | Dist | Beds/Ba | Sqft | Sold | Price | $/sf | Match |
|---|---|---|---|---|---|---|---|
| 5354 Golden Eagle Ln SW | 0.16mi | 2/2.0 | 1,344 (0%) | 9mo | $220,000 | $164 | 84 |
| 5301 E Eagle Ln SW | 0.16mi | 2/2.0 | 1,404 (+4%) | 4mo | $225,000 | $160 | 81 |
| 5119 Golden Eagle Ln SW | 0.02mi | 3/2.0 (+1) | 1,232 (-8%) | 5mo | $196,000 | $159 | 76 |
| 5279 Bald Eagle Ln SW | 0.12mi | 3/2.0 (+1) | 1,377 (+2%) | 12mo | $225,000 | $163 | 75 |
| 5302 E Eagle Ln SW | 0.17mi | 3/2.0 (+1) | 1,440 (+7%) | 3mo | $215,000 | $149 | 73 |
| 930 Trosper Rd SW #70 | 0.44mi | 2/2.0 | 1,358 (+1%) | 8mo | $109,900 | $81 | 71 |
| 5081 E Gray Sea Eagle Ln SW | 0.08mi | 2/2.0 | 1,176 (-12%) | 13mo | $100,000 | $85 | 64 |
| 930 Trosper Rd SW #64 | 0.40mi | 3/2.0 (+1) | 1,248 (-7%) | 2mo | $61,000 | $49 | 63 |
| 930 Trosper Rd SW #71 | 0.42mi | 2/2.0 | 1,458 (+8%) | 5mo | $230,000 | $158 | 62 |
| 930 Trosper Rd #135 | 0.49mi | 2/2.0 | 1,188 (-12%) | 12mo | $132,000 | $111 | 48 |
| 930 Trosper Rd SW #130 | 0.46mi | 3/2.0 (+1) | 1,544 (+15%) | 2mo | $167,500 | $108 | 47 |
| 1841 Trosper Rd SW #38 | 0.45mi | 2/2.0 | 1,152 (-14%) | 13mo | $37,000 | $32 | 44 |
Match score weights: distance 35% · size 25% · config 20% · recency 20%. Top-matched comps best support the ARV.
Projected returns pro-forma
-3.0% appreciation · 2.26% rent growth · sell at horizon
- IRR
- -1.4%
- Equity multiple
- 0.95×
- Total profit
- $-2,792
- Equity at exit
- $27,733
- IRR
- 7.5%
- Equity multiple
- 1.55×
- Total profit
- $28,460
- Equity at exit
- $16,082
Cash invested: $52,080 (down + closing). Projections, not guarantees.
Landlord ↔ Tenant lean methodology
- Overall (STATE)
- 28 Tenant-Leaning
- State Washington
- 28 Tenant-Leaning · D+8
- County
- — inherits STATE
- City
- — inherits STATE
ZIP-level market 98512
- Rents YoY
- 2.3%
- Active inventory
- 233
- Price-to-rent
- 7.4×
Monthly cashflow live
- Estimated rent
- $2,098 high interval (Pro) →
- Mortgage (P&I)
- −$975
- Tax from tax record
- −$150 /mo · $1,806/yr
- Insurance
- −$78
- HOA
- −$0
- Vacancy / Maint / Mgmt
- −$441
- Net cashflow
- $454
Break-even live
Sensitivity live
| Price | -10% $559 | -5% $507 | +0% $454 | +5% $401 | +10% $349 |
|---|---|---|---|---|---|
| Rent | -10% $288 | -5% $371 | +0% $454 | +5% $537 | +10% $620 |
| Rate | -1.0pp $548 | -0.5pp $501 | base $454 | +0.5pp $406 | +1.0pp $357 |
UW: 25.0% down · 7.5% · 30yr · 1.5% tax · 5.0% vac · 8.0% maint · 8.0% mgmt
Financing live
Cash to close
- Down payment
- $46,500
- Closing costs
- $5,580
- Reserves months
- —
- Total cash needed
- —
Loan-product check · same deal, 3 products live
Conventional
25% down · 7.5% · 30yr
- Down + closing
- —
- Monthly P&I
- —
- Monthly cashflow
- —
- DSCR
- —
- Eligible?
- —
Personal DTI + credit; lowest rate.
DSCR
20% down · 8.5% · 30yr
- Down + closing
- —
- Monthly P&I
- —
- Monthly cashflow
- —
- DSCR
- —
- Eligible?
- —
No personal income docs; deal must DSCR.
Hard money
10% down · 12.0% · 12mo
- Down + closing
- —
- Monthly P&I
- —
- Monthly cashflow
- —
- DSCR
- —
- Eligible?
- —
Short-term bridge; refi at stabilization.
Rent comps 21 comps
| Address | Beds | Baths | Sqft | Rent | $/sqft | DOM | Units | Dist |
|---|---|---|---|---|---|---|---|---|
| 4822 Rural Rd SW Tumwater, WA | 2.0 | 2.0 | 1025 | $1,995 | $1.95 | 21d | 1 | 0.25mi |
| 1978 Trosper Rd SW Tumwater, WA | 1.0–3.0 | 1.0–2.0 | 1050 | $2,428 | $2.31 | 44d | 3 | 0.30mi |
| 1978 Trosper Rd SW Tumwater, WA | 1.0–3.0 | 1.0–2.0 | 1106 | $2,246 | $2.03 | 14d | 4 | 0.30mi |
| 1619 Trosper Rd SW Tumwater, WA | 3.0 | 2.5 | 1295 | $2,495 | $1.93 | 21d | 1 | 0.47mi |
| 1500 Lake Park Dr SW #29 Tumwater, WA | 2.0 | 1.5 | 1428 | $1,850 | $1.30 | 21d | 1 | 0.70mi |
| 1653 Starlight Ln SW Olympia, WA | 3.0 | 2.5 | 1559 | $2,800 | $1.80 | 14d | 2 | 1.09mi |
| 6805 Littlerock Rd SW Tumwater, WA | 2.0 | 1.0 | 1000 | $1,495 | $1.50 | 44d | 1 | 1.10mi |
| 1704 Barnes Blvd SW Tumwater, WA | 1.0–3.0 | 1.0–2.5 | 920 | $2,004 | $2.18 | 14d | 35 | 1.12mi |
| 215 Pinehurst Dr SW Tumwater, WA | 2.0 | 1.0–2.5 | 759 | $1,950 | $2.57 | 14d | 4 | 1.14mi |
| 811 S 3rd Ave SW Unit B Tumwater, WA | 3.0 | 2.0 | 1336 | $2,300 | $1.72 | 44d | 1 | 1.14mi |
| 6705 Linderson Way SW Tumwater, WA | 1.0–3.0 | 1.0–2.0 | 900 | $2,038 | $2.26 | 14d | 6 | 1.16mi |
| 2820 Tuscany Ln SW Unit 714 Tumwater, WA | 2.0 | 2.0 | 1030 | $1,725 | $1.67 | 21d | 1 | 1.26mi |
| 2820 Tuscany Ln SW Unit 411 Tumwater, WA | 2.0 | 1.0 | 915 | $1,635 | $1.79 | 44d | 1 | 1.26mi |
| 2820 Tuscany Ln SW Tumwater, WA | 1.0–2.0 | 1.0–2.0 | 915 | $1,775 | $1.94 | 14d | 8 | 1.26mi |
| 1255 Bay Loop SW Tumwater, WA | 2.0 | 1.0 | 975 | $2,400 | $2.46 | 44d | 1 | 1.27mi |
| 214 65th Way SW Tumwater, WA | 2.0 | 1.0 | 1000 | $1,850 | $1.85 | 21d | 1 | 1.32mi |
| 6504 Capitol Blvd SE Tumwater, WA | 1.0 | 1.0 | 974 | $2,125 | $2.18 | 14d | 1 | 1.42mi |
| 407 N 5th Ave SW Tumwater, WA | 3.0 | 1.5 | 1650 | $2,250 | $1.36 | 44d | 1 | 1.43mi |
| 407 N 5th Ave SW Unit A Tumwater, WA | 3.0 | 1.5 | 1650 | $2,250 | $1.36 | 44d | 1 | 1.43mi |
| 801 Israel Rd SW Tumwater, WA | 2.0 | 1.5 | 965 | $1,860 | $1.93 | 14d | 2 | 1.45mi |
| 220 Israel Rd SW Unit G8 Tumwater, WA | 2.0 | 1.5 | 968 | $1,975 | $2.04 | 44d | 1 | 1.47mi |
Listing history 16 events
-
2026-06-18days on market $186,000 Active 57 DOM
-
2026-06-17days on market $186,000 Active 56 DOM
-
2026-06-16days on market $186,000 Active 55 DOM
-
2026-06-15days on market $186,000 Active 54 DOM
-
2026-06-14days on market $186,000 Active 52 DOM
-
2026-06-13pricedays on market $186,000 Active 51 DOM
-
2026-06-10days on market $195,000 Active 49 DOM
-
2026-06-09days on market $195,000 Active 48 DOM
-
2026-06-08days on market $195,000 Active 47 DOM
-
2026-06-07days on market $195,000 Active 46 DOM
-
2026-06-05days on market $195,000 Active 43 DOM
-
2026-06-02days on market $195,000 Active 41 DOM
-
2026-06-01days on market $195,000 Active 40 DOM
-
2026-05-31days on market $195,000 Active 39 DOM
-
2026-05-30days on market $195,000 Active 38 DOM
-
2026-04-22$195,000 Active
ⓘ Source: listings_history table (triggers on properties + properties_extension) + one-shot
backfill from property_details.listing_events for pre-trigger history.
Tax reassessment forecast WA · Resets to sale price
- Current annual tax
- $1,806 · $150/mo
- Projected year-2 tax
- $1,823 · $152/mo
- Expected delta
- +$17/yr (+$1/mo · 1.0%)
ⓘ Screening estimate from a state-policy table — verify with the county assessor before closing.
Climate risk First Street
- Flood 1/10 Low FEMA zone X (unshaded) · 0% chance over 30 yrs
- Wildfire 1/10 Low
- Heat 3/10 Moderate 7 d/yr ≥88°F today · 15 d/yr by 30 yrs out
- Wind 1/10 Low
- Air quality 6/10 Major 7 unhealthy d/yr today · 8 by 30 yrs out
Nearby sold comps map
Loading sold comps map…
Walkable amenities ~0.75 mi
Loading nearby amenities…
Taxation est. · year 1
- Rental income
- $25,176
- − Mortgage interest
- −$10,419
- − Property taxes
- −$1,806
- − Insurance
- −$930
- − Repairs & maintenance
- −$2,014
- − Management
- −$2,014
- − Depreciation
- −$5,411
- Taxable income
- $2,582
- Est. tax owed @ 24.0%
- −$620
- After-tax cash flow
- $4,829/yr
For passive investors: Depreciation is non-cash, so a rental often shows a tax loss while cash-flowing — sheltering income. Rental losses are passive: they offset passive income freely, and up to $25,000/yr can offset ordinary (W-2) income if you actively participate and your MAGI is under $100k (phasing out to $0 by $150k); unused losses carry forward. On sale, claimed depreciation is recaptured at up to 25%, and gains may owe capital-gains tax (a 1031 exchange can defer both). Figures are a year-1 estimate at your 24.0% rate — not tax advice; consult a CPA.
Schools (NCES district)
- District
- Tumwater School District
- NCES district ID
- 5309100
- Math proficiency
- 57% ▬ 0.00%
- Reading proficiency
- 69% ▼ -1.00%
- Median HH income
- $64,209
- Composite
- 56.38/100
- National rank
- #2477
- State rank
- #37 of 291 in WA
Livability — Tumwater
- Score
- 84/100
- State rank
- #39
- US rank
- #700
Category grades
Schools grade is shown separately in the Schools card above.
Census & demographics
- Census place
- Tumwater, WA
- County
- Thurston County · 269,345 people
- City population
- 46,937
- Metro
- Olympia-Lacey-Tumwater, WA
- Population (ZIP)
- 31,864
- Household income
- $101,530
- Rent vs Own
- Severe rent burden
- 784.0
Population outlook (Thurston County) Hauer SSP2
- Today (2025)
- 308,239 people
- By 2030
- 326,483 · +5.9%
- By 2040
- 359,890 · +16.8%
- By 2050
- 391,800 · +27.1%
- By 2075
- 468,024 · +51.8%
- By 2100
- 519,890 · +68.7%
Race, ethnicity, and origin ACS 2023
- Neighborhood character
- Predominantly White (72%)
- Race & ethnicity
- White 72% Two or more races 13% Hispanic / Latino 9% Asian 4% Black 3% Native American 1%
- Hispanic origin (detail)
- Mexican 5%
- Common ancestry
- Portuguese 4% Italian 4% Slovak 4%
- Foreign-born
- 6% · Canada, Vietnam, China
- Languages at home
- 92% English-only · Spanish 3% Vietnamese 1% German/W. Germanic 1%
Political lean MEDSL · Thurston
- 2024 margin
- Strong D (+20.4) · D 58.5% · R 38.1% · Other 3.5%
- 2008→2024 swing
- -1.3pp toward R · 2008: 21.7pp · 2024: 20.4pp
- All cycles
- 2024: D+20.4 2020: D+18.6 2016: D+15.4 2012: D+19.0 2008: D+21.7
Not yet ingested
- Civics
- —
Market trends
- HPI YoY
- ▼ -348.18%
- Current HPI
- 347.121
- Rent YoY
- ▲ 2.26%
- Metro
- Olympia-Lacey-Tumwater, WA
- State GDP YoY
- ▲ 4.65%
- F500 in state
- 22
Industry mix (Fortune 500 HQ in WA)
| Industry | F500 HQs | Revenue |
|---|---|---|
| Retail | 2 | $269B |
|
||
| Technology / Retail | 1 | $638B |
|
||
| Technology | 1 | $245B |
|
||
| Telecommunications | 1 | $38B |
|
||
| Food / Beverage | 1 | $36B |
|
||
| Automotive / Trucks | 1 | $34B |
|
||
Price history
1 event — show timeline
- 2026-04-22 Listed $195,000 NWMLS as Distributed by MLS Grid
Property tax history
+4.5%/yrLatest (2026): $1,806 · +5.1% YoY. Source: county tax records.
Cash-flow waterfall
monthlySold comps — $/sqft
last 12 mo · ≤1 miLoading sold comps…