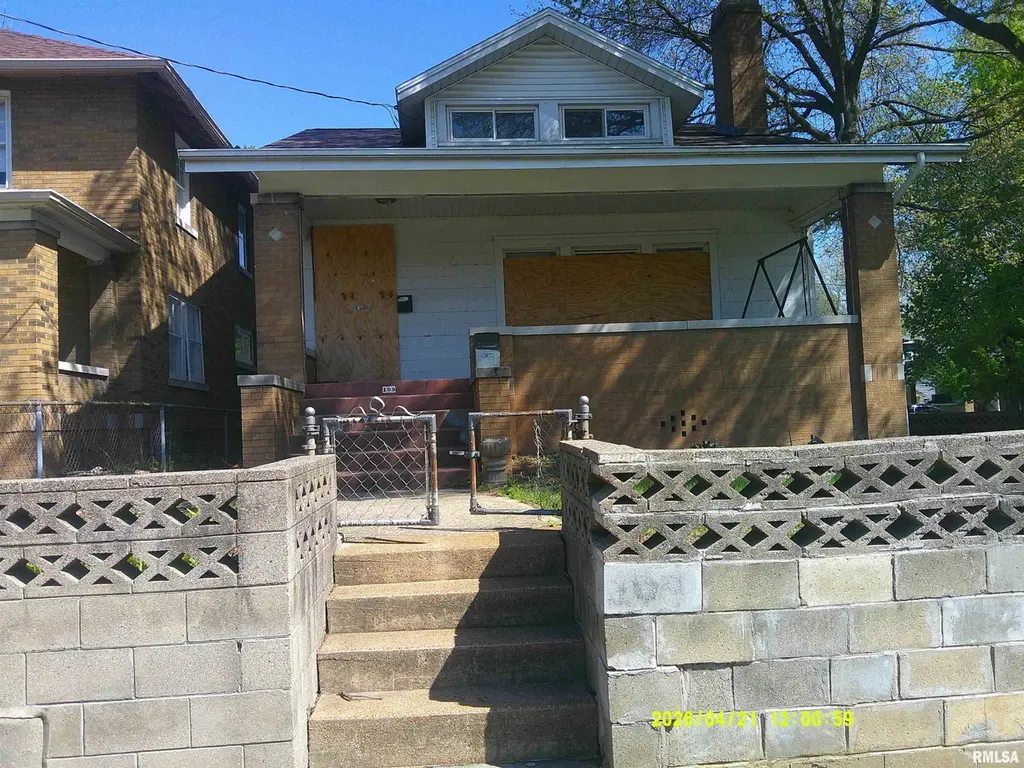
109 E Gift Ave · Peoria, IL
Flood risk 1/10 · Minimal
- FEMA flood zone
- X
- Chance of flooding over 30 yrs
- 0.0%
- Est. flood insurance / yr
- $473 – $860
Fire risk 1/10 · Minimal
- Est. fire insurance / yr
- $804 – $1,492
Heat risk 3/10 · Minor
- Hot days now (above 105°F)
- 7 days/yr
- Hot days in 30 yrs
- 18 days/yr
Wind risk 2/10 · Minimal
- Chance of severe wind over 30 yrs
- 1.0%
Air-quality risk 3/10 · Minor
- Unhealthy air days now
- 1 days/yr
- Unhealthy air days in 30 yrs
- 3 days/yr
Risk factors via First Street. Map © Google.
Why this score? — see what drove the B- grade
The composite is a weighted blend of 9 inputs, each scored 0–100. Each bar is that input's sub-score; the figure is the points it added to the 100-point composite (weight × sub-score).
- Cash flow +30.0/30.0
- 1% rule +10.0/10.0
- DSCR +10.0/10.0
- ARV discount +7.5/15.0
- Livability +3.7/5.0
- Rent growth +3.4/5.0
- Condition / age +2.5/5.0
- Schools +1.1/10.0
- Appreciation +0.0/10.0
$39,900
🖨 Deal sheet 📄 Offer letter ✓ Due diligence
Listing remarks MLS
Come take a look at this 3 unit duplex, situated on a corner lot and centrally located in Peoria! This duplex offers a lower level unit that is a 1 bed, 1 bath, renting for $550, historically. Upper unit is a 1bed, 1 bath and rents historically for $600. The main floor unit is a 2 bed, 1 bath and rents for $800 w/ garage access. Garden level unit and upper level unit are vacant. UPDATES: Roof in 2009 - Tear Off, windows, water heater and some siding in 2007, vanities, carpet and many additional updates. Come take a look today!
Key facts
- Corner lot
- Detached garage
- 4,356 sq ft lot
Tags
Property features AI
Finance
- Financial info: Two-unit investment property
Exterior
- Parking: Detached parking (1 total space)
- Utilities: Public water; Public sewer
- Home design: Residential income property; Multi-family zoning; Built in 1925; Other structure type
- Construction: Shingle roof; Not new construction
- Exterior features: Corner lot; Lot dimensions approximately 40 x 110
Interior
- Bedrooms: Two 2-bedroom units
- Bathrooms: Each unit has one full bathroom
- Heating & cooling: No central heating listed
- Interior features: Partially finished basement
Neighborhood map
What this means for you Summary
Snapshot
- This is a 4-bed/3.0-bath single-family listed at $40k.
Deal economics
- At list price, monthly cash flow is $601 ($7k/yr) — positive.
- The deal already cash-flows at list — no discount required.
- Meets the 1% rule at list price ($1k rent vs $40k).
- Recommended offer: $39k (3.0% below list) — sets the bar for market timing.
- Cap rate 24.4% vs local median 5.6% in Peoria — top-decile yield for the area; either an underpriced asset or a hidden risk that comps aren't pricing in. Stress-test before assuming the spread holds.
Location & tenants
- Location reads 73/100 on livability (#270 in IL) — a middle-class / working-renter tenant base. Strengths: commute A+, cost of living A+, housing A+; Watch: employment D+, crime F.
- Peoria SD 150 (urban): math 11% / reading 14% proficiency, ranked #554 of 620 in IL (top 89%) — low school quality limits family demand, transient renter base, plan for 1-2y turnover; 70% free/reduced lunch — lower-income household profile, screen leases tightly.
- Zoned schools: Peoria High School (math 4% / reading 7%, grade F, #609 of 693 statewide, top 88%, 1,447 students, 0% FRL) — zoned schools average 0% FRL vs 70% district-wide (70 pts lower); this property's tenant base skews higher-income than the district average.
- Market conditions: Rents rising (+3.5%/yr); 104 active listings in the ZIP; 7 comparable units currently listed for rent nearby; rentals at typical pace (median 21d on market — plan ~3-4 weeks tenant-placement turnaround); lower-income renter base — watch delinquency; 73 units permitted in Peoria County in 2024 (0 in 5+ unit buildings).
- This rent runs 35% of the median local income ($42k/yr) — at the standard rent-burdened threshold; future hikes will face affordability resistance.
Forward outlook
- Local home prices are declining (-3.0%/yr); year-one equity from $276 of loan paydown is wiped out by about $1k of value loss. Plan a longer hold.
- Peoria County population projected at -11% by 2050 — secular population decline; favor cash flow + early exit over multi-decade hold.
- At projected returns (-3.0% appreciation + 3.5% rent growth), your $11k cash investment doubles in ~2 years — after that, you're playing with house money.
Negotiation context
- It's been on market 38 days — a 3% lower offer ($39k) is reasonable based on typical stale-listing flexibility.
- 2 sale attempts since 5y ago with the ask held roughly flat each time — persistent listings suggest the price (not the market) is what's stuck; bring a comps-based counter.
Risks & watch-outs
- Watch-outs: property tax is 4.4% of price; built in 1925 — expect roof / HVAC / electrical / plumbing capex.
Questions for the listing agent
- It's been on market 38 days. Have you received any prior offers? Is the seller open to a 3% concession, seller financing, or rate buy-down credit?
- Built in 1925 — when were the roof, HVAC, electrical panel, plumbing, and water heater last replaced?
- Property tax is high relative to price — has the assessment been appealed recently, and will the sale trigger a re-assessment?
- Is there a deadline driving the sale (1031 exchange, divorce, estate, relocation)? That informs how much negotiation room exists.
- Schools are F-rated, which usually means shorter tenancies and higher turnover. Who's the typical renter profile here, and what's been the actual vacancy rate?
- Crime grade is F in this area — have there been break-ins, vandalism, or insurance claims at this property in the last 3 years? What carrier currently insures it and at what premium?
- What's the average days-on-market for RENTAL listings here right now (not sales)? A rising rental-DOM trend means longer vacancies and softer asking-rent achievability than the comps imply.
- What's the recent tenant-quality profile in this submarket — average credit score on applications, eviction rate, late-payment / NSF rate, and stable-employment percentage? A property-management company in the area should have these aggregated.
- How much new for-sale + rental construction is in the pipeline within 1–3 miles? Heavy new supply typically softens prices + rents 12–24 months out; constrained supply supports both.
Investment metrics
- 1% rule
- 3.08% ✓
- Cap rate
- 24.38%
- Cash-on-cash
- 64.60%
- DSCR
- 3.87
- GRM
- 2.7
CMA / ARV
- ARV (median comp)
- $79,878
- List price
- $39,900
- Delta
- -50.05%
- Verdict
- UNDERPRICED
- Comps
- 16 within 1.0 mi
Show comp detail 12 sales within ~0.75 mi
| Address | Dist | Beds/Ba | Sqft | Sold | Price | $/sf | Match |
|---|---|---|---|---|---|---|---|
| 135 W Hanssler Pl | 0.14mi | 3/2.5 (-1) | 1,812 (+4%) | 3mo | $165,000 | $91 | 78 |
| 400 E Virginia Ave | 0.17mi | 4/1.0 | 1,676 (-4%) | 3mo | $117,500 | $70 | 75 |
| 118 E Archer Ave | 0.25mi | 5/2.0 (+1) | 1,828 (+5%) | 1mo | $73,000 | $40 | 71 |
| 301 E Thrush Ave | 0.36mi | 3/1.5 (-1) | 1,716 (-2%) | 2mo | $102,000 | $59 | 67 |
| 904 E Seneca Pl | 0.55mi | 3/1.5 (-1) | 1,765 (+1%) | 2mo | $107,000 | $61 | 60 |
| 812 E Seneca Pl | 0.52mi | 3/3.0 (-1) | 1,640 (-6%) | 3mo | $161,500 | $98 | 58 |
| 220 E Frye St | 0.52mi | 3/2.0 (-1) | 1,842 (+5%) | 3mo | $56,500 | $31 | 55 |
| 610 W Hudson St | 0.67mi | 3/2.0 (-1) | 1,636 (-6%) | 0mo | $145,500 | $89 | 49 |
| 603 W Hudson St | 0.67mi | 3/2.0 (-1) | 1,641 (-6%) | 3mo | $175,000 | $107 | 47 |
| 3502 N Peoria Ave | 0.68mi | 3/2.5 (-1) | 1,922 (+10%) | 2mo | $176,000 | $92 | 43 |
| 1826 N California Ave | 0.72mi | 3/1.5 (-1) | 1,564 (-10%) | 1mo | $34,900 | $22 | 37 |
| 714 E Kansas St | 0.69mi | 3/1.5 (-1) | 1,538 (-12%) | 2mo | $26,666 | $17 | 35 |
Match score weights: distance 35% · size 25% · config 20% · recency 20%. Top-matched comps best support the ARV.
Projected returns pro-forma
-3.0% appreciation · 3.49% rent growth · sell at horizon
- IRR
- 64.4%
- Equity multiple
- 3.91×
- Total profit
- $32,525
- Equity at exit
- $5,949
- IRR
- 69.0%
- Equity multiple
- 8.20×
- Total profit
- $80,483
- Equity at exit
- $3,450
Cash invested: $11,172 (down + closing). Projections, not guarantees.
Landlord ↔ Tenant lean methodology
- Overall (STATE)
- 43 Moderately Tenant-Leaning
- State Illinois
- 43 Moderately Tenant-Leaning · D+7
- County
- — inherits STATE
- City
- — inherits STATE
ZIP-level market 61603
- Home prices YoY
- -31.8%
- Rents YoY
- 3.5%
- Active inventory
- 104
- Price-to-rent
- 2.7×
Monthly cashflow live
- Estimated rent
- $1,230 high interval (Pro) →
- Mortgage (P&I)
- −$209
- Tax from tax record
- −$145 /mo · $1,737/yr
- Insurance
- −$17
- HOA
- −$0
- Vacancy / Maint / Mgmt
- −$258
- Net cashflow
- $601
Break-even live
UW: 25.0% down · 7.5% · 30yr · 1.5% tax · 5.0% vac · 8.0% maint · 8.0% mgmt
Financing live
Cash to close
- Down payment
- $9,975
- Closing costs
- $1,197
- Reserves months
- —
- Total cash needed
- —
Loan-product check · same deal, 3 products live
Conventional
25% down · 7.5% · 30yr
- Down + closing
- —
- Monthly P&I
- —
- Monthly cashflow
- —
- DSCR
- —
- Eligible?
- —
Personal DTI + credit; lowest rate.
DSCR
20% down · 8.5% · 30yr
- Down + closing
- —
- Monthly P&I
- —
- Monthly cashflow
- —
- DSCR
- —
- Eligible?
- —
No personal income docs; deal must DSCR.
Hard money
10% down · 12.0% · 12mo
- Down + closing
- —
- Monthly P&I
- —
- Monthly cashflow
- —
- DSCR
- —
- Eligible?
- —
Short-term bridge; refi at stabilization.
Rent comps 7 comps
| Address | Beds | Baths | Sqft | Rent | $/sqft | DOM | Units | Dist |
|---|---|---|---|---|---|---|---|---|
| 308 E Archer Ave Peoria, IL | 3.0 | 1.0 | 1444 | $950 | $0.66 | 13d | 1 | 0.30mi |
| 814 W McClure Ave Peoria, IL | 3.0 | 1.0 | 1148 | $1,100 | $0.96 | 43d | 1 | 0.69mi |
| 913 W McClure Ave Peoria, IL | 3.0 | 1.0 | 1400 | $1,200 | $0.86 | 21d | 1 | 0.77mi |
| 1806 N Peoria Ave Peoria, IL | 4.0 | 1.5 | 1668 | $894 | $0.54 | 13d | 1 | 0.77mi |
| 2023 N Underhill St Peoria, IL | 3.0 | 1.0 | 1050 | $1,200 | $1.14 | 13d | 1 | 1.10mi |
| 901 NE Glen Oak Ave Unit 2 Peoria, IL | 3.0 | 1.0 | 1120 | $1,200 | $1.07 | 21d | 1 | 1.12mi |
| 501 W Columbia Ter Unit 3 Peoria, IL | 3.0 | 1.0 | 1500 | $1,400 | $0.93 | 43d | 1 | 1.21mi |
Listing history 24 events
-
2026-06-19days on market $39,900 Active 38 DOM
-
2026-06-18days on market $39,900 Active 37 DOM
-
2026-06-17days on market $39,900 Active 36 DOM
-
2026-06-16days on market $39,900 Active 35 DOM
-
2026-06-15days on market $39,900 Active 34 DOM
-
2026-06-14days on market $39,900 Active 32 DOM
-
2026-06-13days on market $39,900 Active 31 DOM
-
2026-06-10days on market $39,900 Active 29 DOM
-
2026-06-09days on market $39,900 Active 28 DOM
-
2026-06-08days on market $39,900 Active 27 DOM
-
2026-06-07days on market $39,900 Active 26 DOM
-
2026-06-03days on market $39,900 Active 22 DOM
-
2026-06-02days on market $39,900 Active 21 DOM
-
2026-06-01days on market $39,900 Active 20 DOM
-
2026-05-31days on market $39,900 Active 19 DOM
-
2026-05-30days on market $39,900 Active 18 DOM
-
2026-05-12$39,900 Active 492-char remark
-
2022-02-25soldstatus $59,000
-
2022-02-22soldstatus $59,000 532-char remark
Show marketing remark (532 chars)
Come take a look at this 3 unit duplex, situated on a corner lot and centrally located in Peoria! This duplex offers a lower level unit that is a 1 bed, 1 bath, renting for $550, historically. Upper unit is a 1bed, 1 bath and rents historically for $600. The main floor unit is a 2 bed, 1 bath and rents for $800 w/ garage access. Garden level unit and upper level unit are vacant. UPDATES: Roof in 2009 - Tear Off, windows, water heater and some siding in 2007, vanities, carpet and many additional updates. Come take a look today!
-
2021-10-13$69,900 532-char remark
Show marketing remark (532 chars)
Come take a look at this 3 unit duplex, situated on a corner lot and centrally located in Peoria! This duplex offers a lower level unit that is a 1 bed, 1 bath, renting for $550, historically. Upper unit is a 1bed, 1 bath and rents historically for $600. The main floor unit is a 2 bed, 1 bath and rents for $800 w/ garage access. Garden level unit and upper level unit are vacant. UPDATES: Roof in 2009 - Tear Off, windows, water heater and some siding in 2007, vanities, carpet and many additional updates. Come take a look today!
-
2021-08-06historical
-
2021-08-06historical
-
2021-08-06historical
-
2006-04-07soldstatus $82,000
ⓘ Source: listings_history table (triggers on properties + properties_extension) + one-shot
backfill from property_details.listing_events for pre-trigger history.
Tax reassessment forecast IL · Partial reset (capped growth)
- Current annual tax
- $1,737 · $145/mo
- Projected year-2 tax
- $1,737 · $145/mo
- Expected delta
- $0/yr ($0/mo · 0.0%)
ⓘ Screening estimate from a state-policy table — verify with the county assessor before closing.
Climate risk First Street
- Flood 1/10 Low FEMA zone X · 0% chance over 30 yrs
- Wildfire 1/10 Low
- Heat 3/10 Moderate 7 d/yr ≥105°F today · 18 d/yr by 30 yrs out
- Wind 2/10 Low 100% chance of damaging wind over 30 yrs
- Air quality 3/10 Moderate 1 unhealthy d/yr today · 3 by 30 yrs out
Nearby sold comps map
Loading sold comps map…
Walkable amenities ~0.75 mi
Loading nearby amenities…
Taxation est. · year 1
- Rental income
- $14,765
- − Mortgage interest
- −$2,235
- − Property taxes
- −$1,737
- − Insurance
- −$200
- − Repairs & maintenance
- −$1,181
- − Management
- −$1,181
- − Depreciation
- −$1,161
- Taxable income
- $7,070
- Est. tax owed @ 24.0%
- −$1,697
- After-tax cash flow
- $5,520/yr
For passive investors: Depreciation is non-cash, so a rental often shows a tax loss while cash-flowing — sheltering income. Rental losses are passive: they offset passive income freely, and up to $25,000/yr can offset ordinary (W-2) income if you actively participate and your MAGI is under $100k (phasing out to $0 by $150k); unused losses carry forward. On sale, claimed depreciation is recaptured at up to 25%, and gains may owe capital-gains tax (a 1031 exchange can defer both). Figures are a year-1 estimate at your 24.0% rate — not tax advice; consult a CPA.
Schools (NCES district)
- District
- Peoria SD 150
- NCES district ID
- 1731230
- Math proficiency
- 11% ▼ -5.00%
- Reading proficiency
- 14% ▼ -4.00%
- Median HH income
- $41,951
- Composite
- 10.92/100
- National rank
- #9751
- State rank
- #554 of 620 in IL
Livability — Peoria
- Score
- 73/100
- State rank
- #270
- US rank
- #5096
Category grades
Schools grade is shown separately in the Schools card above.
Census & demographics
- Census place
- Peoria, IL
- County
- Peoria County · 120,495 people
- City population
- 114,670
- Metro
- Peoria, IL
- Population (ZIP)
- 15,356
- Household income
- $41,618
- Rent vs Own
- Severe rent burden
- 849.0
Population outlook (Peoria County) Hauer SSP2
- Today (2025)
- 183,007 people
- By 2030
- 179,643 · -1.8%
- By 2040
- 171,782 · -6.1%
- By 2050
- 163,508 · -10.7%
- By 2075
- 140,178 · -23.4%
- By 2100
- 114,493 · -37.4%
Race, ethnicity, and origin ACS 2023
- Neighborhood character
- Diverse neighborhood (Simpson 0.68)
- Race & ethnicity
- Black 43% White 36% Two or more races 12% Hispanic / Latino 10% Asian 1%
- Hispanic origin (detail)
- Mexican 7%
- Common ancestry
- Italian 2% Slovak 1% Lithuanian 1%
- Foreign-born
- 7% · Canada
- Languages at home
- 91% English-only · Spanish 6% Tagalog/Filipino 1%
Political lean MEDSL · Peoria
- 2024 margin
- Toss-up / Even · D 51.5% · R 46.9% · Other 1.6%
- 2008→2024 swing
- -9.2pp toward R · 2008: 13.9pp · 2024: 4.7pp
- All cycles
- 2024: D+4.7 2020: D+6.3 2016: D+2.8 2012: D+4.4 2008: D+13.9
Not yet ingested
- Civics
- —
Market trends
- HPI YoY
- ▼ -65.98%
- Current HPI
- 141.5343
- Rent YoY
- ▲ 3.49%
- Metro
- Peoria, IL
- State GDP YoY
- ▲ 1.59%
- F500 in state
- 60
Industry mix (Fortune 500 HQ in IL)
| Industry | F500 HQs | Revenue |
|---|---|---|
| Insurance | 4 | $201B |
|
||
| Consumer Goods | 4 | $87B |
|
||
| Industrial Machinery | 3 | $64B |
|
||
| Healthcare | 2 | $55B |
|
||
| Retail / Pharmacy | 1 | $148B |
|
||
| Agriculture / Food | 1 | $86B |
|
||
Price history
-51.3% since first listed8 events — show timeline
- 2026-05-12 Listed $39,900 RMLSA as Distributed by MLS Grid
- 2022-02-25 Sold (Public Records) $59,000 Public Records
- 2022-02-22 Sold (MLS) $59,000 RMLSA as Distributed by MLS Grid
- 2021-10-13 Listed $69,900 RMLSA as Distributed by MLS Grid
- 2021-08-06 Listing Removed — RMLSA as Distributed by MLS Grid
- 2021-08-06 Listing Removed — RMLSA as Distributed by MLS Grid
- 2021-08-06 Listing Removed — RMLSA as Distributed by MLS Grid
- 2006-04-07 Sold (Public Records) $82,000 Public Records
Property tax history
-1.1%/yrLatest (2025): $1,737 · +9.4% YoY. Source: county tax records.
Cash-flow waterfall
monthlySold comps — $/sqft
last 12 mo · ≤1 miLoading sold comps…