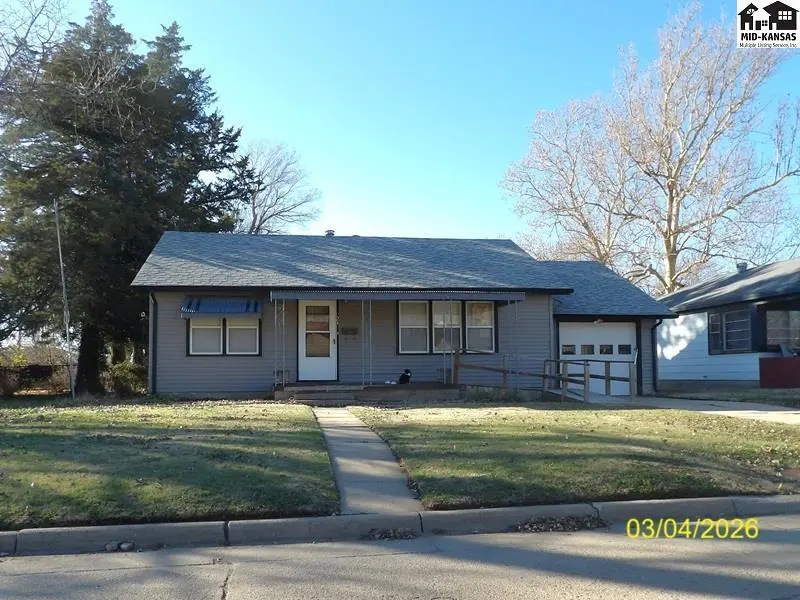
215 S Garfield Ave · Lyons, KS
Flood risk 1/10 · Minimal
- FEMA flood zone
- X (unshaded)
- Chance of flooding over 30 yrs
- 0.0%
- Est. flood insurance / yr
- $507 – $1,088
Fire risk 1/10 · Minimal
- Est. fire insurance / yr
- $1,154 – $2,142
Heat risk 5/10 · Moderate
- Hot days now (above 106°F)
- 7 days/yr
- Hot days in 30 yrs
- 17 days/yr
Wind risk 2/10 · Minimal
- Chance of severe wind over 30 yrs
- —
Air-quality risk 1/10 · Minimal
- Unhealthy air days now
- 0 days/yr
- Unhealthy air days in 30 yrs
- 0 days/yr
Risk factors via First Street. Map © Google.
Why this score? — see what drove the B- grade
The composite is a weighted blend of 9 inputs, each scored 0–100. Each bar is that input's sub-score; the figure is the points it added to the 100-point composite (weight × sub-score).
- Cash flow +29.8/30.0
- DSCR +10.0/10.0
- 1% rule +8.4/10.0
- ARV discount +7.5/15.0
- Livability +3.4/5.0
- Rent growth +2.5/5.0
- Condition / age +2.5/5.0
- Schools +2.1/10.0
- Appreciation +0.0/10.0
$68,400
🖨 Deal sheet (PDF) 📄 Offer letter ✓ Due diligence
Listing remarks MLS
Check out this two bedroom, one bathroom home located in the small town of Lyons. The home offers a large fenced back yard with a one car attached garage and maintenance free vinyl siding. This home has loads of potential and is just waiting for you to add your finishing touches. Call for your showing today!
Key facts
- Fenced back yard
- 7,840 sq ft lot
- Garage
Tags
Property features AI
Exterior
- Parking: 1-car garage
- Utilities: Sewer available; Natural gas available; Public utilities
- Home design: Single-family on-site built home; One level
- Construction: Composition roof; No basement
- Exterior features: Chain link fencing
Interior
- Bathrooms: 1 full bathroom
- Heating & cooling: Forced air heating; Central electric air conditioning
- Interior features: Living room fireplace (one)
- Laundry & utility: Main floor laundry in a separate room
Neighborhood map
What this means for you Summary
Snapshot
- This is a 1-bed/1.0-bath single-family listed at $68k.
Deal economics
- At list price, monthly cash flow is $250 ($3k/yr) — positive.
- The deal already cash-flows at list — no discount required.
- Meets the 1% rule at list price ($915 rent vs $68k).
- Recommended offer: $64k (6.0% below list) — sets the bar for market timing.
Location & tenants
- Location reads 68/100 on livability (#207 in KS) — a middle-class / working-renter tenant base. Strengths: cost of living A+, health & safety A+, crime A; Watch: employment D+, amenities F, commute F.
- Lyons (town): math 23% / reading 26% proficiency, ranked #136 of 169 in KS (top 80%) — low school quality limits family demand, transient renter base, plan for 1-2y turnover; 64% free/reduced lunch — lower-income household profile, screen leases tightly.
- Zoned schools: Lyons Central Elementary (math 32% / reading 42%, grade F, #358 of 684 statewide, top 56%, 157 students, 76% FRL); Lyons Middle School (math 17% / reading 17%, grade F, #167 of 219 statewide, top 78%, 187 students, 81% FRL); Lyons High School (math 15% / reading 5%, grade F, #289 of 327 statewide, top 93%, 212 students, 82% FRL) — zoned schools average 80% FRL vs 64% district-wide (16 pts higher); higher-poverty schools than district average — tighter screening recommended.
- Market conditions: 30 active listings in the ZIP; 13 units permitted in Rice County in 2024 (0 in 5+ unit buildings).
Forward outlook
- Local home prices are declining (-3.0%/yr); year-one equity from $473 of loan paydown is wiped out by about $2k of value loss. Plan a longer hold.
- Rice County population projected to shrink 4% by 2050 — rents likely to lag national; underwrite the cash flow, not the appreciation.
- At projected returns (-3.0% appreciation + 3.0% rent growth), your $19k cash investment doubles in ~8 years — after that, you're playing with house money.
Negotiation context
- It's been on market 69 days — a 6% lower offer ($64k) is reasonable based on typical stale-listing flexibility.
- 2 sale attempts with the ask held roughly flat each time — persistent listings suggest the price (not the market) is what's stuck; bring a comps-based counter.
- Current owner paid $30k; list at $68k implies a 128% gain — meaningful room to come down on a strong offer.
Risks & watch-outs
- Watch-outs: built in 1950 — expect roof / HVAC / electrical / plumbing capex.
- Climate carrying-cost: extreme-heat days projected 7→17/yr by 2055 (HVAC capex compounding) — expect insurance premiums to compound above CPI over the hold.
Questions for the listing agent
- It's been on market 69 days. Have you received any prior offers? Is the seller open to a 6% concession, seller financing, or rate buy-down credit?
- Built in 1950 — when were the roof, HVAC, electrical panel, plumbing, and water heater last replaced?
- Why hasn't it sold? Are there any deal-killer items the seller is aware of (foundation, flood, title, zoning, code violations)?
- Is there a deadline driving the sale (1031 exchange, divorce, estate, relocation)? That informs how much negotiation room exists.
- Schools are F-rated, which usually means shorter tenancies and higher turnover. Who's the typical renter profile here, and what's been the actual vacancy rate?
- What's the average days-on-market for RENTAL listings here right now (not sales)? A rising rental-DOM trend means longer vacancies and softer asking-rent achievability than the comps imply.
- What's the recent tenant-quality profile in this submarket — average credit score on applications, eviction rate, late-payment / NSF rate, and stable-employment percentage? A property-management company in the area should have these aggregated.
- How much new for-sale + rental construction is in the pipeline within 1–3 miles? Heavy new supply typically softens prices + rents 12–24 months out; constrained supply supports both.
Investment metrics
- 1% rule
- 1.34% ✓
- Cap rate
- 10.68%
- Cash-on-cash
- 15.67%
- DSCR
- 1.70
- GRM
- 6.2
CMA / ARV
No comps found within radius.
Projected returns pro-forma
-3.0% appreciation · 3.0% rent growth · sell at horizon
- IRR
- 6.5%
- Equity multiple
- 1.25×
- Total profit
- $4,860
- Equity at exit
- $10,199
- IRR
- 15.9%
- Equity multiple
- 2.29×
- Total profit
- $24,800
- Equity at exit
- $5,914
Cash invested: $19,152 (down + closing). Projections, not guarantees.
Landlord ↔ Tenant lean methodology
- Overall (STATE)
- 83 Strongly Landlord-Friendly
- State Kansas
- 83 Strongly Landlord-Friendly · R+10
- County
- — inherits STATE
- City
- — inherits STATE
ZIP-level market 67554
- Active inventory
- 30
- Price-to-rent
- 6.2×
Monthly cashflow live
- Estimated rent
- $915 medium interval (Pro) →
- Mortgage (P&I)
- −$359
- Tax est. 1.5%
- −$86 /mo · $1,026/yr
- Insurance
- −$28
- HOA
- −$0
- Vacancy / Maint / Mgmt
- −$192
- Net cashflow
- $250
Break-even live
Sensitivity live
| Price | -10% $297 | -5% $274 | +0% $250 | +5% $226 | +10% $203 |
|---|---|---|---|---|---|
| Rent | -10% $178 | -5% $214 | +0% $250 | +5% $286 | +10% $322 |
| Rate | -1.0pp $285 | -0.5pp $268 | base $250 | +0.5pp $232 | +1.0pp $214 |
UW: 25.0% down · 7.5% · 30yr · 1.5% tax · 5.0% vac · 8.0% maint · 8.0% mgmt
Financing live
Cash to close
- Down payment
- $17,100
- Closing costs
- $2,052
- Reserves months
- —
- Total cash needed
- —
Loan-product check · same deal, 3 products live
Conventional
25% down · 7.5% · 30yr
- Down + closing
- —
- Monthly P&I
- —
- Monthly cashflow
- —
- DSCR
- —
- Eligible?
- —
Personal DTI + credit; lowest rate.
DSCR
20% down · 8.5% · 30yr
- Down + closing
- —
- Monthly P&I
- —
- Monthly cashflow
- —
- DSCR
- —
- Eligible?
- —
No personal income docs; deal must DSCR.
Hard money
10% down · 12.0% · 12mo
- Down + closing
- —
- Monthly P&I
- —
- Monthly cashflow
- —
- DSCR
- —
- Eligible?
- —
Short-term bridge; refi at stabilization.
Listing history 20 events
-
2026-06-18days on market $68,400 Active 69 DOM
-
2026-06-17days on market $68,400 Active 68 DOM
-
2026-06-16days on market $68,400 Active 67 DOM
-
2026-06-15days on market $68,400 Active 66 DOM
-
2026-06-13days on market $68,400 Active 64 DOM
-
2026-06-12days on market $68,400 Active 63 DOM
-
2026-06-09days on market $68,400 Active 60 DOM
-
2026-06-08days on market $68,400 Active 59 DOM
-
2026-06-07days on market $68,400 Active 58 DOM
-
2026-06-05days on market $68,400 Active 56 DOM
-
2026-06-04days on market $68,400 Active 54 DOM
-
2026-06-02days on market $68,400 Active 53 DOM
-
2026-06-01days on market $68,400 Active 52 DOM
-
2026-05-31days on market $68,400 Active 51 DOM
-
2026-05-31days on market $68,400 Active 50 DOM
-
2026-05-20$68,400 Active 309-char remark
Show marketing remark (309 chars)
Check out this two bedroom, one bathroom home located in the small town of Lyons. The home offers a large fenced back yard with a one car attached garage and maintenance free vinyl siding. This home has loads of potential and is just waiting for you to add your finishing touches. Call for your showing today!
-
2026-05-15price $68,400
-
2026-04-23price $72,000
-
2026-04-09$74,000 Active
-
2005-07-01soldstatus $30,000
ⓘ Source: listings_history table (triggers on properties + properties_extension) + one-shot
backfill from property_details.listing_events for pre-trigger history.
Climate risk First Street
- Flood 1/10 Low FEMA zone X (unshaded) · 0% chance over 30 yrs
- Wildfire 1/10 Low
- Heat 5/10 Major 7 d/yr ≥106°F today · 17 d/yr by 30 yrs out
- Wind 2/10 Low
- Air quality 1/10 Low 0 unhealthy d/yr today · 0 by 30 yrs out
Nearby sold comps map
Loading sold comps map…
Walkable amenities ~0.75 mi
Loading nearby amenities…
Taxation est. · year 1
- Rental income
- $10,979
- − Mortgage interest
- −$3,831
- − Property taxes
- −$1,026
- − Insurance
- −$342
- − Repairs & maintenance
- −$878
- − Management
- −$878
- − Depreciation
- −$1,990
- Taxable income
- $2,033
- Est. tax owed @ 24.0%
- −$488
- After-tax cash flow
- $2,513/yr
For passive investors: Depreciation is non-cash, so a rental often shows a tax loss while cash-flowing — sheltering income. Rental losses are passive: they offset passive income freely, and up to $25,000/yr can offset ordinary (W-2) income if you actively participate and your MAGI is under $100k (phasing out to $0 by $150k); unused losses carry forward. On sale, claimed depreciation is recaptured at up to 25%, and gains may owe capital-gains tax (a 1031 exchange can defer both). Figures are a year-1 estimate at your 24.0% rate — not tax advice; consult a CPA.
Schools (NCES district)
- District
- Lyons
- NCES district ID
- 2009030
- Math proficiency
- 23% ▼ -10.00%
- Reading proficiency
- 26% ▼ -4.00%
- Median HH income
- $47,109
- Composite
- 21.36/100
- National rank
- #8363
- State rank
- #136 of 169 in KS
Livability — Lyons
- Score
- 68/100
- State rank
- #207
- US rank
- #9304
Category grades
Schools grade is shown separately in the Schools card above.
Census & demographics
- Census place
- Lyons, KS
- Population (ZIP)
- 4,122
Population outlook (Rice County) Hauer SSP2
- Today (2025)
- 9,798 people
- By 2030
- 9,694 · -1.1%
- By 2040
- 9,507 · -3.0%
- By 2050
- 9,457 · -3.5%
- By 2075
- 9,487 · -3.2%
- By 2100
- 9,144 · -6.7%
Race, ethnicity, and origin ACS 2023
- Neighborhood character
- Predominantly White (69%)
- Race & ethnicity
- White 69% Hispanic / Latino 24% Two or more races 17% Black 2%
- Hispanic origin (detail)
- Mexican 21%
- Common ancestry
- Iranian 3% Lithuanian 2% Slovak 2%
- Foreign-born
- 6% · Canada
- Languages at home
- 86% English-only · Spanish 14%
Political lean MEDSL · Rice
- 2024 margin
- Solid R (+56.7) · D 20.8% · R 77.5% · Other 1.7%
- 2008→2024 swing
- -16.5pp toward R · 2008: -40.2pp · 2024: -56.7pp
- All cycles
- 2024: R+56.7 2020: R+52.8 2016: R+55.6 2012: R+47.8 2008: R+40.2
Not yet ingested
- Civics
- —
Market trends
- HPI YoY
- ▼ -89.91%
- Current HPI
- 165.4881
- Rent YoY
- —
- Metro
- —
- State GDP YoY
- —
- F500 in state
- 0
Price history
+128.0% since first listed5 events — show timeline
- 2026-05-20 Listed $68,400 MKMLS as distributed by MLS GRID
- 2026-05-15 Price Changed $68,400 SCKMLS as Distributed by MLS Grid
- 2026-04-23 Price Changed $72,000 SCKMLS as Distributed by MLS Grid
- 2026-04-09 Listed $74,000 SCKMLS as Distributed by MLS Grid
- 2005-07-01 Sold (Public Records) $30,000 Public Records
Cash-flow waterfall
monthlySold comps — $/sqft
last 12 mo · ≤1 miLoading sold comps…