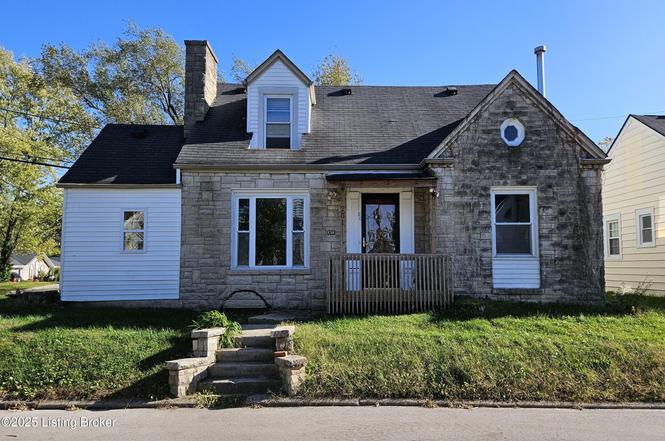
201 Virginia Ct · New Albany, IN
Flood risk 1/10 · Minimal
- FEMA flood zone
- X (unshaded)
- Chance of flooding over 30 yrs
- 0.0%
- Est. flood insurance / yr
- $507 – $1,088
Fire risk 1/10 · Minimal
- Est. fire insurance / yr
- $717 – $1,331
Heat risk 5/10 · Moderate
- Hot days now (above 106°F)
- 7 days/yr
- Hot days in 30 yrs
- 21 days/yr
Wind risk 2/10 · Minimal
- Chance of severe wind over 30 yrs
- 1.0%
Air-quality risk 2/10 · Minimal
- Unhealthy air days now
- 1 days/yr
- Unhealthy air days in 30 yrs
- 2 days/yr
Risk factors via First Street. Map © Google.
Why this score? — see what drove the B+ grade
The composite is a weighted blend of 9 inputs, each scored 0–100. Each bar is that input's sub-score; the figure is the points it added to the 100-point composite (weight × sub-score).
- Cash flow +29.5/30.0
- ARV discount +15.0/15.0
- DSCR +10.0/10.0
- 1% rule +8.0/10.0
- Rent growth +4.3/5.0
- Schools +4.2/10.0
- Livability +3.7/5.0
- Condition / age +2.5/5.0
- Appreciation +0.0/10.0
$130,000
🖨 Deal sheet 📄 Offer letter ✓ Due diligence
Listing remarks
Welcome to 201 Virginia Court. Attention investors, or first time home buyers who don't mind putting in a little work, this Cape Cod presents an excellent investment opportunity. Situated on a corner lot in the heart of New Albany, just a short drive or few minutes' walk from all the restaurants and shops downtown, this home has great potential. A covered front entrance greets you as you walk up. Heading inside brings you the living room where you will love the stone wood burning fireplace. The living room also offers original hardwood floors and abundant natural light. Behind the living room are an open family room, dining area, and kitchen. The kitchen offers ample cabinet space, tile cou
Key facts
- Tile countertops
- Ample cabinet space
- Tile flooring
Tags
Neighborhood map
What this means for you Summary
Snapshot
- This is a 4-bed/1.0-bath single-family listed at $130k.
Deal economics
- At list price, monthly cash flow is $467 ($6k/yr) — positive.
- The deal already cash-flows at list — no discount required.
- Meets the 1% rule at list price ($2k rent vs $130k).
- Recommended offer: $122k (6.0% below list) — sets the bar for market timing.
- Cap rate 10.6% vs local median 3.8% in New Albany — top-decile yield for the area; either an underpriced asset or a hidden risk that comps aren't pricing in. Stress-test before assuming the spread holds.
Location & tenants
- Location reads 73/100 on livability (#100 in IN) — a middle-class / working-renter tenant base. Strengths: cost of living A+, housing A+, health & safety B; Watch: commute C-, employment D+, schools D.
- New Albany-Floyd County Consolidated Schools (suburban): math 46% / reading 50% proficiency, ranked #68 of 301 in IN (top 23%) — families likely to look elsewhere, expect single-tenant / working-renter base with shorter leases.
- Market conditions: Rents rising fast (+7.2%/yr); 269 active listings in the ZIP; 3 comparable units currently listed for rent nearby; rentals at typical pace (median 21d on market — plan ~3-4 weeks tenant-placement turnaround); 297 units permitted in Floyd County in 2024 (84 in 5+ unit buildings).
- This rent runs 32% of the median local income ($63k/yr) — at the standard rent-burdened threshold; future hikes will face affordability resistance.
Forward outlook
- Local home prices are declining (-3.0%/yr); year-one equity from $899 of loan paydown is wiped out by about $4k of value loss. Plan a longer hold.
- Floyd County population projected at +10% by 2050 — modest demand growth; plan on rents tracking national, not racing it.
- At projected returns (-3.0% appreciation + 7.2% rent growth), your $36k cash investment doubles in ~6 years — after that, you're playing with house money.
Negotiation context
- It's been on market 76 days — a 6% lower offer ($122k) is reasonable based on typical stale-listing flexibility.
- 2 sale attempts; this cycle's ask has dropped $10k (7%) from the opening price — seller is motivated, your offer sets the floor, not the list.
Risks & watch-outs
- Watch-outs: built in 1950 — expect roof / HVAC / electrical / plumbing capex.
- Climate carrying-cost: extreme-heat days projected 7→21/yr by 2055 (HVAC capex compounding) — expect insurance premiums to compound above CPI over the hold.
Questions for the listing agent
- It's been on market 76 days. Have you received any prior offers? Is the seller open to a 6% concession, seller financing, or rate buy-down credit?
- Built in 1950 — when were the roof, HVAC, electrical panel, plumbing, and water heater last replaced?
- Why hasn't it sold? Are there any deal-killer items the seller is aware of (foundation, flood, title, zoning, code violations)?
- Is there a deadline driving the sale (1031 exchange, divorce, estate, relocation)? That informs how much negotiation room exists.
- Schools are D-rated, which usually means shorter tenancies and higher turnover. Who's the typical renter profile here, and what's been the actual vacancy rate?
- What's the average days-on-market for RENTAL listings here right now (not sales)? A rising rental-DOM trend means longer vacancies and softer asking-rent achievability than the comps imply.
- What's the recent tenant-quality profile in this submarket — average credit score on applications, eviction rate, late-payment / NSF rate, and stable-employment percentage? A property-management company in the area should have these aggregated.
- How much new for-sale + rental construction is in the pipeline within 1–3 miles? Heavy new supply typically softens prices + rents 12–24 months out; constrained supply supports both.
Investment metrics
- 1% rule
- 1.30% ✓
- Cap rate
- 10.60%
- Cash-on-cash
- 15.39%
- DSCR
- 1.68
- GRM
- 6.4
CMA / ARV
- ARV (on-the-fly)
- $229,537
- Comps found
- 12
Show comp detail 12 sales within ~0.75 mi
| Address | Dist | Beds/Ba | Sqft | Sold | Price | $/sf | Match |
|---|---|---|---|---|---|---|---|
| 302 Country Club Dr | 0.40mi | 4/2.0 | 1,942 (+2%) | 4mo | $245,000 | $126 | 69 |
| 224 E Lewis St | 0.28mi | 5/2.0 (+1) | 1,882 (-1%) | 11mo | $199,900 | $106 | 68 |
| 2210 Gary Dr | 0.54mi | 3/1.5 (-1) | 1,880 (-1%) | 2mo | $285,000 | $152 | 65 |
| 525 Fenwick Dr | 0.55mi | 4/2.0 | 1,850 (-2%) | 2mo | $225,000 | $122 | 64 |
| 301 Country Club Dr | 0.42mi | 3/1.5 (-1) | 1,974 (+4%) | 5mo | $222,900 | $113 | 62 |
| 306 Country Club Dr | 0.44mi | 3/2.0 (-1) | 1,920 (+1%) | 9mo | $232,000 | $121 | 61 |
| 1912 Bono Rd | 0.38mi | 3/1.5 (-1) | 2,180 (+15%) | 0mo | $230,000 | $106 | 50 |
| 921 Valley View Rd | 0.56mi | 3/1.0 (-1) | 1,680 (-11%) | 0mo | $184,000 | $110 | 49 |
| 10 Valley View Ct | 0.35mi | 3/2.0 (-1) | 1,635 (-14%) | 5mo | $280,000 | $171 | 48 |
| 811 W 8th St | 0.70mi | 4/2.0 | 1,680 (-11%) | 2mo | $194,900 | $116 | 42 |
| 2224 Gary Dr | 0.63mi | 4/2.0 | 2,112 (+11%) | 12mo | $246,500 | $117 | 38 |
| 809 W 7th St | 0.66mi | 3/2.0 (-1) | 2,050 (+8%) | 13mo | $249,000 | $121 | 36 |
Match score weights: distance 35% · size 25% · config 20% · recency 20%. Top-matched comps best support the ARV.
Projected returns pro-forma
-3.0% appreciation · 7.24% rent growth · sell at horizon
- IRR
- 10.7%
- Equity multiple
- 1.45×
- Total profit
- $16,213
- Equity at exit
- $19,383
- IRR
- 23.0%
- Equity multiple
- 3.37×
- Total profit
- $86,195
- Equity at exit
- $11,240
Cash invested: $36,400 (down + closing). Projections, not guarantees.
Landlord ↔ Tenant lean methodology
- Overall (STATE)
- 90 Strongly Landlord-Friendly
- State Indiana
- 90 Strongly Landlord-Friendly · R+11
- County
- — inherits STATE
- City
- — inherits STATE
ZIP-level market 47150
- Rents YoY
- 7.2%
- Active inventory
- 269
- Price-to-rent
- 6.4×
Monthly cashflow live
- Estimated rent
- $1,694 medium interval (Pro) →
- Mortgage (P&I)
- −$682
- Tax from tax record
- −$136 /mo · $1,627/yr
- Insurance
- −$54
- HOA
- −$0
- Vacancy / Maint / Mgmt
- −$356
- Net cashflow
- $467
Break-even live
UW: 25.0% down · 7.5% · 30yr · 1.5% tax · 5.0% vac · 8.0% maint · 8.0% mgmt
Financing live
Cash to close
- Down payment
- $32,500
- Closing costs
- $3,900
- Reserves months
- —
- Total cash needed
- —
Loan-product check · same deal, 3 products live
Conventional
25% down · 7.5% · 30yr
- Down + closing
- —
- Monthly P&I
- —
- Monthly cashflow
- —
- DSCR
- —
- Eligible?
- —
Personal DTI + credit; lowest rate.
DSCR
20% down · 8.5% · 30yr
- Down + closing
- —
- Monthly P&I
- —
- Monthly cashflow
- —
- DSCR
- —
- Eligible?
- —
No personal income docs; deal must DSCR.
Hard money
10% down · 12.0% · 12mo
- Down + closing
- —
- Monthly P&I
- —
- Monthly cashflow
- —
- DSCR
- —
- Eligible?
- —
Short-term bridge; refi at stabilization.
Rent comps 3 comps
| Address | Beds | Baths | Sqft | Rent | $/sqft | DOM | Units | Dist |
|---|---|---|---|---|---|---|---|---|
| 1810 Woodland Rd New Albany, IN | 3.0 | 1.0 | 2016 | $1,800 | $0.89 | 21d | 1 | 0.98mi |
| 212 Maevi Dr New Albany, IN | 3.0 | 1.0 | 1251 | $1,375 | $1.10 | 21d | 1 | 1.02mi |
| 807 E Main St New Albany, IN | 3.0 | 2.0 | 1500 | $1,650 | $1.10 | 19d | 1 | 1.31mi |
Listing history 9 events
-
2026-02-06status Pending
-
2026-01-10price $130,000
-
2026-01-09price $130,000
-
2025-12-04status Active
-
2025-11-04status Pending
-
2025-10-22$140,000 Active
-
2023-12-27price $148,000
-
2023-08-19price $139,900
-
2023-08-13price $144,000
ⓘ Source: listings_history table (triggers on properties + properties_extension) + one-shot
backfill from property_details.listing_events for pre-trigger history.
Tax reassessment forecast IN · Partial reset (capped growth)
- Current annual tax
- $1,627 · $136/mo
- Projected year-2 tax
- $1,627 · $136/mo
- Expected delta
- $0/yr ($0/mo · 0.0%)
ⓘ Screening estimate from a state-policy table — verify with the county assessor before closing.
Climate risk First Street
- Flood 1/10 Low FEMA zone X (unshaded) · 0% chance over 30 yrs
- Wildfire 1/10 Low
- Heat 5/10 Major 7 d/yr ≥106°F today · 21 d/yr by 30 yrs out
- Wind 2/10 Low 100% chance of damaging wind over 30 yrs
- Air quality 2/10 Low 1 unhealthy d/yr today · 2 by 30 yrs out
Nearby sold comps map
Loading sold comps map…
Walkable amenities ~0.75 mi
Loading nearby amenities…
Taxation est. · year 1
- Rental income
- $20,329
- − Mortgage interest
- −$7,282
- − Property taxes
- −$1,627
- − Insurance
- −$650
- − Repairs & maintenance
- −$1,626
- − Management
- −$1,626
- − Depreciation
- −$3,782
- Taxable income
- $3,736
- Est. tax owed @ 24.0%
- −$897
- After-tax cash flow
- $4,706/yr
For passive investors: Depreciation is non-cash, so a rental often shows a tax loss while cash-flowing — sheltering income. Rental losses are passive: they offset passive income freely, and up to $25,000/yr can offset ordinary (W-2) income if you actively participate and your MAGI is under $100k (phasing out to $0 by $150k); unused losses carry forward. On sale, claimed depreciation is recaptured at up to 25%, and gains may owe capital-gains tax (a 1031 exchange can defer both). Figures are a year-1 estimate at your 24.0% rate — not tax advice; consult a CPA.
Schools (NCES district)
- District
- New Albany-Floyd County Consolidated Schools
- NCES district ID
- 1807410
- Math proficiency
- 46% ▼ -4.00%
- Reading proficiency
- 50% ▼ -3.00%
- Median HH income
- $54,709
- Composite
- 41.57/100
- National rank
- #3441
- State rank
- #68 of 301 in IN
Livability — New Albany
- Score
- 73/100
- State rank
- #100
- US rank
- #5454
Category grades
Schools grade is shown separately in the Schools card above.
Census & demographics
- Census place
- New Albany, IN
- County
- Floyd County · 49,144 people
- City population
- 49,144
- Metro
- Louisville/Jefferson County, KY-IN
- Population (ZIP)
- 49,144
- Household income
- $62,820
- Rent vs Own
- Severe rent burden
- 1737.0
Population outlook (Floyd County) Hauer SSP2
- Today (2025)
- 82,092 people
- By 2030
- 84,384 · +2.8%
- By 2040
- 87,919 · +7.1%
- By 2050
- 89,958 · +9.6%
- By 2075
- 94,159 · +14.7%
- By 2100
- 91,907 · +12.0%
Race, ethnicity, and origin ACS 2023
- Neighborhood character
- Predominantly White (82%)
- Race & ethnicity
- White 82% Black 8% Two or more races 6% Hispanic / Latino 5% Asian 1%
- Common ancestry
- Italian 3% Slovak 2% Lithuanian 2%
- Foreign-born
- 3% · Canada
- Languages at home
- 96% English-only · Spanish 2% Other Asian/Pacific 1%
Political lean MEDSL · Floyd
- 2024 margin
- R (+15.5) · D 41.4% · R 56.9% · Other 1.7%
- 2008→2024 swing
- -5.4pp toward R · 2008: -10.1pp · 2024: -15.5pp
- All cycles
- 2024: R+15.5 2020: R+14.1 2016: R+20.1 2012: R+14.3 2008: R+10.1
Not yet ingested
- Civics
- —
Market trends
- HPI YoY
- ▼ -185.20%
- Current HPI
- 206.7738
- Rent YoY
- ▲ 7.24%
- Metro
- Louisville/Jefferson County, KY-IN
- State GDP YoY
- ▲ 2.90%
- F500 in state
- 18
Industry mix (Fortune 500 HQ in IN)
| Industry | F500 HQs | Revenue |
|---|---|---|
| Industrial Machinery | 2 | $37B |
|
||
| Healthcare | 1 | $177B |
|
||
| Pharmaceuticals | 1 | $45B |
|
||
| Metals / Steel | 1 | $18B |
|
||
| Agriculture | 1 | $17B |
|
||
| Packaging | 1 | $12B |
|
||
Price history
-9.7% since first listed9 events — show timeline
- 2026-02-06 Pending — Metro Search MLS
- 2026-01-10 Price Changed $130,000 Metro Search MLS
- 2026-01-09 Price Changed $130,000 SIRA
- 2025-12-04 Relisted — Metro Search MLS
- 2025-11-04 Pending — Metro Search MLS
- 2025-10-22 Listed $140,000 Metro Search MLS
- 2023-12-27 Price Changed $148,000 SIRA
- 2023-08-19 Price Changed $139,900 SIRA
- 2023-08-13 Price Changed $144,000 SIRA
Property tax history
+9.2%/yrLatest (2024): $1,627 · +20.0% YoY. Source: county tax records.
Cash-flow waterfall
monthlySold comps — $/sqft
last 12 mo · ≤1 miLoading sold comps…