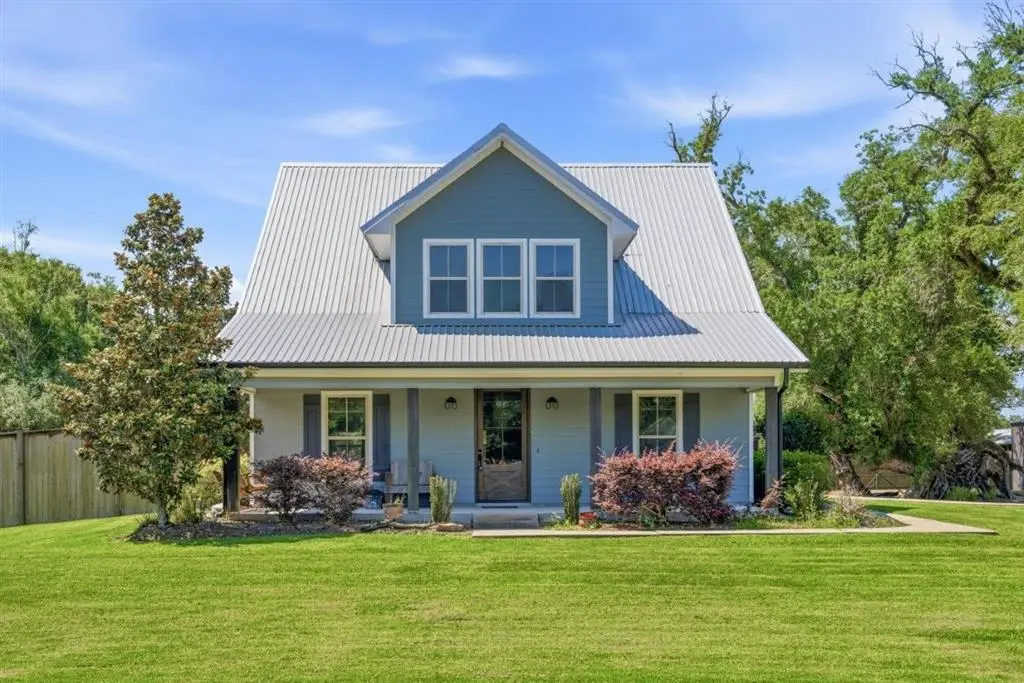
1615 Lawton Dr · Carlyss, LA
Flood risk 5/10 · Moderate
- FEMA flood zone
- AE
- Chance of flooding over 30 yrs
- 0.47%
- Est. flood insurance / yr
- $1,737 – $8,500
Fire risk 3/10 · Minor
- Est. fire insurance / yr
- $1,269 – $2,357
Heat risk 9/10 · Severe
- Hot days now (above 109°F)
- 7 days/yr
- Hot days in 30 yrs
- 23 days/yr
Wind risk 9/10 · Severe
- Chance of severe wind over 30 yrs
- 99.0%
Air-quality risk 2/10 · Minimal
- Unhealthy air days now
- 1 days/yr
- Unhealthy air days in 30 yrs
- 1 days/yr
Risk factors via First Street. Map © Google.
Why this score? — see what drove the C- grade
The composite is a weighted blend of 9 inputs, each scored 0–100. Each bar is that input's sub-score; the figure is the points it added to the 100-point composite (weight × sub-score).
- Cash flow +25.5/30.0
- DSCR +8.5/10.0
- 1% rule +5.9/10.0
- Schools +3.1/10.0
- Livability +3.1/5.0
- Rent growth +2.5/5.0
- Condition / age +2.5/5.0
- ARV discount +0.0/15.0
- Appreciation +0.0/10.0
$412,900
🖨 Deal sheet (PDF) 📄 Offer letter ✓ Due diligence
Listing remarks
A coastal cottage inspired home built in 2016 that perfectly blends modern comfort, spacious living, and exceptional amenities - this property offers everything you need for comfortable living and entertaining. Step inside to find expansive living areas filled with natural light and thoughtfully designed for both everyday comfort and hosting guests. This beautiful home offers an inviting open floor plan that seamlessly connects the heart of the home with the living and dining areas, creating the perfect space for entertaining, gathering, or simply enjoying everyday living. The spacious layout allows for an easy flow and plenty of natural light throughout. Also downstairs the oversized prima
Key facts
- Open floor plan
- Separate shower
- Full acre of land
Tags
Property features AI
Exterior
- Utilities: Public water; Public sewer; Cable available; Electricity connected; Natural gas connected; Water connected
- Home design: Single-family residential house; 2 stories
- Exterior features: In-ground pool; Heated in-ground spa/hot tub; Back yard and front yard; Rectangular 1-acre lot (approx. 200 x 200)
Interior
- Bedrooms: One bedroom on the main level
- Bathrooms: 3 full bathrooms; 1 half bathroom; 1 main-level bathroom
- Interior features: Gas fireplace; Central heating and central air
Neighborhood map
What this means for you Summary
Snapshot
- This is a 3-bed/3.5-bath single-family listed at $413k.
Deal economics
- At list price, monthly cash flow is $540 ($6k/yr) — positive.
- The deal already cash-flows at list — no discount required.
- Meets the 1% rule at list price ($4k rent vs $413k).
Location & tenants
- Location reads 61/100 on livability (#237 in LA) — a middle-class / working-renter tenant base. Strengths: cost of living A+, housing A+, employment B; Watch: crime D-, amenities F, commute F.
- Calcasieu Parish (other): math 30% / reading 44% proficiency, ranked #29 of 98 in LA (top 30%) — families likely to look elsewhere, expect single-tenant / working-renter base with shorter leases.
- Zoned schools: Cypress Cove Elementary School (math 42% / reading 60%, grade C-, #120 of 646 statewide, top 19%, 512 students, 61% FRL); W. W. Lewis Middle School (math 33% / reading 48%, grade F, #62 of 218 statewide, top 29%, 777 students, 49% FRL); Sulphur High School (math 36% / reading 53%, grade F, #58 of 265 statewide, top 23%, 2,043 students, 47% FRL) — zoned schools at 52% FRL track the district average.
- Market conditions: 236 active listings in the ZIP; 1 comparable units currently listed for rent nearby; 1,298 units permitted in Calcasieu Parish in 2024 (526 in 5+ unit buildings).
Forward outlook
- Local home prices are declining (-3.0%/yr); year-one equity from $3k of loan paydown is wiped out by about $12k of value loss. Plan a longer hold.
- Calcasieu County population projected at +11% by 2050 — modest demand growth; plan on rents tracking national, not racing it.
Negotiation context
- Only 2 days on market — expect competitive offers; lowballing is unlikely to land.
- Current owner paid $280k; 48% above their basis — modest negotiation headroom, anchor on the comps not their cost.
Risks & watch-outs
- Watch-outs: flood insurance adds $427/mo.
- Climate carrying-cost: in FEMA flood zone AE (mandatory federal flood insurance); severe wind risk, 99% chance of damaging wind over 30y; extreme-heat days projected 7→23/yr by 2055 (HVAC capex compounding) — expect insurance premiums to compound above CPI over the hold.
Questions for the listing agent
- What's the actual annual flood-insurance premium (NFIP or private), and is the property in a SFHA with mandatory coverage?
- Is there a deadline driving the sale (1031 exchange, divorce, estate, relocation)? That informs how much negotiation room exists.
- Schools are F-rated, which usually means shorter tenancies and higher turnover. Who's the typical renter profile here, and what's been the actual vacancy rate?
- Crime grade is D in this area — have there been break-ins, vandalism, or insurance claims at this property in the last 3 years? What carrier currently insures it and at what premium?
- What's the average days-on-market for RENTAL listings here right now (not sales)? A rising rental-DOM trend means longer vacancies and softer asking-rent achievability than the comps imply.
- What's the recent tenant-quality profile in this submarket — average credit score on applications, eviction rate, late-payment / NSF rate, and stable-employment percentage? A property-management company in the area should have these aggregated.
- How much new for-sale + rental construction is in the pipeline within 1–3 miles? Heavy new supply typically softens prices + rents 12–24 months out; constrained supply supports both.
Investment metrics
- 1% rule
- 1.09% ✓
- Cap rate
- 9.10%
- Cash-on-cash
- 10.03%
- DSCR
- 1.45
- GRM
- 7.6
CMA / ARV
- ARV (on-the-fly)
- $284,416
- Comps found
- 9
Show comp detail 9 sales within ~0.75 mi
| Address | Dist | Beds/Ba | Sqft | Sold | Price | $/sf | Match |
|---|---|---|---|---|---|---|---|
| 1332 Lawton Dr | 0.33mi | 3/2.0 | 2,270 (+2%) | 6mo | $325,000 | $143 | 70 |
| 4620 Brooklyn Dr | 0.27mi | 3/2.0 | 2,390 (+8%) | 11mo | $280,000 | $117 | 60 |
| 4108 Linda Ln | 0.41mi | 3/2.0 | 2,429 (+9%) | 3mo | $365,000 | $150 | 57 |
| 2002 Chamblee Dr | 0.47mi | 3/2.5 | 2,160 (-3%) | 21mo | $225,000 | $104 | 52 |
| 2061 S Red Oak Forest Ln | 0.69mi | 4/2.5 (+1) | 2,350 (+6%) | 7mo | $330,000 | $140 | 43 |
| 1423 Southern Oaks Dr | 0.38mi | 3/2.0 | 1,953 (-12%) | 18mo | $234,000 | $120 | 42 |
| 1966 Burkholder Rd Rd | 0.59mi | 3/2.0 | 1,944 (-12%) | 9mo | $248,186 | $128 | 38 |
| 1214 Ms Daisys Dr | 0.71mi | 3/2.0 | 2,142 (-4%) | 22mo | $256,000 | $120 | 36 |
| 1987 N Red Oak Forest Ln N | 0.53mi | 3/2.0 | 1,913 (-14%) | 21mo | $348,000 | $182 | 29 |
Match score weights: distance 35% · size 25% · config 20% · recency 20%. Top-matched comps best support the ARV.
Projected returns pro-forma
-3.0% appreciation · 3.0% rent growth · sell at horizon
- IRR
- -7.6%
- Equity multiple
- 0.72×
- Total profit
- $-32,366
- Equity at exit
- $61,565
- IRR
- 2.0%
- Equity multiple
- 1.14×
- Total profit
- $16,758
- Equity at exit
- $35,700
Cash invested: $115,612 (down + closing). Projections, not guarantees.
Landlord ↔ Tenant lean methodology
- Overall (STATE)
- 90 Strongly Landlord-Friendly
- State Louisiana
- 90 Strongly Landlord-Friendly · R+12
- County
- — inherits STATE
- City
- — inherits STATE
ZIP-level market 70665
- Active inventory
- 236
- Price-to-rent
- 7.6×
Monthly cashflow live
- Estimated rent
- $4,500 medium interval (Pro) →
- Mortgage (P&I)
- −$2,165
- Tax from tax record
- −$251 /mo · $3,017/yr
- Insurance
- −$172
- Flood insurance flood zone
- −$427 /mo · $5,118/yr
- HOA
- −$0
- Vacancy / Maint / Mgmt
- −$945
- Net cashflow
- $540
Break-even live
Sensitivity live
| Price | -10% $773 | -5% $657 | +0% $540 | +5% $423 | +10% $306 |
|---|---|---|---|---|---|
| Rent | -10% $184 | -5% $362 | +0% $540 | +5% $717 | +10% $895 |
| Rate | -1.0pp $748 | -0.5pp $645 | base $540 | +0.5pp $433 | +1.0pp $324 |
UW: 25.0% down · 7.5% · 30yr · 1.5% tax · 5.0% vac · 8.0% maint · 8.0% mgmt
Financing live
Cash to close
- Down payment
- $103,225
- Closing costs
- $12,387
- Reserves months
- —
- Total cash needed
- —
Loan-product check · same deal, 3 products live
Conventional
25% down · 7.5% · 30yr
- Down + closing
- —
- Monthly P&I
- —
- Monthly cashflow
- —
- DSCR
- —
- Eligible?
- —
Personal DTI + credit; lowest rate.
DSCR
20% down · 8.5% · 30yr
- Down + closing
- —
- Monthly P&I
- —
- Monthly cashflow
- —
- DSCR
- —
- Eligible?
- —
No personal income docs; deal must DSCR.
Hard money
10% down · 12.0% · 12mo
- Down + closing
- —
- Monthly P&I
- —
- Monthly cashflow
- —
- DSCR
- —
- Eligible?
- —
Short-term bridge; refi at stabilization.
Rent comps 1 comps
| Address | Beds | Baths | Sqft | Rent | $/sqft | DOM | Units | Dist |
|---|---|---|---|---|---|---|---|---|
| 2385 Leonard Rd Sulphur, LA | 4.0 | 2.0 | 2723 | $4,500 | $1.65 | 45d | 1 | 0.94mi |
Listing history 3 events
-
2026-05-20status Pending
-
2026-05-18$412,900 Active
-
2014-06-20soldstatus $279,500
ⓘ Source: listings_history table (triggers on properties + properties_extension) + one-shot
backfill from property_details.listing_events for pre-trigger history.
Tax reassessment forecast LA · Resets to sale price
- Current annual tax
- $3,017 · $251/mo
- Projected year-2 tax
- $3,017 · $251/mo
- Expected delta
- $0/yr ($0/mo · 0.0%)
ⓘ Screening estimate from a state-policy table — verify with the county assessor before closing.
Climate risk First Street
- Flood 5/10 Major FEMA zone AE · 47% chance over 30 yrs
- Wildfire 3/10 Moderate
- Heat 9/10 Extreme 7 d/yr ≥109°F today · 23 d/yr by 30 yrs out
- Wind 9/10 Extreme 99% chance of damaging wind over 30 yrs
- Air quality 2/10 Low 1 unhealthy d/yr today · 1 by 30 yrs out
Nearby sold comps map
Loading sold comps map…
Walkable amenities ~0.75 mi
Loading nearby amenities…
Taxation est. · year 1
- Rental income
- $54,000
- − Mortgage interest
- −$23,129
- − Property taxes
- −$3,017
- − Insurance
- −$7,183
- − Repairs & maintenance
- −$4,320
- − Management
- −$4,320
- − Depreciation
- −$12,012
- Taxable income
- $20
- Est. tax owed @ 24.0%
- −$5
- After-tax cash flow
- $6,472/yr
For passive investors: Depreciation is non-cash, so a rental often shows a tax loss while cash-flowing — sheltering income. Rental losses are passive: they offset passive income freely, and up to $25,000/yr can offset ordinary (W-2) income if you actively participate and your MAGI is under $100k (phasing out to $0 by $150k); unused losses carry forward. On sale, claimed depreciation is recaptured at up to 25%, and gains may owe capital-gains tax (a 1031 exchange can defer both). Figures are a year-1 estimate at your 24.0% rate — not tax advice; consult a CPA.
Schools (NCES district)
- District
- Calcasieu Parish
- NCES district ID
- 2200330
- Math proficiency
- 30% ▼ -39.00%
- Reading proficiency
- 44% ▼ -33.00%
- Median HH income
- $44,700
- Composite
- 31.45/100
- National rank
- #5979
- State rank
- #29 of 98 in LA
Livability — Carlyss
- Score
- 61/100
- State rank
- #237
- US rank
- #18031
Category grades
Schools grade is shown separately in the Schools card above.
Census & demographics
- Population (ZIP)
- 12,891
Population outlook (Calcasieu County) Hauer SSP2
- Today (2025)
- 212,179 people
- By 2030
- 218,199 · +2.8%
- By 2040
- 228,486 · +7.7%
- By 2050
- 236,208 · +11.3%
- By 2075
- 251,696 · +18.6%
- By 2100
- 247,848 · +16.8%
Race, ethnicity, and origin ACS 2023
- Neighborhood character
- Predominantly White (87%)
- Race & ethnicity
- White 87% Hispanic / Latino 6% Two or more races 4% Black 3%
- Hispanic origin (detail)
- Mexican 4%
- Common ancestry
- Lithuanian 8% Italian 3% Slovak 2%
- Foreign-born
- 3% · Canada
- Languages at home
- 92% English-only · Spanish 6% French/Haitian/Cajun 1% Other Indo-European 1%
Political lean MEDSL · Calcasieu
- 2024 margin
- Solid R (+39.6) · D 29.5% · R 69.0% · Other 1.5%
- 2008→2024 swing
- -15.0pp toward R · 2008: -24.6pp · 2024: -39.6pp
- All cycles
- 2024: R+39.6 2020: R+35.2 2016: R+33.3 2012: R+28.7 2008: R+24.6
Not yet ingested
- Civics
- —
Market trends
- HPI YoY
- ▼ -91.65%
- Current HPI
- 99.2379
- Rent YoY
- —
- Metro
- —
- State GDP YoY
- ▲ 3.29%
- F500 in state
- 10
Industry mix (Fortune 500 HQ in LA)
| Industry | F500 HQs | Revenue |
|---|---|---|
| Telecommunications | 2 | $23B |
|
||
| Utilities | 1 | $12B |
|
||
| Wholesale / Distribution | 1 | $5B |
|
||
| Advertising | 1 | $2B |
|
||
Price history
+47.7% since first listed3 events — show timeline
- 2026-05-20 Pending — SWLAR
- 2026-05-18 Listed $412,900 SWLAR
- 2014-06-20 Sold (Public Records) $279,500 Public Records
Property tax history
+19.0%/yrLatest (2025): $3,017 · +1.2% YoY. Source: county tax records.
Cash-flow waterfall
monthlySold comps — $/sqft
last 12 mo · ≤1 miLoading sold comps…