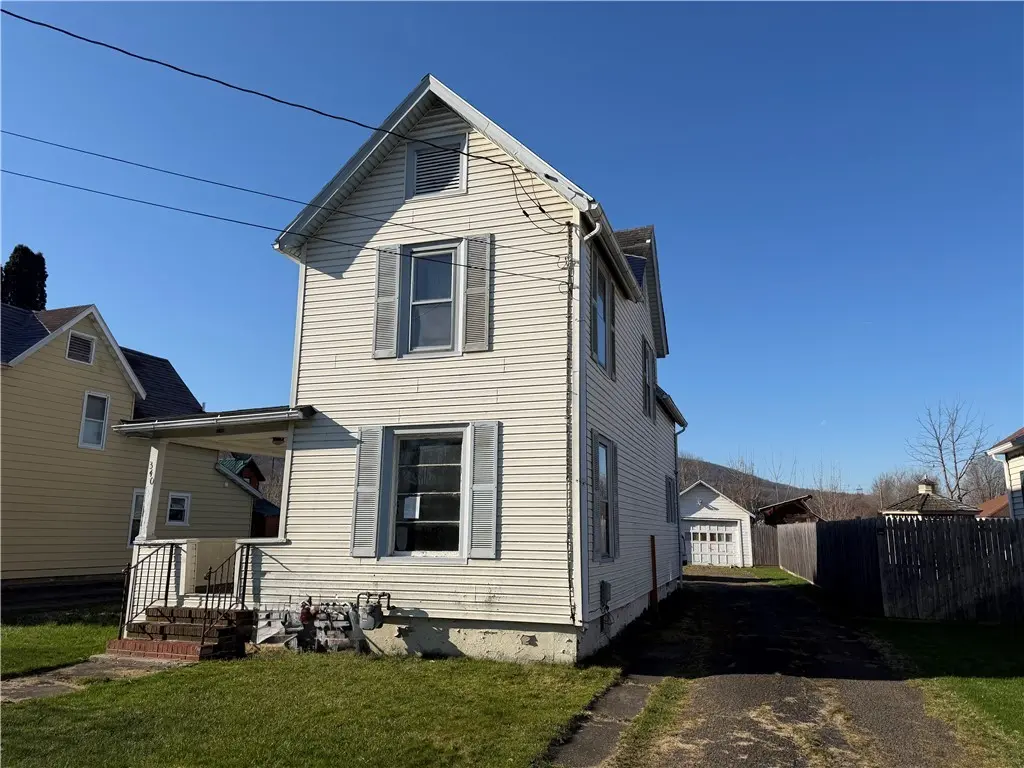
340 E High St · Painted Post, NY
Flood risk 1/10 · Minimal
- FEMA flood zone
- X (shaded)
- Chance of flooding over 30 yrs
- 0.0%
- Est. flood insurance / yr
- $473 – $860
Fire risk 3/10 · Minor
- Est. fire insurance / yr
- $691 – $1,283
Heat risk 3/10 · Minor
- Hot days now (above 95°F)
- 8 days/yr
- Hot days in 30 yrs
- 17 days/yr
Wind risk 1/10 · Minimal
- Chance of severe wind over 30 yrs
- —
Air-quality risk 1/10 · Minimal
- Unhealthy air days now
- 0 days/yr
- Unhealthy air days in 30 yrs
- 0 days/yr
Risk factors via First Street. Map © Google.
Why this score? — see what drove the B grade
The composite is a weighted blend of 9 inputs, each scored 0–100. Each bar is that input's sub-score; the figure is the points it added to the 100-point composite (weight × sub-score).
- Cash flow +30.0/30.0
- 1% rule +10.0/10.0
- DSCR +10.0/10.0
- ARV discount +7.5/15.0
- Schools +4.2/10.0
- Livability +3.8/5.0
- Condition / age +2.5/5.0
- Rent growth +2.2/5.0
- Appreciation +0.0/10.0
$48,900
🖨 Deal sheet 📄 Offer letter ✓ Due diligence
Listing remarks MLS
Opportunity awaits with this 3-bedroom, 2-bath home located right in the heart of Painted Post. Offering a spacious layout, this property features a rare double living room, perfect for entertaining or creating separate living spaces, along with a formal dining room ideal for gatherings and holiday meals. The home also includes a 2-car garage, providing ample storage and convenience. With solid bones and plenty of character, this property is ready for your vision and updates. Being sold as-is, this is a fantastic chance for investors, flippers, or buyers looking to build equity and make it their own.
Key facts
- 7,000 sq ft lot
- 2 garage spots
- Built 1900
Neighborhood map
What this means for you Summary
Snapshot
- This is a 3-bed/2.0-bath single-family listed at $49k.
Deal economics
- At list price, monthly cash flow is $901 ($11k/yr) — positive.
- The deal already cash-flows at list — no discount required.
- Meets the 1% rule at list price ($2k rent vs $49k).
- Recommended offer: $47k (3.0% below list) — sets the bar for market timing.
Location & tenants
- Location reads 75/100 on livability (#255 in NY, #4,036 nationally) — a middle-class / working-renter tenant base. Strengths: crime A+, housing A+, health & safety A+; Watch: amenities D-, commute F.
- Corning City School District (town): math 44% / reading 53% proficiency, ranked #406 of 590 in NY (top 69%) — families likely to look elsewhere, expect single-tenant / working-renter base with shorter leases.
- Market conditions: Rents soft (-1.4%/yr); 44 active listings in the ZIP; 7 comparable units currently listed for rent nearby; rentals lingering (median 44d on market — plan ~5-8 weeks vacancy on turnover, expect pricing pressure); 100% of comp listings sitting > 30 days — soft ceiling on asking rent; solid renter incomes; 196 units permitted in Steuben County in 2024 (0 in 5+ unit buildings).
Forward outlook
- Local home prices are declining (-3.0%/yr); year-one equity from $338 of loan paydown is wiped out by about $1k of value loss. Plan a longer hold.
- Steuben County population projected at -20% by 2050 — secular population decline; favor cash flow + early exit over multi-decade hold.
- At projected returns (-3.0% appreciation + 0.0% rent growth), your $14k cash investment doubles in ~2 years — after that, you're playing with house money.
Negotiation context
- It's been on market 52 days — a 3% lower offer ($47k) is reasonable based on typical stale-listing flexibility.
- 2 sale attempts with the ask held roughly flat each time — persistent listings suggest the price (not the market) is what's stuck; bring a comps-based counter.
Risks & watch-outs
- Watch-outs: built in 1900 — expect roof / HVAC / electrical / plumbing capex.
Questions for the listing agent
- It's been on market 52 days. Have you received any prior offers? Is the seller open to a 3% concession, seller financing, or rate buy-down credit?
- Built in 1900 — when were the roof, HVAC, electrical panel, plumbing, and water heater last replaced?
- Is there a deadline driving the sale (1031 exchange, divorce, estate, relocation)? That informs how much negotiation room exists.
- What's the average days-on-market for RENTAL listings here right now (not sales)? A rising rental-DOM trend means longer vacancies and softer asking-rent achievability than the comps imply.
- What's the recent tenant-quality profile in this submarket — average credit score on applications, eviction rate, late-payment / NSF rate, and stable-employment percentage? A property-management company in the area should have these aggregated.
- How much new for-sale + rental construction is in the pipeline within 1–3 miles? Heavy new supply typically softens prices + rents 12–24 months out; constrained supply supports both.
Investment metrics
- 1% rule
- 3.21% ✓
- Cap rate
- 28.40%
- Cash-on-cash
- 78.94%
- DSCR
- 4.51
- GRM
- 2.6
CMA / ARV
- ARV (median comp)
- $168,392
- List price
- $48,900
- Delta
- -70.96%
- Verdict
- UNDERPRICED
- Comps
- 20 within 1.0 mi
Show comp detail 12 sales within ~0.75 mi
| Address | Dist | Beds/Ba | Sqft | Sold | Price | $/sf | Match |
|---|---|---|---|---|---|---|---|
| 350 E High St | 0.02mi | 3/1.0 | 1,396 (+7%) | 3mo | $100,000 | $72 | 82 |
| 36 Clark St | 0.30mi | 4/1.0 (+1) | 1,272 (-3%) | 7mo | $143,617 | $113 | 67 |
| 10237 Oakwood Dr | 0.55mi | 3/1.5 | 1,348 (+3%) | 2mo | $155,000 | $115 | 66 |
| 385 Imperial Ave | 0.27mi | 3/1.0 | 1,170 (-11%) | 1mo | $150,000 | $128 | 65 |
| 10282 Rand St | 0.34mi | 4/1.0 (+1) | 1,312 (+0%) | 14mo | $103,000 | $79 | 63 |
| 209 Fuller Ave | 0.62mi | 3/2.0 | 1,326 (+1%) | 9mo | $180,000 | $136 | 61 |
| 26 Balcom Ave | 0.51mi | 4/1.5 (+1) | 1,326 (+1%) | 8mo | $118,000 | $89 | 60 |
| 367 Olive St | 0.29mi | 3/1.5 | 1,111 (-15%) | 6mo | $58,000 | $52 | 55 |
| 82 Riverside Cir | 0.31mi | 2/1.0 (-1) | 1,124 (-14%) | 3mo | $140,000 | $125 | 50 |
| 564 Freeman St | 0.42mi | 3/1.0 | 1,434 (+10%) | 14mo | $173,630 | $121 | 49 |
| 165 Dwight Ave | 0.69mi | 2/1.0 (-1) | 1,296 (-1%) | 10mo | $193,000 | $149 | 49 |
| 301 Cayuta St | 0.70mi | 2/2.0 (-1) | 1,245 (-5%) | 9mo | $174,900 | $140 | 47 |
Match score weights: distance 35% · size 25% · config 20% · recency 20%. Top-matched comps best support the ARV.
Projected returns pro-forma
-3.0% appreciation · 0.0% rent growth · sell at horizon
- IRR
- 75.6%
- Equity multiple
- 4.28×
- Total profit
- $44,870
- Equity at exit
- $7,291
- IRR
- 78.5%
- Equity multiple
- 7.96×
- Total profit
- $95,277
- Equity at exit
- $4,228
Cash invested: $13,692 (down + closing). Projections, not guarantees.
Landlord ↔ Tenant lean methodology
- Overall (STATE)
- 15 Strongly Tenant-Friendly
- State New York
- 15 Strongly Tenant-Friendly · D+10
- County
- — inherits STATE
- City
- — inherits STATE
ZIP-level market 14870
- Home prices YoY
- -28.8%
- Rents YoY
- -1.4%
- Active inventory
- 44
- Price-to-rent
- 2.6×
Monthly cashflow live
- Estimated rent
- $1,568 high interval (Pro) →
- Mortgage (P&I)
- −$256
- Tax est. 1.5%
- −$61 /mo · $734/yr
- Insurance
- −$20
- HOA
- −$0
- Vacancy / Maint / Mgmt
- −$329
- Net cashflow
- $901
Break-even live
UW: 25.0% down · 7.5% · 30yr · 1.5% tax · 5.0% vac · 8.0% maint · 8.0% mgmt
Financing live
Cash to close
- Down payment
- $12,225
- Closing costs
- $1,467
- Reserves months
- —
- Total cash needed
- —
Loan-product check · same deal, 3 products live
Conventional
25% down · 7.5% · 30yr
- Down + closing
- —
- Monthly P&I
- —
- Monthly cashflow
- —
- DSCR
- —
- Eligible?
- —
Personal DTI + credit; lowest rate.
DSCR
20% down · 8.5% · 30yr
- Down + closing
- —
- Monthly P&I
- —
- Monthly cashflow
- —
- DSCR
- —
- Eligible?
- —
No personal income docs; deal must DSCR.
Hard money
10% down · 12.0% · 12mo
- Down + closing
- —
- Monthly P&I
- —
- Monthly cashflow
- —
- DSCR
- —
- Eligible?
- —
Short-term bridge; refi at stabilization.
Rent comps 7 comps
| Address | Beds | Baths | Sqft | Rent | $/sqft | DOM | Units | Dist |
|---|---|---|---|---|---|---|---|---|
| 122 W High St Unit 201 Painted Post, NY | 2.0 | 1.0 | 1000 | $1,150 | $1.15 | 44d | 1 | 0.35mi |
| 402 W High St Painted Post, NY | 3.0 | 1.0 | 1000 | $1,375 | $1.38 | 44d | 1 | 0.58mi |
| 459 Brainard Pl Painted Post, NY | 3.0 | 1.0 | 1090 | $1,500 | $1.38 | 44d | 1 | 0.70mi |
| 209 Oneida Pl Corning, NY | 3.0 | 1.5 | 1200 | $2,000 | $1.67 | 44d | 1 | 0.79mi |
| 247 Princeton Ave Corning, NY | 3.0 | 1.0 | 1504 | $1,500 | $1.00 | 44d | 1 | 0.99mi |
| 137 Field St Corning, NY | 2.0–3.0 | 1.0 | 1125 | $1,345 | $1.20 | 44d | 3 | 1.07mi |
| 12 Pondview Ct Painted Post, NY | 3.0 | 1.0–2.0 | 948 | $1,890 | $1.99 | 44d | 27 | 1.37mi |
Listing history 9 events
-
2026-05-30statusdays on market $48,900 Pending 52 DOM
-
2026-05-19historical Active Under Contract 607-char remark
Show marketing remark (607 chars)
Opportunity awaits with this 3-bedroom, 2-bath home located right in the heart of Painted Post. Offering a spacious layout, this property features a rare double living room, perfect for entertaining or creating separate living spaces, along with a formal dining room ideal for gatherings and holiday meals. The home also includes a 2-car garage, providing ample storage and convenience. With solid bones and plenty of character, this property is ready for your vision and updates. Being sold as-is, this is a fantastic chance for investors, flippers, or buyers looking to build equity and make it their own.
-
2026-04-08$48,900 Active 607-char remark
Show marketing remark (607 chars)
Opportunity awaits with this 3-bedroom, 2-bath home located right in the heart of Painted Post. Offering a spacious layout, this property features a rare double living room, perfect for entertaining or creating separate living spaces, along with a formal dining room ideal for gatherings and holiday meals. The home also includes a 2-car garage, providing ample storage and convenience. With solid bones and plenty of character, this property is ready for your vision and updates. Being sold as-is, this is a fantastic chance for investors, flippers, or buyers looking to build equity and make it their own.
-
2026-03-31historical
-
2026-03-13price $53,900
-
2025-12-17price $58,900
-
2025-10-06$64,900 Active
-
2002-07-31soldstatus $55,000
-
2002-07-31soldstatus $69,900
ⓘ Source: listings_history table (triggers on properties + properties_extension) + one-shot
backfill from property_details.listing_events for pre-trigger history.
Climate risk First Street
- Flood 1/10 Low FEMA zone X (shaded) · 0% chance over 30 yrs
- Wildfire 3/10 Moderate
- Heat 3/10 Moderate 8 d/yr ≥95°F today · 17 d/yr by 30 yrs out
- Wind 1/10 Low
- Air quality 1/10 Low 0 unhealthy d/yr today · 0 by 30 yrs out
Nearby sold comps map
Loading sold comps map…
Walkable amenities ~0.75 mi
Loading nearby amenities…
Taxation est. · year 1
- Rental income
- $18,814
- − Mortgage interest
- −$2,739
- − Property taxes
- −$734
- − Insurance
- −$244
- − Repairs & maintenance
- −$1,505
- − Management
- −$1,505
- − Depreciation
- −$1,423
- Taxable income
- $10,664
- Est. tax owed @ 24.0%
- −$2,559
- After-tax cash flow
- $8,249/yr
For passive investors: Depreciation is non-cash, so a rental often shows a tax loss while cash-flowing — sheltering income. Rental losses are passive: they offset passive income freely, and up to $25,000/yr can offset ordinary (W-2) income if you actively participate and your MAGI is under $100k (phasing out to $0 by $150k); unused losses carry forward. On sale, claimed depreciation is recaptured at up to 25%, and gains may owe capital-gains tax (a 1031 exchange can defer both). Figures are a year-1 estimate at your 24.0% rate — not tax advice; consult a CPA.
Schools (NCES district)
- District
- Corning City School District
- NCES district ID
- 3608400
- Math proficiency
- 44% ▼ -12.00%
- Reading proficiency
- 53% ▲ 4.00%
- Median HH income
- $53,042
- Composite
- 41.8/100
- National rank
- #3392
- State rank
- #406 of 590 in NY
Livability — Painted Post
- Score
- 75/100
- State rank
- #255
- US rank
- #4036
Category grades
Schools grade is shown separately in the Schools card above.
Census & demographics
- Census place
- Painted Post, NY
- County
- Steuben County · 41,193 people
- City population
- 9,795
- Metro
- Corning, NY
- Population (ZIP)
- 9,795
- Household income
- $84,476
- Rent vs Own
- Severe rent burden
- 289.0
Population outlook (Steuben County) Hauer SSP2
- Today (2025)
- 93,062 people
- By 2030
- 89,793 · -3.5%
- By 2040
- 82,353 · -11.5%
- By 2050
- 74,286 · -20.2%
- By 2075
- 55,589 · -40.3%
- By 2100
- 37,587 · -59.6%
Race, ethnicity, and origin ACS 2023
- Neighborhood character
- Predominantly White (84%)
- Race & ethnicity
- White 84% Asian 8% Two or more races 5% Black 2% Hispanic / Latino 2%
- Common ancestry
- Romanian 7% Italian 3% Slovak 2%
- Foreign-born
- 8% · China, South Korea, Canada
- Languages at home
- 90% English-only · Chinese 4% Other Indo-European 2% Korean 1%
Political lean MEDSL · Steuben
- 2024 margin
- Solid R (+31.8) · D 34.1% · R 65.9%
- 2008→2024 swing
- -15.0pp toward R · 2008: -16.8pp · 2024: -31.8pp
- All cycles
- 2024: R+31.8 2020: R+29.6 2016: R+36.2 2012: R+16.4 2008: R+16.8
Not yet ingested
- Civics
- —
Market trends
- HPI YoY
- ▼ -70.45%
- Current HPI
- 174.2287
- Rent YoY
- ▼ -1.35%
- Metro
- Corning, NY
- State GDP YoY
- ▲ 2.60%
- F500 in state
- 92
Industry mix (Fortune 500 HQ in NY)
| Industry | F500 HQs | Revenue |
|---|---|---|
| Financial Services | 10 | $950B |
|
||
| Consumer Goods | 9 | $162B |
|
||
| Insurance | 4 | $225B |
|
||
| Telecommunications | 2 | $144B |
|
||
| Pharmaceuticals | 2 | $112B |
|
||
| Media / Entertainment | 2 | $69B |
|
||
Price history
-11.1% since first listed8 events — show timeline
- 2026-05-19 Contingent — UNYREIS
- 2026-04-08 Listed $48,900 UNYREIS
- 2026-03-31 Listing Removed — UNYREIS
- 2026-03-13 Price Changed $53,900 UNYREIS
- 2025-12-17 Price Changed $58,900 UNYREIS
- 2025-10-06 Listed $64,900 UNYREIS
- 2002-07-31 Sold (Public Records) $69,900 Public Records
- 2002-07-31 Sold (Public Records) $55,000 Public Records
Property tax history
+4.1%/yrLatest (2025): $4,265 · +3.6% YoY. Source: county tax records.
Cash-flow waterfall
monthlySold comps — $/sqft
last 12 mo · ≤1 miLoading sold comps…