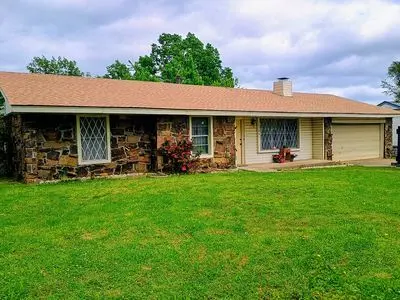
1406 W Clint St · Claremore, OK
Flood risk 1/10 · Minimal
- FEMA flood zone
- X (unshaded)
- Chance of flooding over 30 yrs
- 0.0%
- Est. flood insurance / yr
- $507 – $1,088
Fire risk 4/10 · Minor
- Est. fire insurance / yr
- $2,463 – $4,575
Heat risk 7/10 · Major
- Hot days now (above 110°F)
- 7 days/yr
- Hot days in 30 yrs
- 19 days/yr
Wind risk 2/10 · Minimal
- Chance of severe wind over 30 yrs
- 3.0%
Air-quality risk 2/10 · Minimal
- Unhealthy air days now
- 1 days/yr
- Unhealthy air days in 30 yrs
- 1 days/yr
Risk factors via First Street. Map © Google.
Why this score? — see what drove the D grade
The composite is a weighted blend of 9 inputs, each scored 0–100. Each bar is that input's sub-score; the figure is the points it added to the 100-point composite (weight × sub-score).
- Cash flow +15.5/30.0
- ARV discount +9.5/15.0
- DSCR +4.8/10.0
- Livability +3.7/5.0
- Rent growth +3.2/5.0
- 1% rule +3.1/10.0
- Condition / age +2.5/5.0
- Schools +2.1/10.0
- Appreciation +0.0/10.0
$160,000
🖨 Deal sheet (PDF) 📄 Offer letter ✓ Due diligence
Listing remarks MLS
HUD #422-236408 Nice Claremore starter home. Features large rooms, fireplace, covered patio and large fenced yard. Brick and vinyl exterior w/ 2 car garage in quiet neighborhood, close to shopping and easy highway access. Sold AS-IS, needs some repairs.
Key facts
- Hvac replaced
- New breaker box
- New hot water heater
Tags
Neighborhood map
What this means for you Summary
Snapshot
- This is a 3-bed/1.0-bath single-family listed at $160k.
Deal economics
- At list price, monthly cash flow is $66 ($791/yr) — positive.
- The deal already cash-flows at list — no discount required.
- To meet the 1% rule (rent ≥ 1% of price), the offer needs to be $130k (18.9% below list).
- Recommended offer: $130k (18.9% below list) — sets the bar for 1% rule.
- Cap rate 6.8% vs local median 4.1% in Claremore — top-decile yield for the area; either an underpriced asset or a hidden risk that comps aren't pricing in. Stress-test before assuming the spread holds.
Location & tenants
- Location reads 73/100 on livability (#20 in OK) — a middle-class / working-renter tenant base. Strengths: cost of living A+, housing A+, health & safety A; Watch: amenities F, commute F, employment D-.
- Claremore (town): math 24% / reading 25% proficiency, ranked #111 of 270 in OK (top 41%) — low school quality limits family demand, transient renter base, plan for 1-2y turnover.
- Zoned schools: Westside Es (math 22% / reading 22%, grade F, #413 of 845 statewide, top 54%, 557 students, 0% FRL); Will Rogers Jhs (math 20% / reading 23%, grade F, #146 of 345 statewide, top 43%, 807 students, 0% FRL); Claremore Hs (math 22% / reading 35%, grade F, #121 of 447 statewide, top 27%, 1,285 students, 0% FRL) — zoned schools average 0% FRL vs 48% district-wide (48 pts lower); this property's tenant base skews higher-income than the district average.
- Market conditions: Rents rising (+2.6%/yr); 184 active listings in the ZIP; 14 comparable units currently listed for rent nearby; rentals leasing fast (median 13d on market — plan ~1-2 weeks tenant-placement turnaround); 608 units permitted in Rogers County in 2024 (7 in 5+ unit buildings).
Forward outlook
- Local home prices are declining (-3.0%/yr); year-one equity from $1k of loan paydown is wiped out by about $5k of value loss. Plan a longer hold.
- Rogers County population projected at +16% by 2050 — long-run rental-demand tailwind backs the buy-and-hold thesis.
Negotiation context
- It's been on market 31 days — a 3% lower offer ($155k) is reasonable based on typical stale-listing flexibility.
- 4 sale attempts since 27y ago with the ask held roughly flat each time — persistent listings suggest the price (not the market) is what's stuck; bring a comps-based counter.
- Current owner paid $68k; list at $160k implies a 135% gain — meaningful room to come down on a strong offer.
Risks & watch-outs
- Climate carrying-cost: extreme-heat days projected 7→19/yr by 2055 (HVAC capex compounding) — expect insurance premiums to compound above CPI over the hold.
Questions for the listing agent
- It's been on market 31 days. Have you received any prior offers? Is the seller open to a 19% concession, seller financing, or rate buy-down credit?
- Built in 1975 — when were the roof, HVAC, electrical panel, plumbing, and water heater last replaced?
- Is there a deadline driving the sale (1031 exchange, divorce, estate, relocation)? That informs how much negotiation room exists.
- Schools are D-rated, which usually means shorter tenancies and higher turnover. Who's the typical renter profile here, and what's been the actual vacancy rate?
- The area grade is low — what's the realistic commute time and amenity access for the typical tenant pool here? Any planned neighborhood developments (good or bad) we should know about?
- What's the average days-on-market for RENTAL listings here right now (not sales)? A rising rental-DOM trend means longer vacancies and softer asking-rent achievability than the comps imply.
- What's the recent tenant-quality profile in this submarket — average credit score on applications, eviction rate, late-payment / NSF rate, and stable-employment percentage? A property-management company in the area should have these aggregated.
- How much new for-sale + rental construction is in the pipeline within 1–3 miles? Heavy new supply typically softens prices + rents 12–24 months out; constrained supply supports both.
Investment metrics
- 1% rule
- 0.81% ✗
- Cap rate
- 6.79%
- Cash-on-cash
- 1.77%
- DSCR
- 1.08
- GRM
- 10.3
CMA / ARV
- ARV (on-the-fly)
- $167,400
- Comps found
- 12
Show comp detail 12 sales within ~0.75 mi
| Address | Dist | Beds/Ba | Sqft | Sold | Price | $/sf | Match |
|---|---|---|---|---|---|---|---|
| 602 S Sunset Dr | 0.37mi | 3/1.5 | 1,098 (-2%) | 9mo | $185,000 | $168 | 70 |
| 946 S Reavis Rd | 0.47mi | 3/1.0 | 1,152 (+3%) | 3mo | $155,000 | $135 | 70 |
| 1230 W Dupont St | 0.41mi | 3/2.0 | 1,136 (+2%) | 6mo | $134,000 | $118 | 70 |
| 1804 W Sunset Dr | 0.38mi | 3/1.5 | 1,051 (-6%) | 10mo | $185,000 | $176 | 62 |
| 932 Cowell St | 0.57mi | 3/2.0 | 1,066 (-4%) | 13mo | $160,000 | $150 | 51 |
| 1206 W Haskell St | 0.53mi | 4/1.5 (+1) | 1,218 (+9%) | 3mo | $187,000 | $154 | 51 |
| 819 Cowell St | 0.68mi | 4/1.0 (+1) | 1,232 (+10%) | 4mo | $178,000 | $144 | 42 |
| 1307 W Doris St | 0.73mi | 3/2.0 | 1,224 (+10%) | 5mo | $105,000 | $86 | 42 |
| 752 S Muskogee Ave Unit A | 0.74mi | 3/1.5 | 984 (-12%) | 4mo | $174,900 | $178 | 41 |
| 908 Pecan Ln | 0.73mi | 2/1.0 (-1) | 1,200 (+8%) | 11mo | $117,000 | $98 | 39 |
| 2003 Charlestown Cir | 0.52mi | 3/2.0 | 1,281 (+15%) | 11mo | $180,000 | $141 | 38 |
| 1308 W Doris St | 0.73mi | 3/2.0 | 1,212 (+9%) | 12mo | $195,000 | $161 | 37 |
Match score weights: distance 35% · size 25% · config 20% · recency 20%. Top-matched comps best support the ARV.
Projected returns pro-forma
-3.0% appreciation · 2.62% rent growth · sell at horizon
- IRR
- -13.9%
- Equity multiple
- 0.50×
- Total profit
- $-22,294
- Equity at exit
- $23,857
- IRR
- -5.7%
- Equity multiple
- 0.64×
- Total profit
- $-16,307
- Equity at exit
- $13,834
Cash invested: $44,800 (down + closing). Projections, not guarantees.
Landlord ↔ Tenant lean methodology
- Overall (STATE)
- 83 Strongly Landlord-Friendly
- State Oklahoma
- 83 Strongly Landlord-Friendly · R+20
- County
- — inherits STATE
- City
- — inherits STATE
ZIP-level market 74017
- Home prices YoY
- -20.1%
- Rents YoY
- 2.6%
- Active inventory
- 184
- Price-to-rent
- 10.3×
Monthly cashflow live
- Estimated rent
- $1,298 high interval (Pro) →
- Mortgage (P&I)
- −$839
- Tax from tax record
- −$54 /mo · $642/yr
- Insurance
- −$67
- HOA
- −$0
- Vacancy / Maint / Mgmt
- −$273
- Net cashflow
- $66
Break-even live
Sensitivity live
| Price | -10% $156 | -5% $111 | +0% $66 | +5% $21 | +10% $-25 |
|---|---|---|---|---|---|
| Rent | -10% $-37 | -5% $15 | +0% $66 | +5% $117 | +10% $168 |
| Rate | -1.0pp $146 | -0.5pp $107 | base $66 | +0.5pp $24 | +1.0pp $-18 |
UW: 25.0% down · 7.5% · 30yr · 1.5% tax · 5.0% vac · 8.0% maint · 8.0% mgmt
Financing live
Cash to close
- Down payment
- $40,000
- Closing costs
- $4,800
- Reserves months
- —
- Total cash needed
- —
Loan-product check · same deal, 3 products live
Conventional
25% down · 7.5% · 30yr
- Down + closing
- —
- Monthly P&I
- —
- Monthly cashflow
- —
- DSCR
- —
- Eligible?
- —
Personal DTI + credit; lowest rate.
DSCR
20% down · 8.5% · 30yr
- Down + closing
- —
- Monthly P&I
- —
- Monthly cashflow
- —
- DSCR
- —
- Eligible?
- —
No personal income docs; deal must DSCR.
Hard money
10% down · 12.0% · 12mo
- Down + closing
- —
- Monthly P&I
- —
- Monthly cashflow
- —
- DSCR
- —
- Eligible?
- —
Short-term bridge; refi at stabilization.
Rent comps 14 comps
| Address | Beds | Baths | Sqft | Rent | $/sqft | DOM | Units | Dist |
|---|---|---|---|---|---|---|---|---|
| 1222 W Brooks St Unit A Claremore, OK | 2.0 | 1.0 | 850 | $1,275 | $1.50 | 0d | 1 | 0.44mi |
| 644 Earthside Dr Apt B Claremore, OK | 2.0 | 1.5 | 950 | $900 | $0.95 | 12d | 1 | 0.53mi |
| 2000 Hilltop Ln Claremore, OK | 2.0 | 1.5 | 972 | $1,000 | $1.03 | 0d | 1 | 0.56mi |
| 2808 Ridgeview Pl Unit A Claremore, OK | 3.0 | 2.0 | 1288 | $1,450 | $1.13 | 0d | 1 | 0.94mi |
| 2805 Trailwood Dr Unit B Claremore, OK | 3.0 | 2.0 | 1288 | $1,500 | $1.16 | 12d | 1 | 0.95mi |
| 2805 Trailwood Dr Unit A Claremore, OK | 3.0 | 2.0 | 1288 | $1,450 | $1.13 | 0d | 1 | 0.95mi |
| 317 E Will Rogers Blvd Claremore, OK | 2.0 | 2.0 | 996 | $1,475 | $1.48 | 12d | 1 | 1.12mi |
| 318 E Will Rogers Blvd Claremore, OK | 2.0 | 1.0 | 1028 | $1,300 | $1.26 | 12d | 1 | 1.14mi |
| 2001 S Cherokee Ave Claremore, OK | 3.0 | 2.0 | 1240 | $1,500 | $1.21 | 12d | 1 | 1.24mi |
| 22350 S 4150 Rd Apt H104 Claremore, OK | 2.0 | 1.0 | 821 | $1,025 | $1.25 | 0d | 1 | 1.33mi |
| 22350 S 4150 Rd Unit L 103 Claremore, OK | 2.0 | 1.0 | 821 | $875 | $1.07 | 12d | 1 | 1.33mi |
| 2000 Frederick Rd Claremore, OK | 1.0–2.0 | 1.0–2.0 | 762 | $1,055 | $1.38 | 0d | 1 | 1.34mi |
| 2090 S Lynn Riggs Blvd Claremore, OK | 1.0–2.0 | 1.0–2.0 | 662 | $1,019 | $1.54 | 25d | 1 | 1.46mi |
| 2090 S Lynn Riggs Blvd Unit 2090-46 Claremore, OK | 2.0 | 2.0 | 775 | $1,019 | $1.31 | 21d | 1 | 1.46mi |
Listing history 23 events
-
2026-06-16status $160,000 Under Contract 31 DOM
-
2026-06-15days on market $160,000 Active 31 DOM
-
2026-06-13days on market $160,000 Active 29 DOM
-
2026-06-10days on market $160,000 Active 26 DOM
-
2026-06-09days on market $160,000 Active 25 DOM
-
2026-06-08days on market $160,000 Active 24 DOM
-
2026-06-07days on market $160,000 Active 23 DOM
-
2026-06-05days on market $160,000 Active 20 DOM
-
2026-06-03days on market $160,000 Active 19 DOM
-
2026-06-02days on market $160,000 Active 18 DOM
-
2026-06-01days on market $160,000 Active 17 DOM
-
2026-05-31days on market $160,000 Active 16 DOM
-
2026-05-15$160,000 Active
-
2015-11-23soldstatus $68,000 Closed 253-char remark
Show marketing remark (253 chars)
HUD #422-236408 Nice Claremore starter home. Features large rooms, fireplace, covered patio and large fenced yard. Brick and vinyl exterior w/ 2 car garage in quiet neighborhood, close to shopping and easy highway access. Sold AS-IS, needs some repairs.
-
2015-10-15status Pending 253-char remark
Show marketing remark (253 chars)
HUD #422-236408 Nice Claremore starter home. Features large rooms, fireplace, covered patio and large fenced yard. Brick and vinyl exterior w/ 2 car garage in quiet neighborhood, close to shopping and easy highway access. Sold AS-IS, needs some repairs.
-
2015-10-14status Active 253-char remark
Show marketing remark (253 chars)
HUD #422-236408 Nice Claremore starter home. Features large rooms, fireplace, covered patio and large fenced yard. Brick and vinyl exterior w/ 2 car garage in quiet neighborhood, close to shopping and easy highway access. Sold AS-IS, needs some repairs.
-
2015-10-05status Pending 253-char remark
Show marketing remark (253 chars)
HUD #422-236408 Nice Claremore starter home. Features large rooms, fireplace, covered patio and large fenced yard. Brick and vinyl exterior w/ 2 car garage in quiet neighborhood, close to shopping and easy highway access. Sold AS-IS, needs some repairs.
-
2015-09-22$68,000 Active 253-char remark
Show marketing remark (253 chars)
HUD #422-236408 Nice Claremore starter home. Features large rooms, fireplace, covered patio and large fenced yard. Brick and vinyl exterior w/ 2 car garage in quiet neighborhood, close to shopping and easy highway access. Sold AS-IS, needs some repairs.
-
1999-08-19soldstatus $78,000 191-char remark
Show marketing remark (191 chars)
DEAD END STREET, NEUTRAL COLOR CARPET, APPLIANCES + ROOF 2 YRS OLD, LRGE COVERED PATIO, SMALL INSULATED WORKSHOP, LANDSCAPED. A DOLL HOUSE. CALL FOR APPT. -DUE TO DOG, EASY TO SHOW, NEW VINYL
-
1999-08-18soldstatus $78,000
-
1999-06-18historical 191-char remark
Show marketing remark (191 chars)
DEAD END STREET, NEUTRAL COLOR CARPET, APPLIANCES + ROOF 2 YRS OLD, LRGE COVERED PATIO, SMALL INSULATED WORKSHOP, LANDSCAPED. A DOLL HOUSE. CALL FOR APPT. -DUE TO DOG, EASY TO SHOW, NEW VINYL
-
1999-05-05$78,000 191-char remark
Show marketing remark (191 chars)
DEAD END STREET, NEUTRAL COLOR CARPET, APPLIANCES + ROOF 2 YRS OLD, LRGE COVERED PATIO, SMALL INSULATED WORKSHOP, LANDSCAPED. A DOLL HOUSE. CALL FOR APPT. -DUE TO DOG, EASY TO SHOW, NEW VINYL
-
1987-08-20soldstatus $49,000
ⓘ Source: listings_history table (triggers on properties + properties_extension) + one-shot
backfill from property_details.listing_events for pre-trigger history.
Tax reassessment forecast OK · Resets to sale price
- Current annual tax
- $642 · $54/mo
- Projected year-2 tax
- $1,440 · $120/mo
- Expected delta
- +$798/yr (+$66/mo · 124.3%)
ⓘ Screening estimate from a state-policy table — verify with the county assessor before closing.
Climate risk First Street
- Flood 1/10 Low FEMA zone X (unshaded) · 0% chance over 30 yrs
- Wildfire 4/10 Moderate
- Heat 7/10 Severe 7 d/yr ≥110°F today · 19 d/yr by 30 yrs out
- Wind 2/10 Low 3% chance of damaging wind over 30 yrs
- Air quality 2/10 Low 1 unhealthy d/yr today · 1 by 30 yrs out
Nearby sold comps map
Loading sold comps map…
Walkable amenities ~0.75 mi
Loading nearby amenities…
Taxation est. · year 1
- Rental income
- $15,572
- − Mortgage interest
- −$8,962
- − Property taxes
- −$642
- − Insurance
- −$800
- − Repairs & maintenance
- −$1,246
- − Management
- −$1,246
- − Depreciation
- −$4,655
- Taxable loss
- −$1,979
- Est. tax savings @ 24.0%
- +$475
- After-tax cash flow
- $1,266/yr
For passive investors: Depreciation is non-cash, so a rental often shows a tax loss while cash-flowing — sheltering income. Rental losses are passive: they offset passive income freely, and up to $25,000/yr can offset ordinary (W-2) income if you actively participate and your MAGI is under $100k (phasing out to $0 by $150k); unused losses carry forward. On sale, claimed depreciation is recaptured at up to 25%, and gains may owe capital-gains tax (a 1031 exchange can defer both). Figures are a year-1 estimate at your 24.0% rate — not tax advice; consult a CPA.
Schools (NCES district)
- District
- Claremore
- NCES district ID
- 4007740
- Math proficiency
- 24% ▼ -12.00%
- Reading proficiency
- 25% ▼ -11.00%
- Median HH income
- $44,946
- Composite
- 21.16/100
- National rank
- #8426
- State rank
- #111 of 270 in OK
Livability — Claremore
- Score
- 73/100
- State rank
- #20
- US rank
- #5616
Category grades
Schools grade is shown separately in the Schools card above.
Census & demographics
- Census place
- Claremore, OK
- County
- Rogers County · 50,229 people
- City population
- 50,229
- Metro
- Tulsa, OK
- Population (ZIP)
- 29,206
- Household income
- $65,368
- Rent vs Own
- Severe rent burden
- 603.0
Population outlook (Rogers County) Hauer SSP2
- Today (2025)
- 100,211 people
- By 2030
- 104,381 · +4.2%
- By 2040
- 111,567 · +11.3%
- By 2050
- 116,791 · +16.5%
- By 2075
- 129,134 · +28.9%
- By 2100
- 132,326 · +32.0%
Race, ethnicity, and origin ACS 2023
- Neighborhood character
- Diverse neighborhood (Simpson 0.55)
- Race & ethnicity
- White 67% Native American 15% Two or more races 12% Hispanic / Latino 7% Black 1%
- Hispanic origin (detail)
- Mexican 5%
- Common ancestry
- Slovak 2% Lithuanian 1% Portuguese 1%
- Foreign-born
- 3% · Canada
- Languages at home
- 94% English-only · Spanish 4%
Political lean MEDSL · Rogers
- 2024 margin
- Solid R (+55.0) · D 21.6% · R 76.6% · Other 1.7%
- 2008→2024 swing
- -10.9pp toward R · 2008: -44.1pp · 2024: -55.0pp
- All cycles
- 2024: R+55.0 2020: R+54.9 2016: R+56.3 2012: R+50.1 2008: R+44.1
Not yet ingested
- Civics
- —
Market trends
- HPI YoY
- ▼ -57.22%
- Current HPI
- 227.0657
- Rent YoY
- ▲ 2.62%
- Metro
- Tulsa, OK
- State GDP YoY
- ▲ 1.55%
- F500 in state
- 6
Industry mix (Fortune 500 HQ in OK)
| Industry | F500 HQs | Revenue |
|---|---|---|
| Energy | 3 | $48B |
|
||
Price history
+226.5% since first listed11 events — show timeline
- 2026-05-15 Listed $160,000 FSBO.com
- 2015-11-23 Sold (MLS) $68,000 MLS Technology, Inc.
- 2015-10-15 Pending — MLS Technology, Inc.
- 2015-10-14 Relisted — MLS Technology, Inc.
- 2015-10-05 Pending — MLS Technology, Inc.
- 2015-09-22 Listed $68,000 MLS Technology, Inc.
- 1999-08-19 Sold (MLS) $78,000 MLS Technology, Inc.
- 1999-08-18 Sold (Public Records) $78,000 Public Records
- 1999-06-18 Listing Removed — MLS Technology, Inc.
- 1999-05-05 Listed $78,000 MLS Technology, Inc.
- 1987-08-20 Sold (Public Records) $49,000 Public Records
Property tax history
-0.7%/yrLatest (2025): $642 · -9.7% YoY. Source: county tax records.
Cash-flow waterfall
monthlySold comps — $/sqft
last 12 mo · ≤1 miLoading sold comps…