 🏗️ New Construction
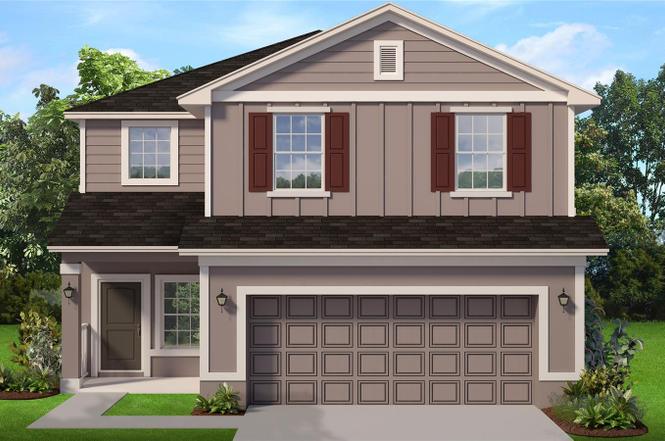
3619 Briarlynne Way · St. Cloud, FL
Flood risk No data
- FEMA flood zone
- —
- Chance of flooding over 30 yrs
- —
- Est. flood insurance / yr
- —
Fire risk No data
- Est. fire insurance / yr
- —
Heat risk No data
- Hot days now (above threshold)
- —
- Hot days in 30 yrs
- —
Wind risk No data
- Chance of severe wind over 30 yrs
- —
Air-quality risk No data
- Unhealthy air days now
- —
- Unhealthy air days in 30 yrs
- —
Risk factors via First Street. Map © Google.
Why this score? — see what drove the F grade
The composite is a weighted blend of 9 inputs, each scored 0–100. Each bar is that input's sub-score; the figure is the points it added to the 100-point composite (weight × sub-score).
- ARV discount +7.5/15.0
- Cash flow +5.1/30.0
- Appreciation +4.8/10.0
- Schools +3.6/10.0
- Rent growth +2.9/5.0
- Livability +2.5/5.0
- Condition / age +2.5/5.0
- 1% rule +1.0/10.0
- DSCR +0.0/10.0
$439,900
🖨 Deal sheet (PDF) 📄 Offer letter ✓ Due diligence
Listing remarks
Under contract-accepting backup offers. Under Construction. More Space, More Savings, and a Lifestyle You’ll Love in Harmony Central, Imagine coming home to a place where space, comfort, and value all come together. This beautiful 4-bedroom, 2.5-bath home with a spacious second-floor loft offers the room you need today and the flexibility you’ll appreciate for years to come. Buyers can take advantage of $10,000 in Flex Cash, plus closing costs paid when using the preferred lender, helping you save thousands at closing and over the life of the loan. Designed with both entertaining and everyday living in mind, the open floor plan creates a natural flow throughout the home. The hea
Key facts
- Large center island
- Staggered cabinets
- Open living concept
Tags
Neighborhood map
What this means for you Summary
Snapshot
- This is a 4-bed/2.5-bath land listed at $440k.
Deal economics
- At list price, monthly cash flow is $-1k ($-12k/yr) — negative.
- To cash-flow at today's rent, offer at most $294k (33.2% below list).
- To meet the 1% rule (rent ≥ 1% of price), the offer needs to be $266k (39.6% below list).
- Recommended offer: $266k (39.6% below list) — sets the bar for 1% rule.
Location & tenants
- Location reads: area grade F — affects rentability + tenant quality, not the cash-flow math above.
- Osceola (suburban): math 39% / reading 45% proficiency, ranked #60 of 73 in FL (top 82%) — families likely to look elsewhere, expect single-tenant / working-renter base with shorter leases; 60% free/reduced lunch — lower-income household profile, screen leases tightly.
- Zoned schools: Harmony Community School (math 70% / reading 64%, grade B+, #450 of 2,144 statewide, top 22%, 1,012 students, 38% FRL); Harmony High School (math 40% / reading 46%, grade F, #255 of 667 statewide, top 39%, 2,822 students, 42% FRL) — zoned schools average 40% FRL vs 60% district-wide (20 pts lower); this property's tenant base skews higher-income than the district average.
- Zoned-school proficiency averages 55% at this address vs 42% district-wide (+13 pts) — the actual schools serving this property are materially stronger than the Osceola average implies; a family-tenant draw the district grade alone would hide.
- Market conditions: Rents rising (+1.8%/yr); 387 active listings in the ZIP; 12 comparable units currently listed for rent nearby; rentals at typical pace (median 25d on market — plan ~3-4 weeks tenant-placement turnaround); solid renter incomes; 8,813 units permitted in Osceola County in 2024 (3,072 in 5+ unit buildings).
- This rent runs 40% of the median local income ($81k/yr) — at the standard rent-burdened threshold; future hikes will face affordability resistance.
Forward outlook
- In year one you build about $988 of equity ($3k loan paydown + $-2k appreciation (-0.5% local appreciation)).
- Osceola County population projected at +73% by 2050 — long-run rental-demand tailwind backs the buy-and-hold thesis.
Negotiation context
- It's been on market 46 days — a 3% lower offer ($427k) is reasonable based on typical stale-listing flexibility.
Questions for the listing agent
- What do current leases actually rent for vs. the listed asking? Can we see a recent rent roll and the last 12 months of T-12 income?
- It's been on market 46 days. Have you received any prior offers? Is the seller open to a 40% concession, seller financing, or rate buy-down credit?
- What does the HOA fee cover, when was the last increase, and are there any pending special assessments or reserve-fund shortfalls?
- Is there a deadline driving the sale (1031 exchange, divorce, estate, relocation)? That informs how much negotiation room exists.
- The area grade is low — what's the realistic commute time and amenity access for the typical tenant pool here? Any planned neighborhood developments (good or bad) we should know about?
- What's the average days-on-market for RENTAL listings here right now (not sales)? A rising rental-DOM trend means longer vacancies and softer asking-rent achievability than the comps imply.
- What's the recent tenant-quality profile in this submarket — average credit score on applications, eviction rate, late-payment / NSF rate, and stable-employment percentage? A property-management company in the area should have these aggregated.
- How much new for-sale + rental construction is in the pipeline within 1–3 miles? Heavy new supply typically softens prices + rents 12–24 months out; constrained supply supports both.
Investment metrics
- 1% rule
- 0.60% ✗
- Cap rate
- 3.54%
- Cash-on-cash
- -9.83%
- DSCR
- 0.56
- GRM
- 13.8
CMA / ARV
No comps found within radius.
Projected returns pro-forma
-0.47% appreciation · 1.79% rent growth · sell at horizon
- IRR
- -16.5%
- Equity multiple
- 0.27×
- Total profit
- $-89,807
- Equity at exit
- $117,566
- IRR
- -10.8%
- Equity multiple
- -0.03×
- Total profit
- $-126,285
- Equity at exit
- $133,442
Cash invested: $123,172 (down + closing). Projections, not guarantees.
Landlord ↔ Tenant lean methodology
- Overall (STATE)
- 87 Strongly Landlord-Friendly
- State Florida
- 87 Strongly Landlord-Friendly · R+3
- County
- — inherits STATE
- City
- — inherits STATE
ZIP-level market 34773
- Home prices YoY
- -0.2%
- Rents YoY
- 1.8%
- Active inventory
- 387
- Price-to-rent
- 13.8×
Monthly cashflow live
- Estimated rent
- $2,657 high interval (Pro) →
- Mortgage (P&I)
- −$2,307
- Tax est. 1.5%
- −$550 /mo · $6,598/yr
- Insurance
- −$183
- HOA
- −$68
- Vacancy / Maint / Mgmt
- −$558
- Net cashflow
- $-1,009
Break-even live
Sensitivity live
| Price | -10% $-705 | -5% $-857 | +0% $-1,009 | +5% $-1,161 | +10% $-1,313 |
|---|---|---|---|---|---|
| Rent | -10% $-1,219 | -5% $-1,114 | +0% $-1,009 | +5% $-904 | +10% $-799 |
| Rate | -1.0pp $-788 | -0.5pp $-897 | base $-1,009 | +0.5pp $-1,123 | +1.0pp $-1,239 |
UW: 25.0% down · 7.5% · 30yr · 1.5% tax · 5.0% vac · 8.0% maint · 8.0% mgmt
Financing live
Cash to close
- Down payment
- $109,975
- Closing costs
- $13,197
- Reserves months
- —
- Total cash needed
- —
Loan-product check · same deal, 3 products live
Conventional
25% down · 7.5% · 30yr
- Down + closing
- —
- Monthly P&I
- —
- Monthly cashflow
- —
- DSCR
- —
- Eligible?
- —
Personal DTI + credit; lowest rate.
DSCR
20% down · 8.5% · 30yr
- Down + closing
- —
- Monthly P&I
- —
- Monthly cashflow
- —
- DSCR
- —
- Eligible?
- —
No personal income docs; deal must DSCR.
Hard money
10% down · 12.0% · 12mo
- Down + closing
- —
- Monthly P&I
- —
- Monthly cashflow
- —
- DSCR
- —
- Eligible?
- —
Short-term bridge; refi at stabilization.
Rent comps 12 comps
| Address | Beds | Baths | Sqft | Rent | $/sqft | DOM | Units | Dist |
|---|---|---|---|---|---|---|---|---|
| 3669 Sagefield Dr Harmony, FL | 3.0 | 2.0 | 1515 | $2,300 | $1.52 | 25d | 1 | 0.33mi |
| 3687 Sagefield Dr Harmony, FL | 4.0 | 2.5 | 2335 | $2,350 | $1.01 | 25d | 1 | 0.35mi |
| 4592 Sagefield Dr Harmony, FL | 4.0 | 2.0 | 1820 | $2,500 | $1.37 | 25d | 1 | 0.41mi |
| 4480 Sagefield Dr Harmony, FL | 4.0 | 2.0 | 1820 | $2,300 | $1.26 | 25d | 1 | 0.57mi |
| 3963 Sagefield Dr Harmony, FL | 3.0 | 2.0 | 1673 | $2,600 | $1.55 | 25d | 1 | 0.67mi |
| 4224 Sagefield Dr Harmony, FL | 4.0 | 3.0 | 2400 | $2,590 | $1.08 | 5d | 1 | 0.86mi |
| 3430 Sagebrush St Harmony, FL | 3.0 | 2.0 | 1876 | $2,380 | $1.27 | 25d | 1 | 0.87mi |
| 7129 Red Lantern Dr Unit 7129 Harmony, FL | 3.0 | 2.5 | 1855 | $2,200 | $1.19 | 5d | 1 | 0.92mi |
| 3509 Clay Brick Rd Harmony, FL | 4.0 | 2.5 | 2085 | $2,550 | $1.22 | 25d | 1 | 1.00mi |
| 7537 Wing Span Way Harmony, FL | 4.0 | 3.0 | 2361 | $2,500 | $1.06 | 25d | 1 | 1.06mi |
| 3303 Primrose Willow Dr Saint Cloud, FL | 4.0 | 2.0 | 2047 | $2,430 | $1.19 | 25d | 1 | 1.21mi |
| 6927 Cupseed Ln Harmony, FL | 3.0 | 2.5 | 1824 | $2,195 | $1.20 | 25d | 1 | 1.42mi |
HOA detail
- Monthly dues
- $68 · $816/yr
Listing history 4 events
-
2026-04-21status Pending
-
2026-04-18price $439,900
-
2026-03-12price $434,900
-
2026-03-06$426,900 Active
ⓘ Source: listings_history table (triggers on properties + properties_extension) + one-shot
backfill from property_details.listing_events for pre-trigger history.
Nearby sold comps map
Loading sold comps map…
Walkable amenities ~0.75 mi
Loading nearby amenities…
Taxation est. · year 1
- Rental income
- $31,884
- − Mortgage interest
- −$24,641
- − Property taxes
- −$6,598
- − Insurance
- −$2,200
- − Repairs & maintenance
- −$2,551
- − Management
- −$2,551
- − HOA
- −$816
- − Depreciation
- −$12,797
- Taxable loss
- −$20,270
- Est. tax savings @ 24.0%
- +$4,865
- After-tax cash flow
- $-7,244/yr
For passive investors: Depreciation is non-cash, so a rental often shows a tax loss while cash-flowing — sheltering income. Rental losses are passive: they offset passive income freely, and up to $25,000/yr can offset ordinary (W-2) income if you actively participate and your MAGI is under $100k (phasing out to $0 by $150k); unused losses carry forward. On sale, claimed depreciation is recaptured at up to 25%, and gains may owe capital-gains tax (a 1031 exchange can defer both). Figures are a year-1 estimate at your 24.0% rate — not tax advice; consult a CPA.
Schools (NCES district)
- District
- Osceola
- NCES district ID
- 1201470
- Math proficiency
- 39% ▼ -9.00%
- Reading proficiency
- 45% ▼ -4.00%
- Median HH income
- $45,528
- Composite
- 35.7/100
- National rank
- #4865
- State rank
- #60 of 73 in FL
Livability — St. Cloud
No livability data for this city. (Only ~50 U.S. cities are tracked.)
Census & demographics
- County
- Osceola County · 410,217 people
- City population
- 29,247
- Metro
- Orlando-Kissimmee-Sanford, FL
- Population (ZIP)
- 5,816
- Household income
- $80,524
- Rent vs Own
- Severe rent burden
- 47.0
Population outlook (Osceola County) Hauer SSP2
- Today (2025)
- 447,624 people
- By 2030
- 511,823 · +14.3%
- By 2040
- 642,986 · +43.6%
- By 2050
- 774,552 · +73.0%
- By 2075
- 1,078,144 · +140.9%
- By 2100
- 1,269,660 · +183.6%
Race, ethnicity, and origin ACS 2023
- Neighborhood character
- Majority White (59%)
- Race & ethnicity
- White 59% Hispanic / Latino 33% Two or more races 11%
- Hispanic origin (detail)
- Puerto Rican 20%
- Common ancestry
- Portuguese 5% Slovak 3% Romanian 2%
- Foreign-born
- 12% · Canada, South Korea
- Languages at home
- 67% English-only · Spanish 27% Other Indo-European 4% German/W. Germanic 1%
Political lean MEDSL · Osceola
- 2024 margin
- Toss-up / Even · D 48.7% · R 50.2% · Other 1.1%
- 2008→2024 swing
- -21.2pp toward R · 2008: 19.7pp · 2024: -1.4pp
- All cycles
- 2024: R+1.4 2020: D+13.8 2016: D+25.0 2012: D+24.5 2008: D+19.7
Not yet ingested
- Civics
- —
Market trends
- HPI YoY
- ▼ -0.47%
- Current HPI
- 279.5662
- Rent YoY
- ▲ 1.79%
- Metro
- Orlando-Kissimmee-Sanford, FL
- State GDP YoY
- ▲ 3.28%
- F500 in state
- 36
Industry mix (Fortune 500 HQ in FL)
| Industry | F500 HQs | Revenue |
|---|---|---|
| Industrial Technology | 2 | $29B |
|
||
| Insurance | 2 | $17B |
|
||
| Retail | 1 | $60B |
|
||
| Technology Distribution | 1 | $58B |
|
||
| Homebuilding | 1 | $35B |
|
||
| Technology Manufacturing | 1 | $35B |
|
||
Price history
+3.0% since first listed4 events — show timeline
- 2026-04-21 Pending — Stellar MLS as Distributed by MLS Grid
- 2026-04-18 Price Changed $439,900 Stellar MLS as Distributed by MLS Grid
- 2026-03-12 Price Changed $434,900 Stellar MLS as Distributed by MLS Grid
- 2026-03-06 Listed $426,900 Stellar MLS as Distributed by MLS Grid
Cash-flow waterfall
monthlySold comps — $/sqft
last 12 mo · ≤1 miLoading sold comps…