 🏗️ New Construction
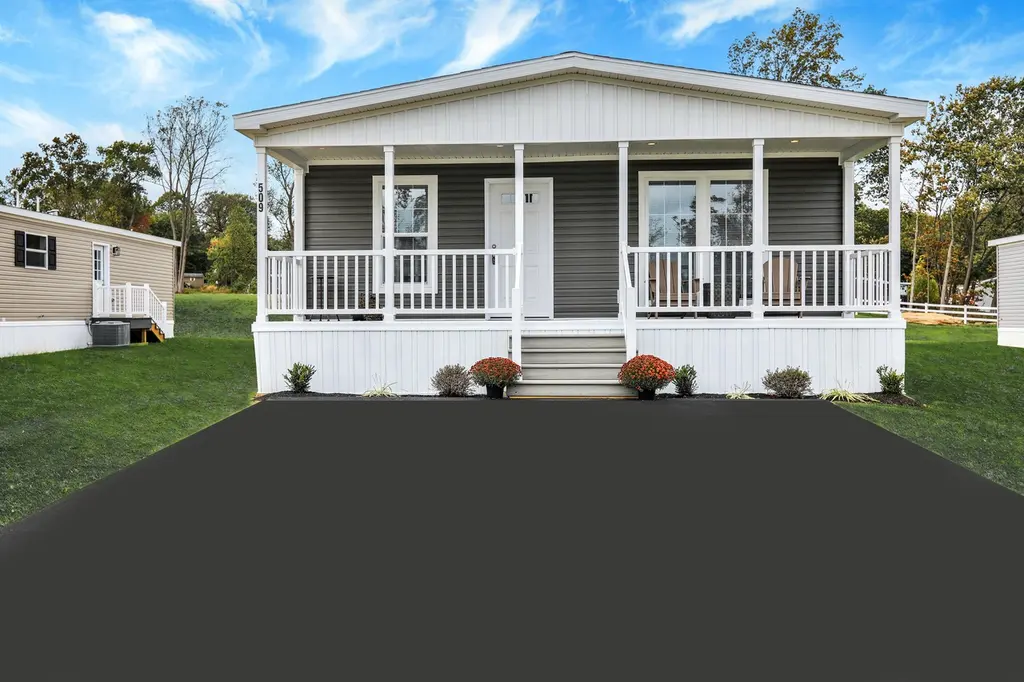
Meadow Plan · Longswamp, PA
Flood risk No data
- FEMA flood zone
- —
- Chance of flooding over 30 yrs
- —
- Est. flood insurance / yr
- —
Fire risk No data
- Est. fire insurance / yr
- —
Heat risk No data
- Hot days now (above threshold)
- —
- Hot days in 30 yrs
- —
Wind risk No data
- Chance of severe wind over 30 yrs
- —
Air-quality risk No data
- Unhealthy air days now
- —
- Unhealthy air days in 30 yrs
- —
Risk factors via First Street. Map © Google.
Why this score? — see what drove the B grade
The composite is a weighted blend of 9 inputs, each scored 0–100. Each bar is that input's sub-score; the figure is the points it added to the 100-point composite (weight × sub-score).
- Cash flow +30.0/30.0
- 1% rule +10.0/10.0
- DSCR +10.0/10.0
- ARV discount +7.5/15.0
- Schools +5.2/10.0
- Condition / age +4.0/5.0
- Rent growth +2.5/5.0
- Livability +2.5/5.0
- Appreciation +0.0/10.0
$188,040
🖨 Deal sheet 📄 Offer letter ✓ Due diligence
Listing remarks MLS
Modern Eat-in Kitchen with Designer Island Step into style, comfort, and convenience with this stunning new construction 3 bedroom, 2 bathroom home, thoughtfully designed for modern functionality. Features: 3 Bed & 2 Bath Home Primary Bedroom Suite with Private Bath & Walk-in Closet Modern Eat-in Kitchen with Designer Island Pantry & Beverage Station Generously Sized Living Area Utility Room with Washer and Dryer Hook-Ups 2 Car Dwriveway Central A/C
Key facts
- Pantry
- Private bath
- Walk-in closet
Tags
Neighborhood map
What this means for you Summary
Snapshot
- This is a 3-bed/2.0-bath manufactured listed at $188k. Condition is rated good.
Deal economics
- At list price, monthly cash flow is $1k ($12k/yr) — positive.
- The deal already cash-flows at list — no discount required.
- Meets the 1% rule at list price ($2k rent vs $188k).
- Recommended offer: $165k (12.0% below list) — sets the bar for market timing.
Location & tenants
- Location reads: area grade B — affects rentability + tenant quality, not the cash-flow math above.
- Brandywine Heights Area SD (suburban): math 48% / reading 66% proficiency, ranked #241 of 658 in PA (top 37%) — acceptable for families but not a draw, mixed tenant base, ~2y average lease; only 20% free/reduced lunch — higher-income household profile.
- Market conditions: Rents flat; 157 active listings in the ZIP; high-income renter base; 258 units permitted in Berks County in 2024 (27 in 5+ unit buildings).
Forward outlook
- Local home prices are declining (-3.0%/yr); year-one equity from $926 of loan paydown is wiped out by about $4k of value loss. Plan a longer hold.
- Berks County population projected at +3% by 2050 — modest demand growth; plan on rents tracking national, not racing it.
- At projected returns (-3.0% appreciation + 0.1% rent growth), your $37k cash investment doubles in ~4 years — after that, you're playing with house money.
Negotiation context
- It's been on market 161 days — a 12% lower offer ($165k) is reasonable based on typical stale-listing flexibility.
Questions for the listing agent
- It's been on market 161 days. Have you received any prior offers? Is the seller open to a 12% concession, seller financing, or rate buy-down credit?
- Why hasn't it sold? Are there any deal-killer items the seller is aware of (foundation, flood, title, zoning, code violations)?
- Is there a deadline driving the sale (1031 exchange, divorce, estate, relocation)? That informs how much negotiation room exists.
- What's the average days-on-market for RENTAL listings here right now (not sales)? A rising rental-DOM trend means longer vacancies and softer asking-rent achievability than the comps imply.
- What's the recent tenant-quality profile in this submarket — average credit score on applications, eviction rate, late-payment / NSF rate, and stable-employment percentage? A property-management company in the area should have these aggregated.
- How much new for-sale + rental construction is in the pipeline within 1–3 miles? Heavy new supply typically softens prices + rents 12–24 months out; constrained supply supports both.
Investment metrics
- 1% rule
- 1.85% ✓
- Cap rate
- 15.54%
- Cash-on-cash
- 33.02%
- DSCR
- 2.47
- GRM
- 4.5
CMA / ARV
- ARV (median comp)
- $133,900
- List price
- $188,040
- Delta
- 40.43%
- Verdict
- OVERPRICED
- Comps
- 1 within 2.0 mi
Show comp detail 2 sales within ~0.75 mi
| Address | Dist | Beds/Ba | Sqft | Sold | Price | $/sf | Match |
|---|---|---|---|---|---|---|---|
| 194 Haddon Dr | 0.19mi | 3/2.0 | 1,344 (+5%) | 2mo | $133,900 | $100 | 81 |
| 62 Mansfield Dr | 0.21mi | 3/2.0 | 1,120 (-12%) | 23mo | $77,900 | $70 | 50 |
Match score weights: distance 35% · size 25% · config 20% · recency 20%. Top-matched comps best support the ARV.
Projected returns pro-forma
-3.0% appreciation · 0.13% rent growth · sell at horizon
- IRR
- 24.9%
- Equity multiple
- 1.99×
- Total profit
- $37,089
- Equity at exit
- $19,965
- IRR
- 30.8%
- Equity multiple
- 3.40×
- Total profit
- $90,108
- Equity at exit
- $11,577
Cash invested: $37,492 (down + closing). Projections, not guarantees.
Landlord ↔ Tenant lean methodology
- Overall (STATE)
- 62 Landlord-Friendly
- State Pennsylvania
- 62 Landlord-Friendly · EVEN
- County
- — inherits STATE
- City
- — inherits STATE
ZIP-level market 18062
- Home prices YoY
- -26.4%
- Rents YoY
- 0.1%
- Active inventory
- 157
- Price-to-rent
- 6.3×
Monthly cashflow live
- Estimated rent
- $2,477 medium interval (Pro) →
- Mortgage (P&I)
- −$702
- Tax est. 1.5%
- −$167 /mo · $2,008/yr
- Insurance
- −$56
- HOA
- −$0
- Vacancy / Maint / Mgmt
- −$520
- Net cashflow
- $1,032
Break-even live
UW: 25.0% down · 7.5% · 30yr · 1.5% tax · 5.0% vac · 8.0% maint · 8.0% mgmt
Financing live
Cash to close
- Down payment
- $33,475
- Closing costs
- $4,017
- Reserves months
- —
- Total cash needed
- —
Loan-product check · same deal, 3 products live
Conventional
25% down · 7.5% · 30yr
- Down + closing
- —
- Monthly P&I
- —
- Monthly cashflow
- —
- DSCR
- —
- Eligible?
- —
Personal DTI + credit; lowest rate.
DSCR
20% down · 8.5% · 30yr
- Down + closing
- —
- Monthly P&I
- —
- Monthly cashflow
- —
- DSCR
- —
- Eligible?
- —
No personal income docs; deal must DSCR.
Hard money
10% down · 12.0% · 12mo
- Down + closing
- —
- Monthly P&I
- —
- Monthly cashflow
- —
- DSCR
- —
- Eligible?
- —
Short-term bridge; refi at stabilization.
Listing history 17 events
-
2026-06-18days on market $188,040 Active 161 DOM
-
2026-06-17days on market $188,040 Active 160 DOM
-
2026-06-16days on market $188,040 Active 159 DOM
-
2026-06-15days on market $188,040 Active 158 DOM
-
2026-06-14days on market $188,040 Active 156 DOM
-
2026-06-13days on market $188,040 Active 155 DOM
-
2026-06-10days on market $188,040 Active 153 DOM
-
2026-06-09days on market $188,040 Active 152 DOM
-
2026-06-08days on market $188,040 Active 151 DOM
-
2026-06-07days on market $188,040 Active 150 DOM
-
2026-06-05days on market $188,040 Active 147 DOM
-
2026-06-03days on market $188,040 Active 146 DOM
-
2026-06-02days on market $188,040 Active 145 DOM
-
2026-06-01days on market $188,040 Active 144 DOM
-
2026-05-31days on market $188,040 Active 143 DOM
-
2026-05-31days on market $188,040 Active 142 DOM
-
2026-01-08$188,040 Active 471-char remark
Show marketing remark (471 chars)
Modern Eat-in Kitchen with Designer Island Step into style, comfort, and convenience with this stunning new construction 3 bedroom, 2 bathroom home, thoughtfully designed for modern functionality. Features: 3 Bed & 2 Bath Home Primary Bedroom Suite with Private Bath & Walk-in Closet Modern Eat-in Kitchen with Designer Island Pantry & Beverage Station Generously Sized Living Area Utility Room with Washer and Dryer Hook-Ups 2 Car Dwriveway Central A/C
ⓘ Source: listings_history table (triggers on properties + properties_extension) + one-shot
backfill from property_details.listing_events for pre-trigger history.
Nearby sold comps map
Loading sold comps map…
Walkable amenities ~0.75 mi
Loading nearby amenities…
Taxation est. · year 1
- Rental income
- $29,726
- − Mortgage interest
- −$7,500
- − Property taxes
- −$2,008
- − Insurance
- −$670
- − Repairs & maintenance
- −$2,378
- − Management
- −$2,378
- − Depreciation
- −$3,895
- Taxable income
- $10,896
- Est. tax owed @ 24.0%
- −$2,615
- After-tax cash flow
- $9,764/yr
For passive investors: Depreciation is non-cash, so a rental often shows a tax loss while cash-flowing — sheltering income. Rental losses are passive: they offset passive income freely, and up to $25,000/yr can offset ordinary (W-2) income if you actively participate and your MAGI is under $100k (phasing out to $0 by $150k); unused losses carry forward. On sale, claimed depreciation is recaptured at up to 25%, and gains may owe capital-gains tax (a 1031 exchange can defer both). Figures are a year-1 estimate at your 24.0% rate — not tax advice; consult a CPA.
Condition & rehab AI · 12 photos
This modern manufactured home is in excellent condition with no visible repairs needed. It offers a good balance of curb appeal and interior functionality, making it a solid investment.
Value-add opportunities
- Both Painting the exterior and interior walls — Fresh paint can enhance curb appeal and interior aesthetics.
- Both Adding smart home features — Smart home features can increase both resale and rental value.
- Both Upgrading the kitchen appliances — Modern appliances can make the kitchen more appealing and functional.
- Both Adding a smart thermostat — A smart thermostat can improve energy efficiency and comfort, enhancing both resale and rental value.
- Both Upgrading the flooring in the bathrooms — Upgrading the flooring can make the bathrooms more appealing and functional, enhancing both resale and rental value.
Renovation cost estimate screening
Value-add ROI direction
- Both Painting the exterior and interior walls — Fresh paint can enhance curb appeal and interior aesthetics. ↑
- Both Adding smart home features — Smart home features can increase both resale and rental value. ↑
- Both Upgrading the kitchen appliances — Modern appliances can make the kitchen more appealing and functional. ↑
- Both Adding a smart thermostat — A smart thermostat can improve energy efficiency and comfort, enhancing both resale and rental value. ↑
- Both Upgrading the flooring in the bathrooms — Upgrading the flooring can make the bathrooms more appealing and functional, enhancing both resale and rental value. ↑
ⓘ Cost ranges are severity-bucket heuristics (US national rule-of-thumb). Get contractor quotes + a written scope before underwriting a rehab budget.
Schools (NCES district)
- District
- Brandywine Heights Area SD
- NCES district ID
- 4204050
- Math proficiency
- 48% ▲ 1.00%
- Reading proficiency
- 66% ▼ -1.00%
- Median HH income
- $62,904
- Composite
- 51.52/100
- National rank
- #3670
- State rank
- #241 of 658 in PA
Livability — Longswamp
No livability data for this city. (Only ~50 U.S. cities are tracked.)
Census & demographics
- County
- Lehigh County · 333,019 people
- Metro
- Allentown-Bethlehem-Easton, PA-NJ
- Population (ZIP)
- 27,110
- Household income
- $110,675
- Rent vs Own
- Severe rent burden
- 537.0
Population outlook (Berks County) Hauer SSP2
- Today (2025)
- 425,767 people
- By 2030
- 428,814 · +0.7%
- By 2040
- 433,463 · +1.8%
- By 2050
- 439,426 · +3.2%
- By 2075
- 478,647 · +12.4%
- By 2100
- 518,507 · +21.8%
Race, ethnicity, and origin ACS 2023
- Neighborhood character
- Predominantly White (77%)
- Race & ethnicity
- White 77% Hispanic / Latino 10% Two or more races 10% Asian 5% Black 3%
- Hispanic origin (detail)
- Puerto Rican 4% Dominican 2%
- Common ancestry
- Romanian 5% Lithuanian 2% Subsaharan African 2%
- Foreign-born
- 11% · Canada, China, Jamaica
- Languages at home
- 83% English-only · Spanish 7% Other Indo-European 4% French/Haitian/Cajun 2%
Political lean MEDSL · Berks
- 2024 margin
- R (+12.2) · D 43.4% · R 55.6%
- 2008→2024 swing
- -21.4pp toward R · 2008: 9.2pp · 2024: -12.2pp
- All cycles
- 2024: R+12.2 2020: R+8.2 2016: R+10.2 2012: R+0.6 2008: D+9.2
Not yet ingested
- Civics
- —
Market trends
- HPI YoY
- ▼ -91.04%
- Current HPI
- 253.5939
- Rent YoY
- ▲ 0.13%
- Metro
- Allentown-Bethlehem-Easton, PA-NJ
- State GDP YoY
- ▲ 1.68%
- F500 in state
- 34
Industry mix (Fortune 500 HQ in PA)
| Industry | F500 HQs | Revenue |
|---|---|---|
| Healthcare | 2 | $309B |
|
||
| Insurance | 2 | $27B |
|
||
| Telecommunications / Media | 1 | $124B |
|
||
| Industrial Distribution | 1 | $22B |
|
||
| Financial Services | 1 | $20B |
|
||
| Chemicals / Materials | 1 | $18B |
|
||
Price history
1 event — show timeline
- 2026-01-08 Listed $188,040 Zillow
Cash-flow waterfall
monthlySold comps — $/sqft
last 12 mo · ≤1 miLoading sold comps…