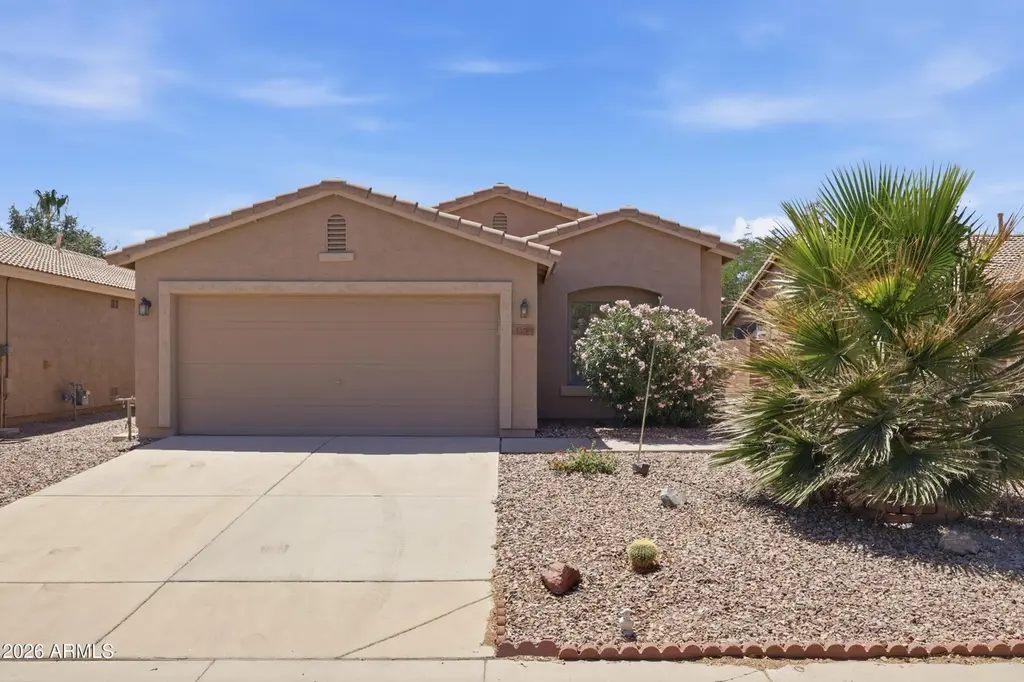
43599 W Sagebrush Trl · Maricopa, AZ
Flood risk 1/10 · Minimal
- FEMA flood zone
- X (shaded)
- Chance of flooding over 30 yrs
- 0.0%
- Est. flood insurance / yr
- $507 – $1,088
Fire risk 7/10 · Major
- Est. fire insurance / yr
- $610 – $1,132
Heat risk 9/10 · Severe
- Hot days now (above 114°F)
- 7 days/yr
- Hot days in 30 yrs
- 18 days/yr
Wind risk 1/10 · Minimal
- Chance of severe wind over 30 yrs
- —
Air-quality risk 1/10 · Minimal
- Unhealthy air days now
- 0 days/yr
- Unhealthy air days in 30 yrs
- 0 days/yr
Risk factors via First Street. Map © Google.
Why this score? — see what drove the D- grade
The composite is a weighted blend of 9 inputs, each scored 0–100. Each bar is that input's sub-score; the figure is the points it added to the 100-point composite (weight × sub-score).
- ARV discount +11.8/15.0
- Cash flow +7.9/30.0
- Appreciation +4.6/10.0
- Livability +3.6/5.0
- Rent growth +2.9/5.0
- Condition / age +2.5/5.0
- Schools +2.3/10.0
- DSCR +2.0/10.0
- 1% rule +1.8/10.0
$289,900
🖨 Deal sheet 📄 Offer letter ✓ Due diligence
Listing remarks MLS
Nice 4 bedroom 2 bath bank owned property. Home is move-in ready!! Great room floor plan includes spacious kitchen with extended breakfast bar. Seller is selling the property in ''As Is'' condition with no warranties either expressed nor implied. Buyer to verify any and all items that are of material issue.
Key facts
- Open floor plan
- Built in coffee bar
- Natural light
Tags
Property features AI
Finance
- HOA & community: Community amenities include golf, lake, playground, and biking/walking paths; Homeowners association with quarterly fee (includes grounds maintenance); No visible truck/trailer/RV/boat rule
Exterior
- Parking: 2 covered parking spaces; 2 open parking spaces; 2-car garage with garage door opener
- Utilities: Private water company; Public sewer
- Home design: Single family residence; Fee simple ownership
- Construction: Stucco and wood frame construction; Tile roof
- Exterior features: Desert landscaping in front and back; Grass in back; Block fencing
Interior
- Kitchen: Refrigerator; Dishwasher; Disposal; Built-in microwave; Pantry
- Bedrooms: Up to 4 bedrooms
- Flooring: Carpet; Tile
- Bathrooms: 2 full bathrooms
- Heating & cooling: Ceiling heating; Central air; Ceiling fans
- Interior features: Granite counters; Double vanity; Master bedroom on main level; Breakfast bar; No interior steps; Pantry; Primary bedroom with full bath; Dual-pane windows
- Laundry & utility: Laundry area inside
Neighborhood map
What this means for you Summary
Snapshot
- This is a 3-bed/2.0-bath single-family listed at $290k.
Deal economics
- At list price, monthly cash flow is $-303 ($-4k/yr) — negative.
- To cash-flow at today's rent, offer at most $236k (18.5% below list).
- To meet the 1% rule (rent ≥ 1% of price), the offer needs to be $197k (31.9% below list).
- Recommended offer: $197k (31.9% below list) — sets the bar for 1% rule.
- Cap rate 5.0% vs local median 3.7% in Maricopa — top-decile yield for the area; either an underpriced asset or a hidden risk that comps aren't pricing in. Stress-test before assuming the spread holds.
Location & tenants
- Location reads 72/100 on livability (#28 in AZ) — a middle-class / working-renter tenant base. Strengths: housing A+, employment A-, crime B+; Watch: amenities F, commute F, health & safety F.
- Maricopa Unified School District (4441) (town): math 20% / reading 29% proficiency, ranked #128 of 249 in AZ (top 51%) — low school quality limits family demand, transient renter base, plan for 1-2y turnover.
- Zoned schools: Santa Rosa Elementary School (math 32% / reading 37%, grade F, #471 of 1,109 statewide, top 44%, 486 students, 50% FRL); Maricopa Wells Middle School (math 13% / reading 23%, grade F, #143 of 218 statewide, top 66%, 934 students, 57% FRL); Maricopa High School (math 12% / reading 19%, grade F, #262 of 381 statewide, top 69%, 2,188 students, 46% FRL) — zoned schools at 51% FRL track the district average.
- Market conditions: Rents rising (+1.8%/yr); 845 active listings in the ZIP; 40 comparable units currently listed for rent nearby; rentals at typical pace (median 24d on market — plan ~3-4 weeks tenant-placement turnaround); 42% of comp listings sitting > 30 days — soft ceiling on asking rent; solid renter incomes; 9,504 units permitted in Pinal County in 2024 (776 in 5+ unit buildings).
Forward outlook
- Local home prices are declining (-0.9%/yr); year-one equity from $2k of loan paydown is wiped out by about $3k of value loss. Plan a longer hold.
Negotiation context
- It's been on market 33 days — a 3% lower offer ($281k) is reasonable based on typical stale-listing flexibility.
- 4 sale attempts since 18y ago with the ask held roughly flat each time — persistent listings suggest the price (not the market) is what's stuck; bring a comps-based counter.
- Current owner paid $75k; list at $290k implies a 287% gain — meaningful room to come down on a strong offer.
Risks & watch-outs
- Climate carrying-cost: major wildfire risk; extreme-heat days projected 7→18/yr by 2055 (HVAC capex compounding) — expect insurance premiums to compound above CPI over the hold.
Questions for the listing agent
- What do current leases actually rent for vs. the listed asking? Can we see a recent rent roll and the last 12 months of T-12 income?
- It's been on market 33 days. Have you received any prior offers? Is the seller open to a 32% concession, seller financing, or rate buy-down credit?
- What does the HOA fee cover, when was the last increase, and are there any pending special assessments or reserve-fund shortfalls?
- Is there a deadline driving the sale (1031 exchange, divorce, estate, relocation)? That informs how much negotiation room exists.
- Schools are B-rated — typically a magnet for longer-tenancy family renters. What's the average tenant stay here, and is there a school-zone premium baked into asking?
- The area grade is low — what's the realistic commute time and amenity access for the typical tenant pool here? Any planned neighborhood developments (good or bad) we should know about?
- What's the average days-on-market for RENTAL listings here right now (not sales)? A rising rental-DOM trend means longer vacancies and softer asking-rent achievability than the comps imply.
- What's the recent tenant-quality profile in this submarket — average credit score on applications, eviction rate, late-payment / NSF rate, and stable-employment percentage? A property-management company in the area should have these aggregated.
- How much new for-sale + rental construction is in the pipeline within 1–3 miles? Heavy new supply typically softens prices + rents 12–24 months out; constrained supply supports both.
Investment metrics
- 1% rule
- 0.68% ✗
- Cap rate
- 5.04%
- Cash-on-cash
- -4.49%
- DSCR
- 0.80
- GRM
- 12.2
CMA / ARV
- ARV (median comp)
- $320,757
- List price
- $289,900
- Delta
- -9.62%
- Verdict
- FAIR
- Comps
- 20 within 1.0 mi
Show comp detail 12 sales within ~0.75 mi
| Address | Dist | Beds/Ba | Sqft | Sold | Price | $/sf | Match |
|---|---|---|---|---|---|---|---|
| 43626 W Colby Dr | 0.08mi | 3/2.0 | 1,684 (+1%) | 1mo | $298,499 | $177 | 94 |
| 43343 W Chisholm Dr | 0.22mi | 3/2.0 | 1,604 (-4%) | 1mo | $330,000 | $206 | 82 |
| 21563 N Greenway Rd | 0.34mi | 3/2.0 | 1,624 (-3%) | 1mo | $335,000 | $206 | 78 |
| 21221 N Jubilee Pl | 0.45mi | 2/2.0 (-1) | 1,694 (+1%) | 0mo | $345,990 | $204 | 71 |
| 44106 W Kramer Ln | 0.55mi | 3/2.0 | 1,631 (-2%) | 0mo | $261,250 | $160 | 70 |
| 21171 N Jubilee Pl | 0.46mi | 2/2.0 (-1) | 1,614 (-3%) | 2mo | $327,445 | $203 | 66 |
| 42671 W Anne Ln | 0.60mi | 3/2.0 | 1,527 (-9%) | 2mo | $305,000 | $200 | 56 |
| 43843 W Roth Rd | 0.47mi | 3/2.0 | 1,885 (+13%) | 1mo | $385,000 | $204 | 56 |
| 42806 W Whispering Wind Ln | 0.68mi | 2/2.0 (-1) | 1,583 (-5%) | 1mo | $325,000 | $205 | 54 |
| 44729 W Alamendras St | 0.72mi | 4/2.0 (+1) | 1,754 (+5%) | 2mo | $265,000 | $151 | 51 |
| 21197 N Jubilee Pl | 0.46mi | 2/2.0 (-1) | 1,906 (+14%) | 1mo | $347,200 | $182 | 49 |
| 44188 W Cydnee Dr | 0.43mi | 4/2.0 (+1) | 1,917 (+15%) | 1mo | $287,000 | $150 | 49 |
Match score weights: distance 35% · size 25% · config 20% · recency 20%. Top-matched comps best support the ARV.
Projected returns pro-forma
-0.89% appreciation · 1.78% rent growth · sell at horizon
- IRR
- -12.1%
- Equity multiple
- 0.48×
- Total profit
- $-42,135
- Equity at exit
- $71,544
- IRR
- -6.3%
- Equity multiple
- 0.43×
- Total profit
- $-46,254
- Equity at exit
- $76,469
Cash invested: $81,172 (down + closing). Projections, not guarantees.
Landlord ↔ Tenant lean methodology
- Overall (STATE)
- 87 Strongly Landlord-Friendly
- State Arizona
- 87 Strongly Landlord-Friendly · R+3
- County
- — inherits STATE
- City
- — inherits STATE
ZIP-level market 85138
- Home prices YoY
- -0.3%
- Rents YoY
- 1.8%
- Active inventory
- 845
- Price-to-rent
- 12.2×
Monthly cashflow live
- Estimated rent
- $1,974 high interval (Pro) →
- Mortgage (P&I)
- −$1,520
- Tax from tax record
- −$170 /mo · $2,037/yr
- Insurance
- −$121
- HOA
- −$52
- Vacancy / Maint / Mgmt
- −$415
- Net cashflow
- $-303
Break-even live
UW: 25.0% down · 7.5% · 30yr · 1.5% tax · 5.0% vac · 8.0% maint · 8.0% mgmt
Financing live
Cash to close
- Down payment
- $72,475
- Closing costs
- $8,697
- Reserves months
- —
- Total cash needed
- —
Loan-product check · same deal, 3 products live
Conventional
25% down · 7.5% · 30yr
- Down + closing
- —
- Monthly P&I
- —
- Monthly cashflow
- —
- DSCR
- —
- Eligible?
- —
Personal DTI + credit; lowest rate.
DSCR
20% down · 8.5% · 30yr
- Down + closing
- —
- Monthly P&I
- —
- Monthly cashflow
- —
- DSCR
- —
- Eligible?
- —
No personal income docs; deal must DSCR.
Hard money
10% down · 12.0% · 12mo
- Down + closing
- —
- Monthly P&I
- —
- Monthly cashflow
- —
- DSCR
- —
- Eligible?
- —
Short-term bridge; refi at stabilization.
Rent comps 40 comps
| Address | Beds | Baths | Sqft | Rent | $/sqft | DOM | Units | Dist |
|---|---|---|---|---|---|---|---|---|
| 43697 W Sagebrush Trl Maricopa, AZ | 3.0 | 2.5 | 1981 | $1,600 | $0.81 | 24d | 1 | 0.08mi |
| 21338 N Keystone Dr Maricopa, AZ | 3.0 | 2.0 | 1276 | $1,475 | $1.16 | 43d | 1 | 0.13mi |
| 43683 W Elm Dr Maricopa, AZ | 3.0 | 2.0 | 1124 | $1,665 | $1.48 | 5d | 1 | 0.16mi |
| 43207 W Lindgren Dr Maricopa, AZ | 3.0 | 2.0 | 1907 | $1,699 | $0.89 | 43d | 1 | 0.25mi |
| 43839 W Rio Grande Dr Maricopa, AZ | 2.0 | 2.0 | 1462 | $1,650 | $1.13 | 5d | 1 | 0.25mi |
| 21426 N Duncan Dr Maricopa, AZ | 3.0 | 2.0 | 1241 | $1,599 | $1.29 | 43d | 1 | 0.27mi |
| 21061 N Bustos Way Maricopa, AZ | 3.0 | 2.0 | 1907 | $1,749 | $0.92 | 43d | 1 | 0.29mi |
| 43878 W Wade Dr Maricopa, AZ | 3.0 | 2.0 | 1685 | $1,750 | $1.04 | 2d | 1 | 0.34mi |
| 43854 W Cahill Dr Unit 1545679P Maricopa, AZ | 3.0 | 2.0 | 1689 | $2,258 | $1.34 | 15d | 1 | 0.37mi |
| 20793 N Marquez Dr Maricopa, AZ | 3.0 | 2.0 | 1441 | $1,550 | $1.08 | 43d | 1 | 0.41mi |
| 21047 N Alma Dr Maricopa, AZ | 3.0 | 2.0 | 1628 | $1,995 | $1.23 | 43d | 1 | 0.43mi |
| 44212 W Cydnee Dr Maricopa, AZ | 3.0 | 2.0 | 1441 | $1,700 | $1.18 | 43d | 1 | 0.46mi |
| 43205 W Roth Rd Maricopa, AZ | 4.0 | 2.0 | 2216 | $2,100 | $0.95 | 11d | 1 | 0.48mi |
| 43205 W Roth Rd Maricopa, AZ | 4.0 | 2.0 | 2215 | $2,200 | $0.99 | 43d | 1 | 0.48mi |
| 43332 W Griffis Dr Maricopa, AZ | 4.0 | 2.0 | 2235 | $4,200 | $1.88 | 43d | 1 | 0.52mi |
| 43849 W Kramer Ln Maricopa, AZ | 4.0 | 2.0 | 1870 | $1,895 | $1.01 | 17d | 1 | 0.53mi |
| 19696 N Madison Dr Maricopa, AZ | 4.0 | 2.5 | 2219 | $3,400 | $1.53 | 24d | 1 | 0.53mi |
| 22257 N Gibson Dr Maricopa, AZ | 3.0 | 2.5 | 1806 | $1,795 | $0.99 | 24d | 1 | 0.67mi |
| 22257 N Gibson Dr Maricopa, AZ | 3.0 | 2.5 | 1806 | $1,795 | $0.99 | 43d | 1 | 0.67mi |
| 22257 N Gibson Dr Maricopa, AZ | 3.0 | 2.5 | 1806 | $1,795 | $0.99 | 20d | 1 | 0.67mi |
| 44812 W Paraiso Ln Maricopa, AZ | 3.0 | 2.0 | 1413 | $1,595 | $1.13 | 3d | 1 | 0.77mi |
| 44456 W Eddie Way Maricopa, AZ | 3.0 | 2.0 | 1679 | $1,695 | $1.01 | 44d | 1 | 0.78mi |
| 44871 W Gavilan Dr Maricopa, AZ | 3.0 | 2.0 | 1277 | $1,595 | $1.25 | 2d | 1 | 0.85mi |
| 43368 W Palmen Dr Maricopa, AZ | 4.0 | 2.5 | 2200 | $1,889 | $0.86 | 43d | 1 | 0.87mi |
| 22156 N Sunset Dr Maricopa, AZ | 3.0 | 2.0 | 2112 | $2,100 | $0.99 | 1d | 1 | 0.87mi |
| 22641 N Gibson Dr Maricopa, AZ | 3.0 | 2.0 | 2169 | $1,699 | $0.78 | 44d | 1 | 0.87mi |
| 43194 W Sunland Dr Maricopa, AZ | 4.0 | 2.0 | 1937 | $1,850 | $0.96 | 15d | 1 | 0.91mi |
| 43914 W Adobe Cir Maricopa, AZ | 3.0 | 2.0 | 2168 | $2,070 | $0.95 | 43d | 1 | 0.91mi |
| 42826 W Darter Dr Maricopa, AZ | 2.0 | 2.0 | 1596 | $1,875 | $1.17 | 24d | 1 | 0.93mi |
| 42416 W Heavenly Pl Maricopa, AZ | 2.0 | 2.0 | 1542 | $1,850 | $1.20 | 43d | 1 | 0.93mi |
| 21619 N Van Loo Dr Maricopa, AZ | 3.0 | 2.0 | 1938 | $3,500 | $1.81 | 3d | 1 | 0.95mi |
| 43223 W Neely Dr Maricopa, AZ | 4.0 | 2.0 | 2223 | $2,900 | $1.30 | 16d | 1 | 0.96mi |
| 42348 W Fountainhead St Maricopa, AZ | 2.0 | 2.0 | 1700 | $2,600 | $1.53 | 43d | 1 | 0.99mi |
| 45023 W Miramar Rd Maricopa, AZ | 3.0 | 2.0 | 1653 | $3,000 | $1.81 | 43d | 1 | 1.01mi |
| 44171 W Adobe Cir Maricopa, AZ | 4.0 | 2.0 | 2160 | $2,100 | $0.97 | 1d | 1 | 1.01mi |
| 45192 W Alamendras St Maricopa, AZ | 3.0 | 1.5 | 1461 | $1,600 | $1.10 | 24d | 1 | 1.02mi |
| 42780 W Sunland Dr Maricopa, AZ | 3.0 | 2.0 | 1489 | $1,700 | $1.14 | 24d | 1 | 1.03mi |
| 42181 W Basie Ln Maricopa, AZ | 2.0 | 2.0 | 1491 | $1,674 | $1.12 | 24d | 1 | 1.03mi |
| 42181 W Basie Ln Maricopa, AZ | 2.0 | 2.0 | 1491 | $1,674 | $1.12 | 20d | 1 | 1.03mi |
| 20580 N Confetti Ct Maricopa, AZ | 2.0 | 2.0 | 1905 | $2,550 | $1.34 | 24d | 1 | 1.04mi |
HOA detail
- Monthly dues
- $52 · $624/yr
Listing history 20 events
-
2026-06-18days on market $289,900 Active 33 DOM
-
2026-06-17days on market $289,900 Active 32 DOM
-
2026-06-16days on market $289,900 Active 31 DOM
-
2026-06-15days on market $289,900 Active 30 DOM
-
2026-06-13days on market $289,900 Active 28 DOM
-
2026-06-13pricedays on market $289,900 Active 27 DOM
-
2026-06-09days on market $299,900 Active 24 DOM
-
2026-06-08days on market $299,900 Active 23 DOM
-
2026-06-07days on market $299,900 Active 22 DOM
-
2026-06-04days on market $299,900 Active 19 DOM
-
2026-06-03days on market $299,900 Active 18 DOM
-
2026-06-02days on market $299,900 Active 17 DOM
-
2026-06-01days on market $299,900 Active 16 DOM
-
2026-05-31days on market $299,900 Active 15 DOM
-
2026-05-08$299,900 Active 706-char remark
-
2009-06-16soldstatus $75,000 308-char remark
Show marketing remark (308 chars)
Nice 4 bedroom 2 bath bank owned property. Home is move-in ready!! Great room floor plan includes spacious kitchen with extended breakfast bar. Seller is selling the property in ''As Is'' condition with no warranties either expressed nor implied. Buyer to verify any and all items that are of material issue.
-
2009-05-13historical 308-char remark
Show marketing remark (308 chars)
Nice 4 bedroom 2 bath bank owned property. Home is move-in ready!! Great room floor plan includes spacious kitchen with extended breakfast bar. Seller is selling the property in ''As Is'' condition with no warranties either expressed nor implied. Buyer to verify any and all items that are of material issue.
-
2009-04-29$71,726 308-char remark
Show marketing remark (308 chars)
Nice 4 bedroom 2 bath bank owned property. Home is move-in ready!! Great room floor plan includes spacious kitchen with extended breakfast bar. Seller is selling the property in ''As Is'' condition with no warranties either expressed nor implied. Buyer to verify any and all items that are of material issue.
-
2009-03-27historical
-
2008-05-17$90,000
ⓘ Source: listings_history table (triggers on properties + properties_extension) + one-shot
backfill from property_details.listing_events for pre-trigger history.
Tax reassessment forecast AZ · Resets to sale price
- Current annual tax
- $2,037 · $170/mo
- Projected year-2 tax
- $2,037 · $170/mo
- Expected delta
- $0/yr ($0/mo · 0.0%)
ⓘ Screening estimate from a state-policy table — verify with the county assessor before closing.
Climate risk First Street
- Flood 1/10 Low FEMA zone X (shaded) · 0% chance over 30 yrs
- Wildfire 7/10 Severe
- Heat 9/10 Extreme 7 d/yr ≥114°F today · 18 d/yr by 30 yrs out
- Wind 1/10 Low
- Air quality 1/10 Low 0 unhealthy d/yr today · 0 by 30 yrs out
Nearby sold comps map
Loading sold comps map…
Walkable amenities ~0.75 mi
Loading nearby amenities…
Taxation est. · year 1
- Rental income
- $23,686
- − Mortgage interest
- −$16,239
- − Property taxes
- −$2,037
- − Insurance
- −$1,450
- − Repairs & maintenance
- −$1,895
- − Management
- −$1,895
- − HOA
- −$624
- − Depreciation
- −$8,433
- Taxable loss
- −$8,886
- Est. tax savings @ 24.0%
- +$2,133
- After-tax cash flow
- $-1,509/yr
For passive investors: Depreciation is non-cash, so a rental often shows a tax loss while cash-flowing — sheltering income. Rental losses are passive: they offset passive income freely, and up to $25,000/yr can offset ordinary (W-2) income if you actively participate and your MAGI is under $100k (phasing out to $0 by $150k); unused losses carry forward. On sale, claimed depreciation is recaptured at up to 25%, and gains may owe capital-gains tax (a 1031 exchange can defer both). Figures are a year-1 estimate at your 24.0% rate — not tax advice; consult a CPA.
Schools (NCES district)
- District
- Maricopa Unified School District (4441)
- NCES district ID
- 0404720
- Math proficiency
- 20% ▼ -18.00%
- Reading proficiency
- 29% ▼ -9.00%
- Median HH income
- $63,725
- Composite
- 22.92/100
- National rank
- #7993
- State rank
- #128 of 249 in AZ
Livability — Maricopa
- Score
- 72/100
- State rank
- #28
- US rank
- #5943
Category grades
Schools grade is shown separately in the Schools card above.
Census & demographics
- Census place
- Maricopa, AZ
- County
- Pinal County · 399,947 people
- City population
- 76,044
- Metro
- Phoenix-Mesa-Chandler, AZ
- Population (ZIP)
- 55,260
- Household income
- $95,867
- Rent vs Own
- Severe rent burden
- 432.0
Population outlook (Pinal County) Hauer SSP2
- Today (2025)
- 437,574 people
- By 2030
- 446,903 · +2.1%
- By 2040
- 452,589 · +3.4%
- By 2050
- 444,126 · +1.5%
- By 2075
- 430,300 · -1.7%
- By 2100
- 393,536 · -10.1%
Race, ethnicity, and origin ACS 2023
- Neighborhood character
- Diverse neighborhood (Simpson 0.69)
- Race & ethnicity
- White 45% Hispanic / Latino 30% Two or more races 17% Black 13% Native American 3% Asian 3% Pacific Islander 1%
- Hispanic origin (detail)
- Mexican 26% Puerto Rican 1%
- Common ancestry
- Lithuanian 2% Romanian 2% Italian 2%
- Foreign-born
- 10% · Canada
- Languages at home
- 79% English-only · Spanish 16% Other Asian/Pacific 1% Other Indo-European 1%
Political lean MEDSL · Pinal
- 2024 margin
- Strong R (+22.1) · D 38.5% · R 60.6%
- 2008→2024 swing
- -7.6pp toward R · 2008: -14.5pp · 2024: -22.1pp
- All cycles
- 2024: R+22.1 2020: R+17.3 2016: R+19.3 2012: R+17.1 2008: R+14.5
Not yet ingested
- Civics
- —
Market trends
- HPI YoY
- ▼ -0.89%
- Current HPI
- 258.1461
- Rent YoY
- ▲ 1.78%
- Metro
- Phoenix-Mesa-Chandler, AZ
- State GDP YoY
- ▲ 4.54%
- F500 in state
- 20
Industry mix (Fortune 500 HQ in AZ)
| Industry | F500 HQs | Revenue |
|---|---|---|
| Technology | 2 | $13B |
|
||
| Mining / Metals | 1 | $23B |
|
||
| Environmental Services | 1 | $16B |
|
||
| Metals / Steel | 1 | $14B |
|
||
| Technology Distribution | 1 | $9B |
|
||
| Homebuilding | 1 | $8B |
|
||
Price history
+222.1% since first listed9 events — show timeline
- 2026-06-11 Price Changed $289,900 ARMLS
- 2026-05-28 Relisted — ARMLS
- 2026-05-20 Pending — ARMLS
- 2026-05-08 Listed $299,900 ARMLS
- 2009-06-16 Sold (MLS) $75,000 ARMLS
- 2009-05-13 Listing Removed — ARMLS
- 2009-04-29 Listed $71,726 ARMLS
- 2009-03-27 Listing Removed — ARMLS
- 2008-05-17 Listed $90,000 ARMLS
Property tax history
+1.0%/yrLatest (2025): $2,037 · +3.5% YoY. Source: county tax records.
Cash-flow waterfall
monthlySold comps — $/sqft
last 12 mo · ≤1 miLoading sold comps…