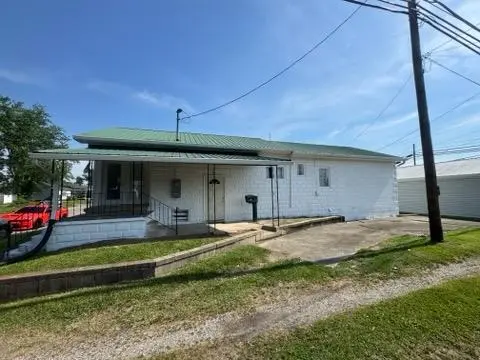
20 N Illinois Ave · Wellston, OH
Flood risk 1/10 · Minimal
- FEMA flood zone
- X (unshaded)
- Chance of flooding over 30 yrs
- 0.0%
- Est. flood insurance / yr
- $473 – $860
Fire risk 4/10 · Minor
- Est. fire insurance / yr
- $713 – $1,323
Heat risk 4/10 · Minor
- Hot days now (above 100°F)
- 7 days/yr
- Hot days in 30 yrs
- 19 days/yr
Wind risk 2/10 · Minimal
- Chance of severe wind over 30 yrs
- 1.0%
Air-quality risk 2/10 · Minimal
- Unhealthy air days now
- 0 days/yr
- Unhealthy air days in 30 yrs
- 1 days/yr
Risk factors via First Street. Map © Google.
Why this score? — see what drove the D+ grade
The composite is a weighted blend of 9 inputs, each scored 0–100. Each bar is that input's sub-score; the figure is the points it added to the 100-point composite (weight × sub-score).
- ARV discount +12.7/15.0
- Cash flow +11.7/30.0
- Appreciation +3.5/10.0
- Schools +3.5/10.0
- DSCR +3.4/10.0
- Livability +3.4/5.0
- Rent growth +2.5/5.0
- Condition / age +2.5/5.0
- 1% rule +2.4/10.0
$119,900
🖨 Deal sheet 📄 Offer letter ✓ Due diligence
Listing remarks
Welcome home to this cozy and beautifully updated 2-bedroom, 1.5-bath residence offering approximately 1,200 square feet of comfortable living space. Conveniently located on a 0.082-acre lot within walking distance of downtown Wellston, you'll enjoy easy access to local restaurants, shopping, and entertainment. Step inside to find an inviting open-concept floor plan featuring a spacious living room and dining area, perfect for everyday living and entertaining. The large main bathroom includes convenient washer and dryer hookups, adding to the home's functionality. A full unfinished basement with a half bath provides abundant storage space and endless possibilities for a workshop, recreation
Key facts
- Move-in ready
- 3,615 sq ft lot
- Built 1950
Tags
Property features AI
Exterior
- Parking: No garage
- Utilities: Public water; Private sewer; 200+ amp electrical service
- Home design: Single-family residence; One story
- Construction: Block and vinyl siding exterior; Metal roof; Built with a foundation (has basement)
- Exterior features: Covered patio/porch
Interior
- Kitchen: Range; Gas water heater
- Bedrooms: 2 main-level bedrooms
- Flooring: Vinyl; Carpet; Concrete
- Bathrooms: 1 full bathroom; 1 half bathroom (main level)
- Heating & cooling: Forced air heating (natural gas); Central air conditioning
- Interior features: High speed internet; Storm windows; Full basement
Neighborhood map
What this means for you Summary
Snapshot
- This is a 2-bed/1.0-bath single-family listed at $120k.
Deal economics
- At list price, monthly cash flow is $-35 ($-417/yr) — negative.
- To cash-flow at today's rent, offer at most $114k (5.1% below list).
- To meet the 1% rule (rent ≥ 1% of price), the offer needs to be $89k (25.7% below list).
- Recommended offer: $89k (25.7% below list) — sets the bar for 1% rule.
- Cap rate 5.9% vs local median 3.2% in Wellston — top-decile yield for the area; either an underpriced asset or a hidden risk that comps aren't pricing in. Stress-test before assuming the spread holds.
Location & tenants
- Location reads 67/100 on livability (#606 in OH) — a middle-class / working-renter tenant base. Strengths: cost of living A+, housing A+, crime B; Watch: health & safety C-, employment D, amenities F.
- Wellston City (rural): math 38% / reading 47% proficiency, ranked #532 of 656 in OH (top 81%) — families likely to look elsewhere, expect single-tenant / working-renter base with shorter leases.
- Market conditions: 50 active listings in the ZIP; 32 units permitted in Jackson County in 2024 (0 in 5+ unit buildings).
Forward outlook
- Local home prices are declining (-3.0%/yr); year-one equity from $829 of loan paydown is wiped out by about $4k of value loss. Plan a longer hold.
- Jackson County population projected at -22% by 2050 — secular population decline; favor cash flow + early exit over multi-decade hold.
Negotiation context
- Only 10 days on market — expect competitive offers; lowballing is unlikely to land.
Risks & watch-outs
- Watch-outs: built in 1950 — expect roof / HVAC / electrical / plumbing capex.
Questions for the listing agent
- What do current leases actually rent for vs. the listed asking? Can we see a recent rent roll and the last 12 months of T-12 income?
- Built in 1950 — when were the roof, HVAC, electrical panel, plumbing, and water heater last replaced?
- Is there a deadline driving the sale (1031 exchange, divorce, estate, relocation)? That informs how much negotiation room exists.
- The area grade is low — what's the realistic commute time and amenity access for the typical tenant pool here? Any planned neighborhood developments (good or bad) we should know about?
- What's the average days-on-market for RENTAL listings here right now (not sales)? A rising rental-DOM trend means longer vacancies and softer asking-rent achievability than the comps imply.
- What's the recent tenant-quality profile in this submarket — average credit score on applications, eviction rate, late-payment / NSF rate, and stable-employment percentage? A property-management company in the area should have these aggregated.
- How much new for-sale + rental construction is in the pipeline within 1–3 miles? Heavy new supply typically softens prices + rents 12–24 months out; constrained supply supports both.
Investment metrics
- 1% rule
- 0.74% ✗
- Cap rate
- 5.94%
- Cash-on-cash
- -1.24%
- DSCR
- 0.94
- GRM
- 11.2
CMA / ARV
- ARV (on-the-fly)
- $135,600
- Comps found
- 10
Show comp detail 10 sales within ~0.75 mi
| Address | Dist | Beds/Ba | Sqft | Sold | Price | $/sf | Match |
|---|---|---|---|---|---|---|---|
| 253 S Illinois Ave | 0.26mi | 2/1.0 | 1,140 (-5%) | 5mo | $125,000 | $110 | 75 |
| 424 S Missouri St | 0.38mi | 3/1.0 (+1) | 1,120 (-7%) | 3mo | $75,000 | $67 | 64 |
| 222 N Minnesota Ave | 0.18mi | 3/1.0 (+1) | 1,134 (-6%) | 18mo | $120,000 | $106 | 62 |
| 119 N Park Ave | 0.18mi | 2/2.0 | 1,051 (-12%) | 8mo | $108,000 | $103 | 60 |
| 550 W Broadway St | 0.24mi | 3/1.0 (+1) | 1,320 (+10%) | 10mo | $165,000 | $125 | 59 |
| 438 S Minnesota Ave | 0.39mi | 3/1.0 (+1) | 1,196 (-0%) | 22mo | $149,000 | $125 | 58 |
| 215 W "d" St | 0.23mi | 3/1.0 (+1) | 1,300 (+8%) | 23mo | $79,000 | $61 | 51 |
| 587 Broadway St | 0.31mi | 3/1.5 (+1) | 1,376 (+15%) | 9mo | $184,500 | $134 | 46 |
| 312 E A St | 0.42mi | 3/2.0 (+1) | 1,237 (+3%) | 24mo | $165,000 | $133 | 46 |
| 475 S Wisconsin Ave | 0.41mi | 3/2.0 (+1) | 1,350 (+12%) | 24mo | $152,000 | $113 | 31 |
Match score weights: distance 35% · size 25% · config 20% · recency 20%. Top-matched comps best support the ARV.
Projected returns pro-forma
-3.0% appreciation · 3.0% rent growth · sell at horizon
- IRR
- -18.4%
- Equity multiple
- 0.35×
- Total profit
- $-21,687
- Equity at exit
- $17,877
- IRR
- -10.8%
- Equity multiple
- 0.35×
- Total profit
- $-21,908
- Equity at exit
- $10,367
Cash invested: $33,572 (down + closing). Projections, not guarantees.
Landlord ↔ Tenant lean methodology
- Overall (STATE)
- 73 Landlord-Friendly
- State Ohio
- 73 Landlord-Friendly · R+6
- County
- — inherits STATE
- City
- — inherits STATE
ZIP-level market 45692
- Home prices YoY
- -1.4%
- Active inventory
- 50
- Price-to-rent
- 11.2×
Monthly cashflow live
- Estimated rent
- $891 medium interval (Pro) →
- Mortgage (P&I)
- −$629
- Tax from tax record
- −$60 /mo · $716/yr
- Insurance
- −$50
- HOA
- −$0
- Vacancy / Maint / Mgmt
- −$187
- Net cashflow
- $-35
Break-even live
UW: 25.0% down · 7.5% · 30yr · 1.5% tax · 5.0% vac · 8.0% maint · 8.0% mgmt
Financing live
Cash to close
- Down payment
- $29,975
- Closing costs
- $3,597
- Reserves months
- —
- Total cash needed
- —
Loan-product check · same deal, 3 products live
Conventional
25% down · 7.5% · 30yr
- Down + closing
- —
- Monthly P&I
- —
- Monthly cashflow
- —
- DSCR
- —
- Eligible?
- —
Personal DTI + credit; lowest rate.
DSCR
20% down · 8.5% · 30yr
- Down + closing
- —
- Monthly P&I
- —
- Monthly cashflow
- —
- DSCR
- —
- Eligible?
- —
No personal income docs; deal must DSCR.
Hard money
10% down · 12.0% · 12mo
- Down + closing
- —
- Monthly P&I
- —
- Monthly cashflow
- —
- DSCR
- —
- Eligible?
- —
Short-term bridge; refi at stabilization.
Listing history 9 events
-
2026-06-17status $119,900 Pending 10 DOM
-
2026-06-17days on market $119,900 Active 10 DOM
-
2026-06-16days on market $119,900 Active 9 DOM
-
2026-06-15days on market $119,900 Active 8 DOM
-
2026-06-13days on market $119,900 Active 6 DOM
-
2026-06-12days on market $119,900 Active 5 DOM
-
2026-06-09days on market $119,900 Active 2 DOM
-
2026-06-08remarks 699-char remark
-
2026-06-08$119,900 Active 1 DOM
ⓘ Source: listings_history table (triggers on properties + properties_extension) + one-shot
backfill from property_details.listing_events for pre-trigger history.
Tax reassessment forecast OH · Partial reset (capped growth)
- Current annual tax
- $716 · $60/mo
- Projected year-2 tax
- $1,293 · $108/mo
- Expected delta
- +$577/yr (+$48/mo · 80.7%)
ⓘ Screening estimate from a state-policy table — verify with the county assessor before closing.
Climate risk First Street
- Flood 1/10 Low FEMA zone X (unshaded) · 0% chance over 30 yrs
- Wildfire 4/10 Moderate
- Heat 4/10 Moderate 7 d/yr ≥100°F today · 19 d/yr by 30 yrs out
- Wind 2/10 Low 100% chance of damaging wind over 30 yrs
- Air quality 2/10 Low 0 unhealthy d/yr today · 1 by 30 yrs out
Nearby sold comps map
Loading sold comps map…
Walkable amenities ~0.75 mi
Loading nearby amenities…
Taxation est. · year 1
- Rental income
- $10,687
- − Mortgage interest
- −$6,716
- − Property taxes
- −$716
- − Insurance
- −$600
- − Repairs & maintenance
- −$855
- − Management
- −$855
- − Depreciation
- −$3,488
- Taxable loss
- −$2,542
- Est. tax savings @ 24.0%
- +$610
- After-tax cash flow
- $193/yr
For passive investors: Depreciation is non-cash, so a rental often shows a tax loss while cash-flowing — sheltering income. Rental losses are passive: they offset passive income freely, and up to $25,000/yr can offset ordinary (W-2) income if you actively participate and your MAGI is under $100k (phasing out to $0 by $150k); unused losses carry forward. On sale, claimed depreciation is recaptured at up to 25%, and gains may owe capital-gains tax (a 1031 exchange can defer both). Figures are a year-1 estimate at your 24.0% rate — not tax advice; consult a CPA.
Schools (NCES district)
- District
- Wellston City
- NCES district ID
- 3904502
- Math proficiency
- 38% ▼ -18.00%
- Reading proficiency
- 47% ▼ -10.00%
- Median HH income
- $35,982
- Composite
- 35.2/100
- National rank
- #4991
- State rank
- #532 of 656 in OH
Livability — Wellston
- Score
- 67/100
- State rank
- #606
- US rank
- #10407
Category grades
Schools grade is shown separately in the Schools card above.
Census & demographics
- Census place
- Wellston, OH
- County
- Jackson · 32,540 people
- City population
- 7,699
- Population (ZIP)
- 7,699
- Household income
- $52,449
- Rent vs Own
Population outlook (Jackson County) Hauer SSP2
- Today (2025)
- 30,794 people
- By 2030
- 29,535 · -4.1%
- By 2040
- 26,757 · -13.1%
- By 2050
- 23,897 · -22.4%
- By 2075
- 17,115 · -44.4%
- By 2100
- 10,908 · -64.6%
Race, ethnicity, and origin ACS 2023
- Neighborhood character
- Predominantly White (98%)
- Race & ethnicity
- White 98% Two or more races 1%
- Common ancestry
- Italian 2% Lithuanian 1% Serbian 1%
- Languages at home
- 99% English-only · German/W. Germanic 1%
Political lean MEDSL · Jackson
- 2024 margin
- Solid R (+58.1) · D 20.7% · R 78.8%
- 2008→2024 swing
- -37.9pp toward R · 2008: -20.2pp · 2024: -58.1pp
- All cycles
- 2024: R+58.1 2020: R+54.1 2016: R+48.9 2012: R+20.8 2008: R+20.2
Not yet ingested
- Civics
- —
Market trends
- HPI YoY
- ▼ -3.09%
- Current HPI
- 219.2619
- Rent YoY
- —
- Metro
- —
- State GDP YoY
- ▲ 1.98%
- F500 in state
- 48
Industry mix (Fortune 500 HQ in OH)
| Industry | F500 HQs | Revenue |
|---|---|---|
| Insurance | 3 | $145B |
|
||
| Industrial Machinery | 3 | $49B |
|
||
| Financial Services | 3 | $24B |
|
||
| Consumer Goods | 2 | $93B |
|
||
| Aerospace / Defense | 2 | $47B |
|
||
| Utilities | 2 | $33B |
|
||
Price history
1 event — show timeline
- 2026-06-07 Listed $119,900 SVAR
Property tax history
+12.5%/yrLatest (2025): $716 · +4.1% YoY. Source: county tax records.
Cash-flow waterfall
monthlySold comps — $/sqft
last 12 mo · ≤1 miLoading sold comps…