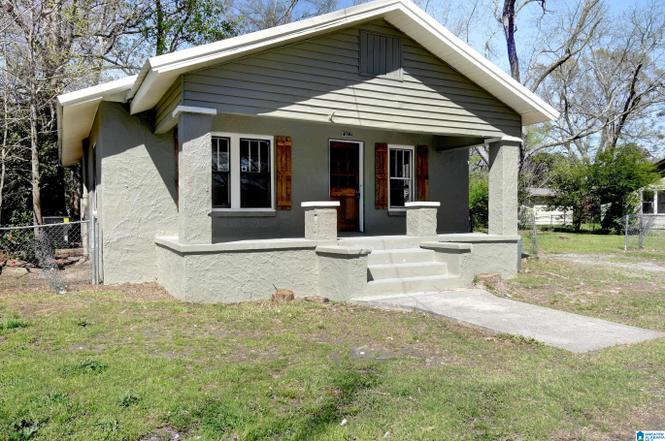
1412 Taylor Ave · Clanton, AL
Flood risk 1/10 · Minimal
- FEMA flood zone
- X (unshaded)
- Chance of flooding over 30 yrs
- 0.0%
- Est. flood insurance / yr
- $473 – $860
Fire risk 3/10 · Minor
- Est. fire insurance / yr
- $916 – $1,700
Heat risk 6/10 · Moderate
- Hot days now (above 106°F)
- 7 days/yr
- Hot days in 30 yrs
- 19 days/yr
Wind risk 6/10 · Moderate
- Chance of severe wind over 30 yrs
- 66.0%
Air-quality risk 2/10 · Minimal
- Unhealthy air days now
- 1 days/yr
- Unhealthy air days in 30 yrs
- 3 days/yr
Risk factors via First Street. Map © Google.
Why this score? — see what drove the D+ grade
The composite is a weighted blend of 9 inputs, each scored 0–100. Each bar is that input's sub-score; the figure is the points it added to the 100-point composite (weight × sub-score).
- Cash flow +16.5/30.0
- ARV discount +14.3/15.0
- DSCR +5.1/10.0
- 1% rule +3.6/10.0
- Livability +3.1/5.0
- Rent growth +2.5/5.0
- Condition / age +2.5/5.0
- Schools +2.1/10.0
- Appreciation +0.0/10.0
$155,000
🖨 Deal sheet 📄 Offer letter ✓ Due diligence
Listing remarks MLS
Charming 3 Bedroom home on a double lot in the heart of Clanton! This home still has tall baseboards and wide window trim of the early 1900's, but the finishes have been updated with a modern touch. The kitchen offers ample cabinet space and new appliance. A large family room complete with a cozy fireplace spans the back of the house. The large yard provides plenty of room for entertainment, pets, or playing for the kids!
Key facts
- Size yard
- Live-in ready
- Beautiful layout
Tags
Neighborhood map
What this means for you Summary
Snapshot
- This is a 2-bed/1.0-bath single-family listed at $155k.
Deal economics
- At list price, monthly cash flow is $92 ($1k/yr) — positive.
- The deal already cash-flows at list — no discount required.
- To meet the 1% rule (rent ≥ 1% of price), the offer needs to be $133k (14.4% below list).
- Recommended offer: $133k (14.4% below list) — sets the bar for 1% rule.
- Cap rate 7.0% vs local median 3.4% in Clanton — top-decile yield for the area; either an underpriced asset or a hidden risk that comps aren't pricing in. Stress-test before assuming the spread holds.
Location & tenants
- Location reads 61/100 on livability (#259 in AL) — a middle-class / working-renter tenant base. Strengths: cost of living A+, housing A+; Watch: schools D-, crime D-, amenities F.
- Chilton County (rural): math 15% / reading 34% proficiency, ranked #94 of 129 in AL (top 73%) — low school quality limits family demand, transient renter base, plan for 1-2y turnover.
- Market conditions: 125 active listings in the ZIP; 5 comparable units currently listed for rent nearby; rentals at typical pace (median 24d on market — plan ~3-4 weeks tenant-placement turnaround); 25 units permitted in Chilton County in 2024 (0 in 5+ unit buildings).
Forward outlook
- Local home prices are declining (-3.0%/yr); year-one equity from $1k of loan paydown is wiped out by about $5k of value loss. Plan a longer hold.
- Chilton County population projected at -10% by 2050 — secular population decline; favor cash flow + early exit over multi-decade hold.
Negotiation context
- Only 1 days on market — expect competitive offers; lowballing is unlikely to land.
- 4 sale attempts since 5y ago with the ask held roughly flat each time — persistent listings suggest the price (not the market) is what's stuck; bring a comps-based counter.
Risks & watch-outs
- Watch-outs: built in 1900 — expect roof / HVAC / electrical / plumbing capex.
- Climate carrying-cost: major wind risk, 66% chance of damaging wind over 30y; extreme-heat days projected 7→19/yr by 2055 (HVAC capex compounding) — expect insurance premiums to compound above CPI over the hold.
Questions for the listing agent
- Built in 1900 — when were the roof, HVAC, electrical panel, plumbing, and water heater last replaced?
- Is there a deadline driving the sale (1031 exchange, divorce, estate, relocation)? That informs how much negotiation room exists.
- Schools are D-rated, which usually means shorter tenancies and higher turnover. Who's the typical renter profile here, and what's been the actual vacancy rate?
- Crime grade is D in this area — have there been break-ins, vandalism, or insurance claims at this property in the last 3 years? What carrier currently insures it and at what premium?
- The area grade is low — what's the realistic commute time and amenity access for the typical tenant pool here? Any planned neighborhood developments (good or bad) we should know about?
- What's the average days-on-market for RENTAL listings here right now (not sales)? A rising rental-DOM trend means longer vacancies and softer asking-rent achievability than the comps imply.
- What's the recent tenant-quality profile in this submarket — average credit score on applications, eviction rate, late-payment / NSF rate, and stable-employment percentage? A property-management company in the area should have these aggregated.
- How much new for-sale + rental construction is in the pipeline within 1–3 miles? Heavy new supply typically softens prices + rents 12–24 months out; constrained supply supports both.
Investment metrics
- 1% rule
- 0.86% ✗
- Cap rate
- 7.00%
- Cash-on-cash
- 2.54%
- DSCR
- 1.11
- GRM
- 9.7
CMA / ARV
- ARV (on-the-fly)
- $182,454
- Comps found
- 10
Show comp detail 10 sales within ~0.75 mi
| Address | Dist | Beds/Ba | Sqft | Sold | Price | $/sf | Match |
|---|---|---|---|---|---|---|---|
| 1409 Taylor Ave | 0.03mi | 2/1.0 | 1,214 (-6%) | 1mo | $60,000 | $49 | 88 |
| 1412 Taylor Ave | 0.00mi | 3/1.0 (+1) | 1,294 (0%) | 24mo | $148,900 | $115 | 75 |
| 1006 2nd Ave N | 0.43mi | 2/2.0 | 1,358 (+5%) | 0mo | $165,000 | $122 | 68 |
| 1405 2nd Ave N | 0.07mi | 3/2.0 (+1) | 1,372 (+6%) | 17mo | $165,250 | $120 | 64 |
| 1409 4th Ave N | 0.15mi | 3/1.0 (+1) | 1,160 (-10%) | 10mo | $185,000 | $159 | 62 |
| 223 Louise St | 0.49mi | 3/2.0 (+1) | 1,208 (-7%) | 2mo | $208,900 | $173 | 56 |
| 1693 4th Ave N | 0.36mi | 2/2.0 | 1,152 (-11%) | 11mo | $175,000 | $152 | 52 |
| 1804 4th Ave N | 0.50mi | 3/2.0 (+1) | 1,326 (+2%) | 18mo | $186,500 | $141 | 48 |
| 113 Augusta St | 0.52mi | 3/1.0 (+1) | 1,456 (+12%) | 9mo | $160,000 | $110 | 42 |
| 107 Hinkle Rd | 0.58mi | 2/2.0 | 1,100 (-15%) | 21mo | $165,000 | $150 | 26 |
Match score weights: distance 35% · size 25% · config 20% · recency 20%. Top-matched comps best support the ARV.
Projected returns pro-forma
-3.0% appreciation · 3.0% rent growth · sell at horizon
- IRR
- -12.3%
- Equity multiple
- 0.55×
- Total profit
- $-19,320
- Equity at exit
- $23,111
- IRR
- -3.3%
- Equity multiple
- 0.78×
- Total profit
- $-9,500
- Equity at exit
- $13,402
Cash invested: $43,400 (down + closing). Projections, not guarantees.
Landlord ↔ Tenant lean methodology
- Overall (STATE)
- 90 Strongly Landlord-Friendly
- State Alabama
- 90 Strongly Landlord-Friendly · R+15
- County
- — inherits STATE
- City
- — inherits STATE
ZIP-level market 35045
- Home prices YoY
- -25.8%
- Active inventory
- 125
- Price-to-rent
- 9.7×
Monthly cashflow live
- Estimated rent
- $1,327 high interval (Pro) →
- Mortgage (P&I)
- −$813
- Tax from tax record
- −$79 /mo · $949/yr
- Insurance
- −$65
- HOA
- −$0
- Vacancy / Maint / Mgmt
- −$279
- Net cashflow
- $92
Break-even live
UW: 25.0% down · 7.5% · 30yr · 1.5% tax · 5.0% vac · 8.0% maint · 8.0% mgmt
Financing live
Cash to close
- Down payment
- $38,750
- Closing costs
- $4,650
- Reserves months
- —
- Total cash needed
- —
Loan-product check · same deal, 3 products live
Conventional
25% down · 7.5% · 30yr
- Down + closing
- —
- Monthly P&I
- —
- Monthly cashflow
- —
- DSCR
- —
- Eligible?
- —
Personal DTI + credit; lowest rate.
DSCR
20% down · 8.5% · 30yr
- Down + closing
- —
- Monthly P&I
- —
- Monthly cashflow
- —
- DSCR
- —
- Eligible?
- —
No personal income docs; deal must DSCR.
Hard money
10% down · 12.0% · 12mo
- Down + closing
- —
- Monthly P&I
- —
- Monthly cashflow
- —
- DSCR
- —
- Eligible?
- —
Short-term bridge; refi at stabilization.
Rent comps 5 comps
| Address | Beds | Baths | Sqft | Rent | $/sqft | DOM | Units | Dist |
|---|---|---|---|---|---|---|---|---|
| 57 Park Dr S Clanton, AL | 3.0 | 2.0 | 1192 | $1,200 | $1.01 | 43d | 1 | 1.39mi |
| 85 Park Dr S Clanton, AL | 2.0 | 2.5 | 1204 | $1,395 | $1.16 | 23d | 1 | 1.42mi |
| 87 Park Dr S Clanton, AL | 3.0 | 2.5 | 1344 | $1,495 | $1.11 | 23d | 1 | 1.42mi |
| 89 Park Dr S Clanton, AL | 3.0 | 2.5 | 1344 | $1,495 | $1.11 | 23d | 1 | 1.42mi |
| 91 Park Dr S Clanton, AL | 2.0 | 2.5 | 1204 | $1,395 | $1.16 | 23d | 1 | 1.43mi |
Listing history 2 events
-
2026-06-19remarks 332-char remark
-
2026-06-19$155,000 Active 1 DOM
ⓘ Source: listings_history table (triggers on properties + properties_extension) + one-shot
backfill from property_details.listing_events for pre-trigger history.
Tax reassessment forecast AL · Resets to sale price
- Current annual tax
- $949 · $79/mo
- Projected year-2 tax
- $949 · $79/mo
- Expected delta
- $0/yr ($0/mo · 0.0%)
ⓘ Screening estimate from a state-policy table — verify with the county assessor before closing.
Climate risk First Street
- Flood 1/10 Low FEMA zone X (unshaded) · 0% chance over 30 yrs
- Wildfire 3/10 Moderate
- Heat 6/10 Major 7 d/yr ≥106°F today · 19 d/yr by 30 yrs out
- Wind 6/10 Major 66% chance of damaging wind over 30 yrs
- Air quality 2/10 Low 1 unhealthy d/yr today · 3 by 30 yrs out
Nearby sold comps map
Loading sold comps map…
Walkable amenities ~0.75 mi
Loading nearby amenities…
Taxation est. · year 1
- Rental income
- $15,923
- − Mortgage interest
- −$8,682
- − Property taxes
- −$949
- − Insurance
- −$775
- − Repairs & maintenance
- −$1,274
- − Management
- −$1,274
- − Depreciation
- −$4,509
- Taxable loss
- −$1,540
- Est. tax savings @ 24.0%
- +$370
- After-tax cash flow
- $1,471/yr
For passive investors: Depreciation is non-cash, so a rental often shows a tax loss while cash-flowing — sheltering income. Rental losses are passive: they offset passive income freely, and up to $25,000/yr can offset ordinary (W-2) income if you actively participate and your MAGI is under $100k (phasing out to $0 by $150k); unused losses carry forward. On sale, claimed depreciation is recaptured at up to 25%, and gains may owe capital-gains tax (a 1031 exchange can defer both). Figures are a year-1 estimate at your 24.0% rate — not tax advice; consult a CPA.
Schools (NCES district)
- District
- Chilton County
- NCES district ID
- 0100660
- Math proficiency
- 15% ▼ -26.00%
- Reading proficiency
- 34% ▼ -5.00%
- Median HH income
- $41,269
- Composite
- 20.73/100
- National rank
- #8520
- State rank
- #94 of 129 in AL
Livability — Clanton
- Score
- 61/100
- State rank
- #259
- US rank
- #18072
Category grades
Schools grade is shown separately in the Schools card above.
Census & demographics
- Census place
- Clanton, AL
- County
- Chilton County · 15,324 people
- City population
- 15,324
- Metro
- Birmingham-Hoover, AL
- Population (ZIP)
- 15,324
- Household income
- $65,907
- Rent vs Own
- Severe rent burden
- 326.0
Population outlook (Chilton County) Hauer SSP2
- Today (2025)
- 44,064 people
- By 2030
- 43,694 · -0.8%
- By 2040
- 42,168 · -4.3%
- By 2050
- 39,667 · -10.0%
- By 2075
- 31,397 · -28.7%
- By 2100
- 21,319 · -51.6%
Race, ethnicity, and origin ACS 2023
- Neighborhood character
- Predominantly White (78%)
- Race & ethnicity
- White 78% Black 9% Hispanic / Latino 7% Two or more races 4% Asian 1%
- Hispanic origin (detail)
- Mexican 6%
- Common ancestry
- Slovak 2% Serbian 2% Italian 1%
- Foreign-born
- 3% · Canada, South Korea
- Languages at home
- 95% English-only · Spanish 4% Other Indo-European 1%
Political lean MEDSL · Chilton
- 2024 margin
- Solid R (+72.1) · D 13.7% · R 85.8%
- 2008→2024 swing
- -14.3pp toward R · 2008: -57.8pp · 2024: -72.1pp
- All cycles
- 2024: R+72.1 2020: R+67.4 2016: R+66.6 2012: R+60.3 2008: R+57.8
Not yet ingested
- Civics
- —
Market trends
- HPI YoY
- ▼ -65.21%
- Current HPI
- 187.6339
- Rent YoY
- —
- Metro
- Birmingham-Hoover, AL
- State GDP YoY
- ▲ 2.94%
- F500 in state
- 4
Industry mix (Fortune 500 HQ in AL)
| Industry | F500 HQs | Revenue |
|---|---|---|
| Financial Services | 1 | $8B |
|
||
| Healthcare | 1 | $5B |
|
||
Price history
+520.0% since first listed14 events — show timeline
- 2026-06-19 Listed $155,000 FSBO.com
- 2024-07-01 Pending — MAAR
- 2024-07-01 Sold (Public Records) $148,900 Public Records
- 2024-07-01 Sold (Public Records) $148,900 Public Records
- 2024-06-28 Sold (MLS) $148,900 Greater Alabama MLS
- 2024-06-28 Sold (MLS) $148,900 MAAR
- 2024-05-17 Contingent — MAAR
- 2024-05-17 Contingent — Greater Alabama MLS
- 2024-04-08 Listed $149,900 MAAR
- 2024-03-22 Listed $149,900 Greater Alabama MLS
- 2024-03-20 Coming Soon $149,900 Greater Alabama MLS
- 2022-01-26 Sold (MLS) $19,000 Greater Alabama MLS
- 2022-01-18 Price Changed $19,000 Greater Alabama MLS
- 2021-12-18 Listed $25,000 Greater Alabama MLS
Property tax history
+11.5%/yrLatest (2025): $949 · +179.5% YoY. Source: county tax records.
Cash-flow waterfall
monthlySold comps — $/sqft
last 12 mo · ≤1 miLoading sold comps…