1101 Orange St · La Marque, TX
Flood risk 7/10 · Major
- FEMA flood zone
- X
- Chance of flooding over 30 yrs
- 0.6%
- Est. flood insurance / yr
- $507 – $1,088
Fire risk 2/10 · Minimal
- Est. fire insurance / yr
- $1,222 – $2,270
Heat risk 10/10 · Severe
- Hot days now (above 109°F)
- 7 days/yr
- Hot days in 30 yrs
- 27 days/yr
Wind risk 10/10 · Severe
- Chance of severe wind over 30 yrs
- 99.0%
Air-quality risk 3/10 · Minor
- Unhealthy air days now
- 2 days/yr
- Unhealthy air days in 30 yrs
- 2 days/yr
Risk factors via First Street. Map © Google.
Why this score? — see what drove the D+ grade
The composite is a weighted blend of 9 inputs, each scored 0–100. Each bar is that input's sub-score; the figure is the points it added to the 100-point composite (weight × sub-score).
- Cash flow +23.4/30.0
- DSCR +7.5/10.0
- 1% rule +5.7/10.0
- Rent growth +3.5/5.0
- Livability +3.0/5.0
- Condition / age +2.5/5.0
- Schools +2.4/10.0
- ARV discount +1.7/15.0
- Appreciation +0.0/10.0
$159,000
🖨 Deal sheet 📄 Offer letter ✓ Due diligence
Listing remarks MLS
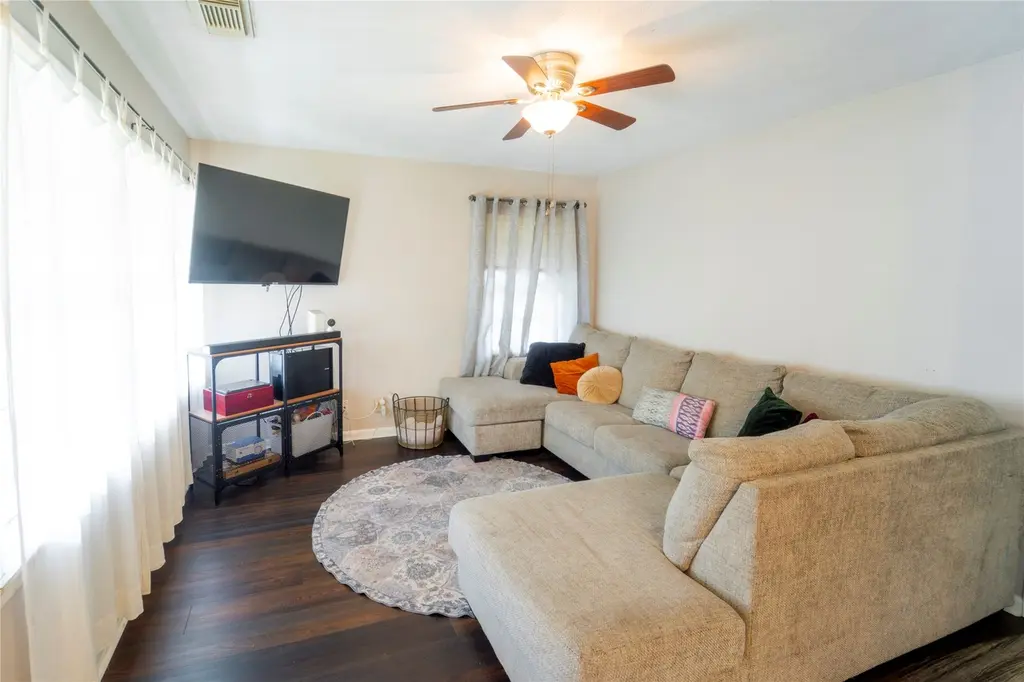
This spotless bungalow is a gem tucked in the cutest tree filled area of LaMarque. Large bedrooms, tons of cabinets in kitchen, wood laminate floors throughout, storage shed in back yard, all play equipment in back yard stays with the home. This home is spotless.
Key facts
- Modern appliances
- Updated flooring
- Quartz counter tops
Tags
Property features AI
Exterior
- Parking: Attached garage (1 car)
- Utilities: Public water; Public sewer
- Home design: Residential property; Faces northeast; Built in 1960; Single entry level layout
- Construction: Wood siding; Composition roof; Slab foundation
- Exterior features: Fence (back yard); Paved driveway; Porch; Private yard; Corner lot; Asphalt road
Interior
- Kitchen: Electric cooktop; Electric oven
- Bedrooms: Primary bedroom on third level (12 x 14); Primary bedroom on second level (16 x 10); Bedroom on first level (12 x 10)
- Flooring: Plank flooring; Vinyl flooring
- Bathrooms: 1 full bathroom
- Heating & cooling: Central heating (gas); Central air (electric)
- Interior features: Pantry; Tub with shower
- Laundry & utility: Washer hookup; Electric dryer hookup
Neighborhood map
What this means for you Summary
Snapshot
- This is a 3-bed/1.0-bath single-family listed at $159k.
Deal economics
- At list price, monthly cash flow is $227 ($3k/yr) — positive.
- The deal already cash-flows at list — no discount required.
- Meets the 1% rule at list price ($2k rent vs $159k).
- Cap rate 8.5% vs local median 5.6% in La Marque — top-decile yield for the area; either an underpriced asset or a hidden risk that comps aren't pricing in. Stress-test before assuming the spread holds.
Location & tenants
- Location reads 59/100 on livability (#1,136 in TX) — a working-class tenant base; expect higher turnover. Strengths: cost of living A+, housing A+; Watch: employment D, crime F, amenities F.
- Texas City ISD (suburban): math 28% / reading 29% proficiency, ranked #655 of 826 in TX (top 79%) — low school quality limits family demand, transient renter base, plan for 1-2y turnover; 66% free/reduced lunch — lower-income household profile, screen leases tightly.
- Zoned schools: Hayley El (math 7% / reading 11%, grade F, #4,293 of 4,322 statewide, top 99%, 562 students, 92% FRL); La Marque H S (math 27% / reading 20%, grade F, #1,342 of 1,632 statewide, top 82%, 647 students, 91% FRL) — zoned schools average 92% FRL vs 66% district-wide (26 pts higher); higher-poverty schools than district average — tighter screening recommended.
- Zoned-school proficiency averages 16% at this address vs 28% district-wide (-12 pts) — the specific schools serving this property underperform the Texas City ISD average; the district grade overstates school quality for this exact location.
- Market conditions: Rents rising (+4.0%/yr); 654 active listings in the ZIP; 9 comparable units currently listed for rent nearby; rentals at typical pace (median 19d on market — plan ~3-4 weeks tenant-placement turnaround); 3,258 units permitted in Galveston County in 2024 (0 in 5+ unit buildings).
Forward outlook
- Local home prices are declining (-3.0%/yr); year-one equity from $1k of loan paydown is wiped out by about $5k of value loss. Plan a longer hold.
- Galveston County population projected at +43% by 2050 — long-run rental-demand tailwind backs the buy-and-hold thesis.
Negotiation context
- Only 6 days on market — expect competitive offers; lowballing is unlikely to land.
- 2 sale attempts since 9y ago with the ask held roughly flat each time — persistent listings suggest the price (not the market) is what's stuck; bring a comps-based counter.
Risks & watch-outs
- Watch-outs: flood insurance adds $66/mo.
- Climate carrying-cost: major flood risk; severe wind risk, 99% chance of damaging wind over 30y; extreme-heat days projected 7→27/yr by 2055 (HVAC capex compounding) — expect insurance premiums to compound above CPI over the hold.
Questions for the listing agent
- Built in 1960 — when were the roof, HVAC, electrical panel, plumbing, and water heater last replaced?
- What's the actual annual flood-insurance premium (NFIP or private), and is the property in a SFHA with mandatory coverage?
- Is there a deadline driving the sale (1031 exchange, divorce, estate, relocation)? That informs how much negotiation room exists.
- Schools are F-rated, which usually means shorter tenancies and higher turnover. Who's the typical renter profile here, and what's been the actual vacancy rate?
- Crime grade is F in this area — have there been break-ins, vandalism, or insurance claims at this property in the last 3 years? What carrier currently insures it and at what premium?
- The area grade is low — what's the realistic commute time and amenity access for the typical tenant pool here? Any planned neighborhood developments (good or bad) we should know about?
- What's the average days-on-market for RENTAL listings here right now (not sales)? A rising rental-DOM trend means longer vacancies and softer asking-rent achievability than the comps imply.
- What's the recent tenant-quality profile in this submarket — average credit score on applications, eviction rate, late-payment / NSF rate, and stable-employment percentage? A property-management company in the area should have these aggregated.
- How much new for-sale + rental construction is in the pipeline within 1–3 miles? Heavy new supply typically softens prices + rents 12–24 months out; constrained supply supports both.
Investment metrics
- 1% rule
- 1.07% ✓
- Cap rate
- 8.51%
- Cash-on-cash
- 7.92%
- DSCR
- 1.35
- GRM
- 7.8
CMA / ARV
- ARV (on-the-fly)
- $140,714
- Comps found
- 12
Show comp detail 12 sales within ~0.75 mi
| Address | Dist | Beds/Ba | Sqft | Sold | Price | $/sf | Match |
|---|---|---|---|---|---|---|---|
| 2103 11th Ave | 0.06mi | 2/1.0 (-1) | 983 (-7%) | 9mo | $69,990 | $71 | 73 |
| 1114 Main St | 0.04mi | 4/2.0 (+1) | 1,171 (+11%) | 1mo | $88,000 | $75 | 70 |
| 2114 Lone Star St | 0.38mi | 3/2.0 | 1,056 (-0%) | 12mo | $199,000 | $188 | 68 |
| 1414 Sycamore St | 0.37mi | 2/1.0 (-1) | 1,120 (+6%) | 10mo | $110,000 | $98 | 60 |
| 523 Main St | 0.44mi | 2/1.0 (-1) | 1,008 (-5%) | 10mo | $132,000 | $131 | 58 |
| 1009 Larcom St | 0.50mi | 2/1.0 (-1) | 1,096 (+4%) | 12mo | $169,999 | $155 | 56 |
| 1503 Main St | 0.29mi | 2/1.0 (-1) | 1,182 (+12%) | 8mo | $225,000 | $190 | 56 |
| 908 Howell Ave | 0.66mi | 2/1.5 (-1) | 1,052 (-1%) | 13mo | $149,900 | $142 | 50 |
| 1306 Laurel St | 0.46mi | 3/1.0 | 1,194 (+13%) | 9mo | $87,500 | $73 | 50 |
| 1401 Sycamore St | 0.41mi | 2/2.0 (-1) | 979 (-8%) | 14mo | $125,000 | $128 | 48 |
| 801 Stubbs St | 0.66mi | 3/2.0 | 963 (-9%) | 6mo | $175,000 | $182 | 45 |
| 1918 Colonial St St | 0.72mi | 3/2.0 | 1,205 (+14%) | 13mo | $159,995 | $133 | 28 |
Match score weights: distance 35% · size 25% · config 20% · recency 20%. Top-matched comps best support the ARV.
Projected returns pro-forma
-3.0% appreciation · 3.95% rent growth · sell at horizon
- IRR
- -5.7%
- Equity multiple
- 0.78×
- Total profit
- $-9,594
- Equity at exit
- $23,707
- IRR
- 5.1%
- Equity multiple
- 1.39×
- Total profit
- $17,338
- Equity at exit
- $13,747
Cash invested: $44,520 (down + closing). Projections, not guarantees.
Landlord ↔ Tenant lean methodology
- Overall (STATE)
- 87 Strongly Landlord-Friendly
- State Texas
- 87 Strongly Landlord-Friendly · R+5
- County
- — inherits STATE
- City
- — inherits STATE
ZIP-level market 77568
- Home prices YoY
- -22.7%
- Rents YoY
- 4.0%
- Active inventory
- 654
- Price-to-rent
- 7.8×
Monthly cashflow live
- Estimated rent
- $1,705 high interval (Pro) →
- Mortgage (P&I)
- −$834
- Tax from tax record
- −$153 /mo · $1,835/yr
- Insurance
- −$66
- Flood insurance flood zone
- −$66 /mo · $798/yr
- HOA
- −$0
- Vacancy / Maint / Mgmt
- −$358
- Net cashflow
- $227
Break-even live
UW: 25.0% down · 7.5% · 30yr · 1.5% tax · 5.0% vac · 8.0% maint · 8.0% mgmt
Financing live
Cash to close
- Down payment
- $39,750
- Closing costs
- $4,770
- Reserves months
- —
- Total cash needed
- —
Loan-product check · same deal, 3 products live
Conventional
25% down · 7.5% · 30yr
- Down + closing
- —
- Monthly P&I
- —
- Monthly cashflow
- —
- DSCR
- —
- Eligible?
- —
Personal DTI + credit; lowest rate.
DSCR
20% down · 8.5% · 30yr
- Down + closing
- —
- Monthly P&I
- —
- Monthly cashflow
- —
- DSCR
- —
- Eligible?
- —
No personal income docs; deal must DSCR.
Hard money
10% down · 12.0% · 12mo
- Down + closing
- —
- Monthly P&I
- —
- Monthly cashflow
- —
- DSCR
- —
- Eligible?
- —
Short-term bridge; refi at stabilization.
Rent comps 9 comps
| Address | Beds | Baths | Sqft | Rent | $/sqft | DOM | Units | Dist |
|---|---|---|---|---|---|---|---|---|
| 1825 Bayou Rd La Marque, TX | 2.0 | 1.0 | 1200 | $1,195 | $1.00 | 43d | 1 | 0.65mi |
| 222 Ruslee St La Marque, TX | 3.0 | 1.0 | 849 | $1,350 | $1.59 | 16d | 1 | 0.76mi |
| 105 Plum St La Marque, TX | 4.0 | 1.5 | 1329 | $2,100 | $1.58 | 3d | 1 | 0.77mi |
| 711 Avenue A Unit 4 La Marque, TX | 2.0 | 1.0 | 750 | $799 | $1.07 | 43d | 1 | 1.09mi |
| 509 Bluebonnet Dr La Marque, TX | 4.0 | 1.0 | 1223 | $1,550 | $1.27 | 43d | 1 | 1.10mi |
| 1013 Margot St La Marque, TX | 3.0 | 2.0 | 1099 | $1,500 | $1.36 | 18d | 1 | 1.42mi |
| 2729 Main St La Marque, TX | 2.0 | 1.0–2.0 | 864 | $950 | $1.10 | 1d | 3 | 1.47mi |
| 2328 Boss St La Marque, TX | 2.0 | 1.0 | 848 | $925 | $1.09 | 12d | 2 | 1.47mi |
| 203 Beatrice St La Marque, TX | 3.0 | 1.0 | 1304 | $1,395 | $1.07 | 24d | 1 | 1.47mi |
Listing history 6 events
-
2026-06-18days on market $159,000 Active 6 DOM
-
2026-06-17days on market $159,000 Active 5 DOM
-
2026-06-16days on market $159,000 Active 4 DOM
-
2026-06-15days on market $159,000 Active 3 DOM
-
2026-06-13remarks 693-char remark
-
2026-06-13$159,000 Active 1 DOM
ⓘ Source: listings_history table (triggers on properties + properties_extension) + one-shot
backfill from property_details.listing_events for pre-trigger history.
Tax reassessment forecast TX · Resets to sale price
- Current annual tax
- $1,835 · $153/mo
- Projected year-2 tax
- $2,910 · $242/mo
- Expected delta
- +$1,075/yr (+$90/mo · 58.6%)
ⓘ Screening estimate from a state-policy table — verify with the county assessor before closing.
Climate risk First Street
- Flood 7/10 Severe FEMA zone X · 60% chance over 30 yrs
- Wildfire 2/10 Low
- Heat 10/10 Extreme 7 d/yr ≥109°F today · 27 d/yr by 30 yrs out
- Wind 10/10 Extreme 99% chance of damaging wind over 30 yrs
- Air quality 3/10 Moderate 2 unhealthy d/yr today · 2 by 30 yrs out
Nearby sold comps map
Loading sold comps map…
Walkable amenities ~0.75 mi
Loading nearby amenities…
Taxation est. · year 1
- Rental income
- $20,459
- − Mortgage interest
- −$8,906
- − Property taxes
- −$1,835
- − Insurance
- −$1,592
- − Repairs & maintenance
- −$1,637
- − Management
- −$1,637
- − Depreciation
- −$4,625
- Taxable income
- $226
- Est. tax owed @ 24.0%
- −$54
- After-tax cash flow
- $2,675/yr
For passive investors: Depreciation is non-cash, so a rental often shows a tax loss while cash-flowing — sheltering income. Rental losses are passive: they offset passive income freely, and up to $25,000/yr can offset ordinary (W-2) income if you actively participate and your MAGI is under $100k (phasing out to $0 by $150k); unused losses carry forward. On sale, claimed depreciation is recaptured at up to 25%, and gains may owe capital-gains tax (a 1031 exchange can defer both). Figures are a year-1 estimate at your 24.0% rate — not tax advice; consult a CPA.
Schools (NCES district)
- District
- Texas City ISD
- NCES district ID
- 4842510
- Math proficiency
- 28% ▼ -10.00%
- Reading proficiency
- 29% ▼ -4.00%
- Median HH income
- $44,875
- Composite
- 24.47/100
- National rank
- #7664
- State rank
- #655 of 826 in TX
Livability — La Marque
- Score
- 59/100
- State rank
- #1136
- US rank
- #20037
Category grades
Schools grade is shown separately in the Schools card above.
Census & demographics
- Census place
- La Marque, TX
- County
- Galveston County · 357,330 people
- City population
- 23,083
- Metro
- Houston-The Woodlands-Sugar Land, TX
- Population (ZIP)
- 23,083
- Household income
- $74,694
- Rent vs Own
- Severe rent burden
- 700.0
Population outlook (Galveston County) Hauer SSP2
- Today (2025)
- 390,640 people
- By 2030
- 425,226 · +8.9%
- By 2040
- 493,765 · +26.4%
- By 2050
- 559,698 · +43.3%
- By 2075
- 719,260 · +84.1%
- By 2100
- 819,628 · +109.8%
Race, ethnicity, and origin ACS 2023
- Neighborhood character
- Highly diverse neighborhood (Simpson 0.71)
- Race & ethnicity
- White 37% Hispanic / Latino 29% Black 26% Two or more races 17% Asian 3%
- Hispanic origin (detail)
- Mexican 22% Puerto Rican 1%
- Common ancestry
- Lithuanian 1% Italian 1% Serbian 1%
- Foreign-born
- 8% · Canada
- Languages at home
- 77% English-only · Spanish 21% Tagalog/Filipino 1% Other Asian/Pacific 1%
Political lean MEDSL · Galveston
- 2024 margin
- Strong R (+27.4) · D 35.7% · R 63.1% · Other 1.2%
- 2008→2024 swing
- -7.9pp toward R · 2008: -19.5pp · 2024: -27.4pp
- All cycles
- 2024: R+27.4 2020: R+22.6 2016: R+22.6 2012: R+26.9 2008: R+19.5
Not yet ingested
- Civics
- —
Market trends
- HPI YoY
- ▼ -69.39%
- Current HPI
- 236.0239
- Rent YoY
- ▲ 3.95%
- Metro
- Houston-The Woodlands-Sugar Land, TX
- State GDP YoY
- ▲ 3.95%
- F500 in state
- 110
Industry mix (Fortune 500 HQ in TX)
| Industry | F500 HQs | Revenue |
|---|---|---|
| Energy | 16 | $1,198B |
|
||
| Technology | 5 | $198B |
|
||
| Engineering / Construction | 4 | $72B |
|
||
| Energy Services | 3 | $60B |
|
||
| Utilities | 3 | $41B |
|
||
| Healthcare | 2 | $330B |
|
||
Price history
+59.8% since first listed8 events — show timeline
- 2026-06-12 Listed $159,000 HARMLS
- 2017-05-23 Sold (Public Records) — Public Records
- 2017-05-15 Sold (MLS) — HARMLS
- 2017-04-23 Pending — HARMLS
- 2017-04-09 Pending — HARMLS
- 2017-04-05 Listed $99,500 HARMLS
- 2008-06-03 Sold (Public Records) — Public Records
- 1996-06-06 Sold (Public Records) — Public Records
Property tax history
+3.8%/yrLatest (2025): $1,835 · +13.3% YoY. Source: county tax records.
Cash-flow waterfall
monthlySold comps — $/sqft
last 12 mo · ≤1 miLoading sold comps…