 🏗️ New Construction
146 Oaks Rd · Russell Springs, KY
Flood risk No data
- FEMA flood zone
- —
- Chance of flooding over 30 yrs
- —
- Est. flood insurance / yr
- —
Fire risk No data
- Est. fire insurance / yr
- —
Heat risk No data
- Hot days now (above threshold)
- —
- Hot days in 30 yrs
- —
Wind risk No data
- Chance of severe wind over 30 yrs
- —
Air-quality risk No data
- Unhealthy air days now
- —
- Unhealthy air days in 30 yrs
- —
Risk factors via First Street. Map © Google.
Why this score? — see what drove the C- grade
The composite is a weighted blend of 9 inputs, each scored 0–100. Each bar is that input's sub-score; the figure is the points it added to the 100-point composite (weight × sub-score).
- Cash flow +20.7/30.0
- ARV discount +7.5/15.0
- DSCR +6.6/10.0
- 1% rule +5.5/10.0
- Condition / age +3.8/5.0
- Livability +3.5/5.0
- Rent growth +2.5/5.0
- Schools +2.3/10.0
- Appreciation +0.0/10.0
$104,900
🖨 Deal sheet (PDF) 📄 Offer letter ✓ Due diligence
Listing remarks
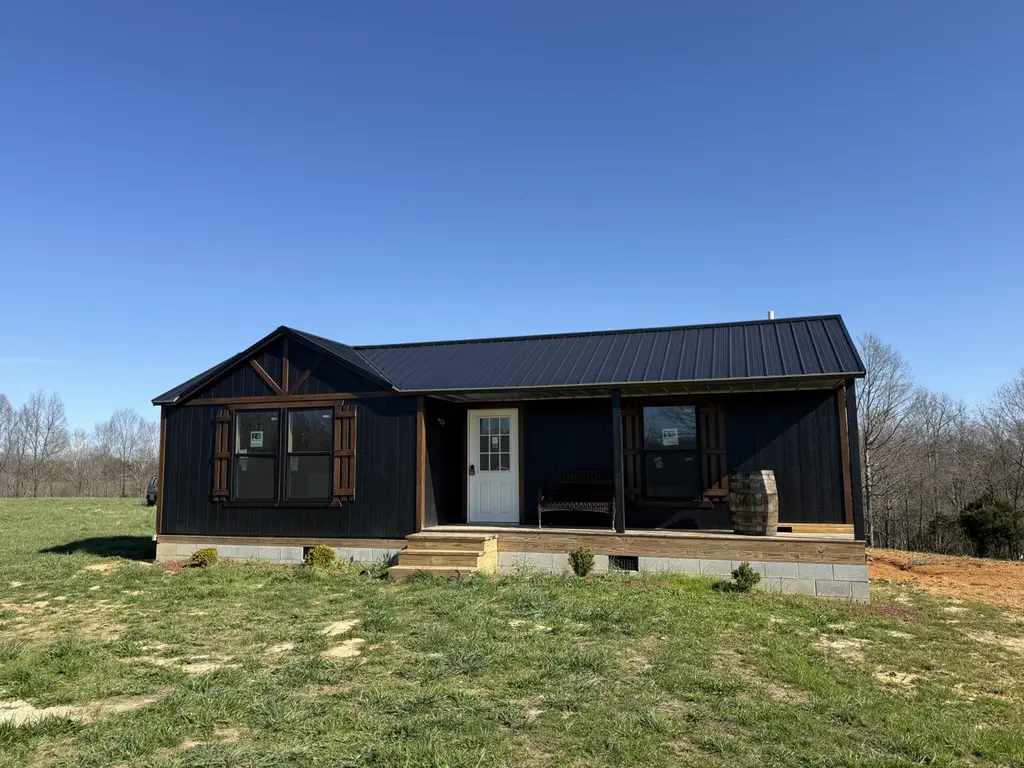
Discover the charm of country living in this beautifully crafted new construction home, perfectly situated on a spacious half-acre lot. Designed with both style and efficiency in mind, this smaller floor plan offers comfortable living without sacrificing modern appeal. From the moment you arrive, the home's inviting curb appeal stands out, featuring clean lines, fresh finishes, and a welcoming covered front porch providing a relaxing outdoor entertaining space. Inside, you'll find a small-square-foot layout that maximizes every inch of space, making it both practical and comfortable for everyday living. This home is ideal for those seeking low-maintenance living and affordability without co
Key facts
- Covered front porch
- Half-acre lot
- New construction
Tags
Property features AI
Finance
- Other: Lot is approximately 0.5 acre (public records); Building area listed as 455
Exterior
- Parking: Driveway; Off-street parking
- Utilities: Public water connected; Septic tank; Electricity connected
- Home design: One-story cabin; New construction
- Construction: Block foundation; Built as new construction
- Exterior features: Metal roof; Wood siding
Interior
- Kitchen: Dishwasher; Range
- Bedrooms: 4 rooms total (includes bedrooms and other living spaces)
- Flooring: Laminate flooring
- Bathrooms: 1 full bathroom
- Heating & cooling: Ductless heating; Ductless cooling
- Interior features: Insulated windows with screens; Crawl space foundation access; No fireplace
- Laundry & utility: Washer hookup; Electric dryer hookup
Neighborhood map
What this means for you Summary
Snapshot
- This is a 1-bed/1.0-bath single-family listed at $105k. Condition is rated good.
Deal economics
- At list price, monthly cash flow is $141 ($2k/yr) — positive.
- The deal already cash-flows at list — no discount required.
- Meets the 1% rule at list price ($1k rent vs $105k).
- Recommended offer: $99k (6.0% below list) — sets the bar for market timing.
- Cap rate 7.9% vs local median 4.3% in Russell Springs — top-decile yield for the area; either an underpriced asset or a hidden risk that comps aren't pricing in. Stress-test before assuming the spread holds.
Location & tenants
- Location reads 69/100 on livability (#181 in KY) — a middle-class / working-renter tenant base. Strengths: crime A+, cost of living A+, housing A+; Watch: amenities F, commute F, employment F.
- Adair County (town): math 22% / reading 35% proficiency, ranked #124 of 165 in KY (top 75%) — low school quality limits family demand, transient renter base, plan for 1-2y turnover.
- Zoned schools: Adair County Primary Center (647 students, 70% FRL); Adair County Middle School (math 24% / reading 39%, grade F, #125 of 217 statewide, top 63%, 598 students, 69% FRL); Adair County High School (math 27% / reading 37%, grade F, #97 of 254 statewide, top 46%, 791 students, 63% FRL) — zoned schools average 67% FRL vs 52% district-wide (15 pts higher); higher-poverty schools than district average — tighter screening recommended.
- Market conditions: 223 active listings in the ZIP; 1 units permitted in Adair County in 2024 (0 in 5+ unit buildings).
Forward outlook
- Local home prices are declining (-3.0%/yr); year-one equity from $725 of loan paydown is wiped out by about $3k of value loss. Plan a longer hold.
- Adair County population projected at +9% by 2050 — modest demand growth; plan on rents tracking national, not racing it.
Negotiation context
- It's been on market 89 days — a 6% lower offer ($99k) is reasonable based on typical stale-listing flexibility.
Questions for the listing agent
- It's been on market 89 days. Have you received any prior offers? Is the seller open to a 6% concession, seller financing, or rate buy-down credit?
- Why hasn't it sold? Are there any deal-killer items the seller is aware of (foundation, flood, title, zoning, code violations)?
- Is there a deadline driving the sale (1031 exchange, divorce, estate, relocation)? That informs how much negotiation room exists.
- Schools are D-rated, which usually means shorter tenancies and higher turnover. Who's the typical renter profile here, and what's been the actual vacancy rate?
- What's the average days-on-market for RENTAL listings here right now (not sales)? A rising rental-DOM trend means longer vacancies and softer asking-rent achievability than the comps imply.
- What's the recent tenant-quality profile in this submarket — average credit score on applications, eviction rate, late-payment / NSF rate, and stable-employment percentage? A property-management company in the area should have these aggregated.
- How much new for-sale + rental construction is in the pipeline within 1–3 miles? Heavy new supply typically softens prices + rents 12–24 months out; constrained supply supports both.
Investment metrics
- 1% rule
- 1.05% ✓
- Cap rate
- 7.91%
- Cash-on-cash
- 5.77%
- DSCR
- 1.26
- GRM
- 8.0
CMA / ARV
No comps found within radius.
Projected returns pro-forma
-3.0% appreciation · 3.0% rent growth · sell at horizon
- IRR
- -7.4%
- Equity multiple
- 0.73×
- Total profit
- $-7,991
- Equity at exit
- $15,641
- IRR
- 2.2%
- Equity multiple
- 1.16×
- Total profit
- $4,687
- Equity at exit
- $9,070
Cash invested: $29,372 (down + closing). Projections, not guarantees.
Landlord ↔ Tenant lean methodology
- Overall (STATE)
- 83 Strongly Landlord-Friendly
- State Kentucky
- 83 Strongly Landlord-Friendly · R+16
- County
- — inherits STATE
- City
- — inherits STATE
ZIP-level market 42642
- Home prices YoY
- -25.3%
- Active inventory
- 223
- Price-to-rent
- 8.0×
Monthly cashflow live
- Estimated rent
- $1,096 medium interval (Pro) →
- Mortgage (P&I)
- −$550
- Tax est. 1.5%
- −$131 /mo · $1,574/yr
- Insurance
- −$44
- HOA
- −$0
- Lot rent
- −$0
- Vacancy / Maint / Mgmt
- −$230
- Net cashflow
- $141
Break-even live
Sensitivity live
| Price | -10% $214 | -5% $177 | +0% $141 | +5% $105 | +10% $69 |
|---|---|---|---|---|---|
| Rent | -10% $55 | -5% $98 | +0% $141 | +5% $184 | +10% $228 |
| Rate | -1.0pp $194 | -0.5pp $168 | base $141 | +0.5pp $114 | +1.0pp $86 |
UW: 25.0% down · 7.5% · 30yr · 1.5% tax · 5.0% vac · 8.0% maint · 8.0% mgmt
Financing live
Cash to close
- Down payment
- $26,225
- Closing costs
- $3,147
- Reserves months
- —
- Total cash needed
- —
Loan-product check · same deal, 3 products live
Conventional
25% down · 7.5% · 30yr
- Down + closing
- —
- Monthly P&I
- —
- Monthly cashflow
- —
- DSCR
- —
- Eligible?
- —
Personal DTI + credit; lowest rate.
DSCR
20% down · 8.5% · 30yr
- Down + closing
- —
- Monthly P&I
- —
- Monthly cashflow
- —
- DSCR
- —
- Eligible?
- —
No personal income docs; deal must DSCR.
Hard money
10% down · 12.0% · 12mo
- Down + closing
- —
- Monthly P&I
- —
- Monthly cashflow
- —
- DSCR
- —
- Eligible?
- —
Short-term bridge; refi at stabilization.
Listing history 19 events
-
2026-06-22days on market $104,900 Active 89 DOM
-
2026-06-21days on market $104,900 Active 88 DOM
-
2026-06-21days on market $104,900 Active 87 DOM
-
2026-06-18days on market $104,900 Active 85 DOM
-
2026-06-17days on market $104,900 Active 84 DOM
-
2026-06-16days on market $104,900 Active 83 DOM
-
2026-06-15days on market $104,900 Active 82 DOM
-
2026-06-13days on market $104,900 Active 80 DOM
-
2026-06-12days on market $104,900 Active 79 DOM
-
2026-06-09days on market $104,900 Active 76 DOM
-
2026-06-08days on market $104,900 Active 75 DOM
-
2026-06-07days on market $104,900 Active 74 DOM
-
2026-06-07days on market $104,900 Active 73 DOM
-
2026-06-04days on market $104,900 Active 70 DOM
-
2026-06-02days on market $104,900 Active 69 DOM
-
2026-06-01days on market $104,900 Active 68 DOM
-
2026-05-31days on market $104,900 Active 67 DOM
-
2026-05-31days on market $104,900 Active 66 DOM
-
2026-03-24$104,900 Active
ⓘ Source: listings_history table (triggers on properties + properties_extension) + one-shot
backfill from property_details.listing_events for pre-trigger history.
Nearby sold comps map
Loading sold comps map…
Walkable amenities ~0.75 mi
Loading nearby amenities…
Taxation est. · year 1
- Rental income
- $13,156
- − Mortgage interest
- −$5,876
- − Property taxes
- −$1,574
- − Insurance
- −$524
- − Repairs & maintenance
- −$1,052
- − Management
- −$1,052
- − Depreciation
- −$3,052
- Taxable income
- $25
- Est. tax owed @ 24.0%
- −$6
- After-tax cash flow
- $1,688/yr
For passive investors: Depreciation is non-cash, so a rental often shows a tax loss while cash-flowing — sheltering income. Rental losses are passive: they offset passive income freely, and up to $25,000/yr can offset ordinary (W-2) income if you actively participate and your MAGI is under $100k (phasing out to $0 by $150k); unused losses carry forward. On sale, claimed depreciation is recaptured at up to 25%, and gains may owe capital-gains tax (a 1031 exchange can defer both). Figures are a year-1 estimate at your 24.0% rate — not tax advice; consult a CPA.
Condition & rehab AI · 13 photos
This beautifully crafted new construction home offers a good condition with recent updates, making it move-in ready and ideal for both resale and rental.
Value-add opportunities
- Both Painting exterior — Enhances curb appeal and value
- Both Landscaping — Improves curb appeal and enhances property value
- Both Install new outdoor lighting — Enhances safety and curb appeal
Renovation cost estimate screening
Value-add ROI direction
- Both Painting exterior — Enhances curb appeal and value ↑
- Both Landscaping — Improves curb appeal and enhances property value ↑
- Both Install new outdoor lighting — Enhances safety and curb appeal ↑
ⓘ Cost ranges are severity-bucket heuristics (US national rule-of-thumb). Get contractor quotes + a written scope before underwriting a rehab budget.
Schools (NCES district)
- District
- Adair County
- NCES district ID
- 2100030
- Math proficiency
- 22% ▼ -28.00%
- Reading proficiency
- 35% ▼ -19.00%
- Median HH income
- $33,174
- Composite
- 23.3/100
- National rank
- #7921
- State rank
- #124 of 165 in KY
Livability — Russell Springs
- Score
- 69/100
- State rank
- #181
- US rank
- #9030
Category grades
Schools grade is shown separately in the Schools card above.
Census & demographics
- Population (ZIP)
- 12,951
Population outlook (Adair County) Hauer SSP2
- Today (2025)
- 20,359 people
- By 2030
- 20,856 · +2.4%
- By 2040
- 21,678 · +6.5%
- By 2050
- 22,107 · +8.6%
- By 2075
- 22,740 · +11.7%
- By 2100
- 21,840 · +7.3%
Race, ethnicity, and origin ACS 2023
- Neighborhood character
- Predominantly White (91%)
- Race & ethnicity
- White 91% Hispanic / Latino 6% Two or more races 4%
- Hispanic origin (detail)
- Mexican 5%
- Common ancestry
- Slovak 1% Lithuanian 1% Italian 1%
- Foreign-born
- 2% · Canada
- Languages at home
- 94% English-only · Spanish 5% German/W. Germanic 1%
Political lean MEDSL · Adair
- 2024 margin
- Solid R (+71.2) · D 14.0% · R 85.2%
- 2008→2024 swing
- -18.5pp toward R · 2008: -52.7pp · 2024: -71.2pp
- All cycles
- 2024: R+71.2 2020: R+67.1 2016: R+64.6 2012: R+55.0 2008: R+52.7
Not yet ingested
- Civics
- —
Market trends
- HPI YoY
- ▼ -80.33%
- Current HPI
- 237.5038
- Rent YoY
- —
- Metro
- —
- State GDP YoY
- ▲ 1.81%
- F500 in state
- 4
Industry mix (Fortune 500 HQ in KY)
| Industry | F500 HQs | Revenue |
|---|---|---|
| Healthcare | 1 | $118B |
|
||
| Food / Beverage | 1 | $7B |
|
||
Price history
1 event — show timeline
- 2026-03-24 Listed $104,900 ImagineMLS
Cash-flow waterfall
monthlySold comps — $/sqft
last 12 mo · ≤1 miLoading sold comps…