792 Cottonwood Ln · Port Angeles East, WA
Flood risk 1/10 · Minimal
- FEMA flood zone
- X
- Chance of flooding over 30 yrs
- 0.0%
- Est. flood insurance / yr
- $507 – $1,088
Fire risk 2/10 · Minimal
- Est. fire insurance / yr
- $604 – $1,122
Heat risk 1/10 · Minimal
- Hot days now (above 83°F)
- 7 days/yr
- Hot days in 30 yrs
- 14 days/yr
Wind risk 1/10 · Minimal
- Chance of severe wind over 30 yrs
- —
Air-quality risk 6/10 · Moderate
- Unhealthy air days now
- 8 days/yr
- Unhealthy air days in 30 yrs
- 9 days/yr
Risk factors via First Street. Map © Google.
Why this score? — see what drove the C+ grade
The composite is a weighted blend of 9 inputs, each scored 0–100. Each bar is that input's sub-score; the figure is the points it added to the 100-point composite (weight × sub-score).
- Cash flow +25.7/30.0
- DSCR +8.6/10.0
- ARV discount +7.5/15.0
- 1% rule +5.8/10.0
- Schools +5.2/10.0
- Livability +3.8/5.0
- Rent growth +2.5/5.0
- Condition / age +2.5/5.0
- Appreciation +0.0/10.0
$185,000
🖨 Deal sheet 📄 Offer letter ✓ Due diligence
Listing remarks MLS
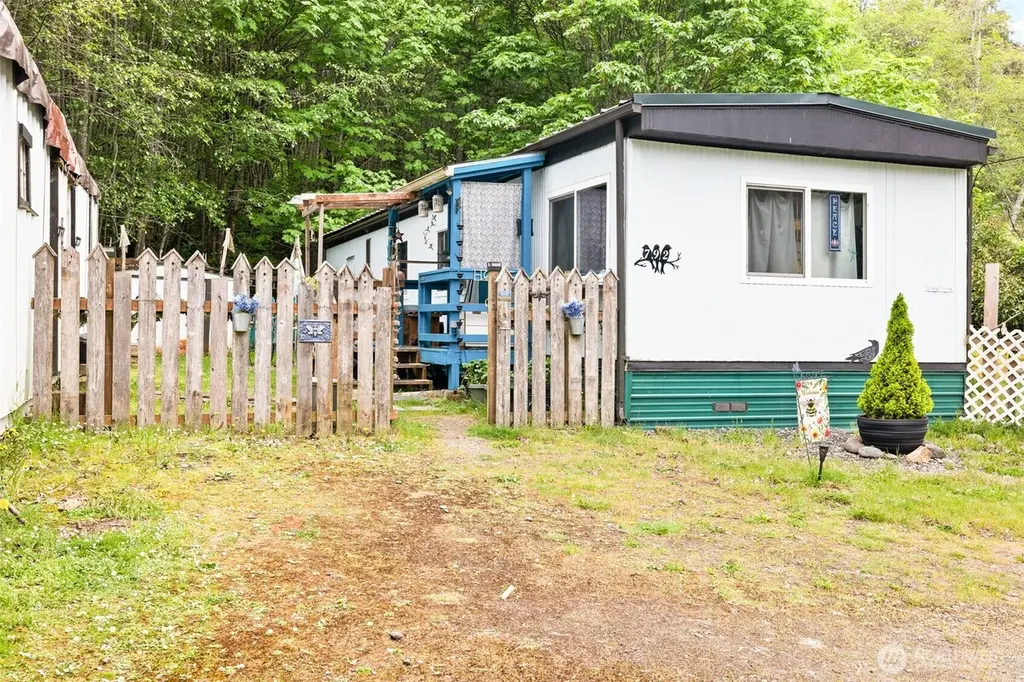
Nice 2 bedroom, 1 bath, 728 sf. home on . 27 acre lot and an additional . 36 acre lot. There is a large living room and eat-in kitchen. Enjoy plenty of privacy and a rural setting, yet minutes from Port Angeles. Fishing and the Dungeness Trail is within walking distance. Plenty of room for RV Parking too! Don't miss this great property!
Key facts
- Shipping container
- Large driveway
- Metal roof
Tags
Property features AI
Exterior
- Utilities: Septic tank sewer
- Home design: Manufactured home (residential); One story
- Construction: Metal siding construction
- Exterior features: Level to sloped, irregular lot; Located in Four Seasons Park subdivision
Interior
- Bathrooms: One full bathroom
- Interior features: Single-story interior
Neighborhood map
What this means for you Summary
Snapshot
- This is a 2-bed/1.0-bath manufactured listed at $185k.
Deal economics
- At list price, monthly cash flow is $445 ($5k/yr) — positive.
- The deal already cash-flows at list — no discount required.
- Meets the 1% rule at list price ($2k rent vs $185k).
- Recommended offer: $182k (1.5% below list) — sets the bar for market timing.
- Cap rate 9.2% vs local median 1.5% in Port Angeles East — top-decile yield for the area; either an underpriced asset or a hidden risk that comps aren't pricing in. Stress-test before assuming the spread holds.
Location & tenants
- Location reads 75/100 on livability (#162 in WA, #3,899 nationally) — a middle-class / working-renter tenant base. Strengths: commute A+, housing A+, cost of living A-; Watch: employment D+, health & safety D, schools F.
- Port Angeles School District (town): math 55% / reading 65% proficiency, ranked #70 of 291 in WA (top 24%) — acceptable for families but not a draw, mixed tenant base, ~2y average lease.
- Market conditions: 268 active listings in the ZIP; 1 comparable units currently listed for rent nearby; 166 units permitted in Clallam County in 2024 (0 in 5+ unit buildings).
Forward outlook
- Local home prices are declining (-3.0%/yr); year-one equity from $1k of loan paydown is wiped out by about $6k of value loss. Plan a longer hold.
- Clallam County population projected at +5% by 2050 — modest demand growth; plan on rents tracking national, not racing it.
Negotiation context
- It's been on market 27 days — a 2% lower offer ($182k) is reasonable based on typical stale-listing flexibility.
- 3 sale attempts since 5y ago with the ask held roughly flat each time — persistent listings suggest the price (not the market) is what's stuck; bring a comps-based counter.
Questions for the listing agent
- Built in 1977 — when were the roof, HVAC, electrical panel, plumbing, and water heater last replaced?
- Is there a deadline driving the sale (1031 exchange, divorce, estate, relocation)? That informs how much negotiation room exists.
- Schools are F-rated, which usually means shorter tenancies and higher turnover. Who's the typical renter profile here, and what's been the actual vacancy rate?
- What's the average days-on-market for RENTAL listings here right now (not sales)? A rising rental-DOM trend means longer vacancies and softer asking-rent achievability than the comps imply.
- What's the recent tenant-quality profile in this submarket — average credit score on applications, eviction rate, late-payment / NSF rate, and stable-employment percentage? A property-management company in the area should have these aggregated.
- How much new for-sale + rental construction is in the pipeline within 1–3 miles? Heavy new supply typically softens prices + rents 12–24 months out; constrained supply supports both.
Investment metrics
- 1% rule
- 1.08% ✓
- Cap rate
- 9.18%
- Cash-on-cash
- 10.32%
- DSCR
- 1.46
- GRM
- 7.7
CMA / ARV
No comps found within radius.
Projected returns pro-forma
-3.0% appreciation · 3.0% rent growth · sell at horizon
- IRR
- -0.8%
- Equity multiple
- 0.97×
- Total profit
- $-1,665
- Equity at exit
- $27,584
- IRR
- 8.8%
- Equity multiple
- 1.67×
- Total profit
- $34,846
- Equity at exit
- $15,995
Cash invested: $51,800 (down + closing). Projections, not guarantees.
Landlord ↔ Tenant lean methodology
- Overall (STATE)
- 28 Tenant-Leaning
- State Washington
- 28 Tenant-Leaning · D+8
- County
- — inherits STATE
- City
- — inherits STATE
ZIP-level market 98362
- Active inventory
- 268
- Price-to-rent
- 7.7×
Monthly cashflow live
- Estimated rent
- $2,000 medium interval (Pro) →
- Mortgage (P&I)
- −$970
- Tax from tax record
- −$87 /mo · $1,048/yr
- Insurance
- −$77
- HOA
- −$0
- Vacancy / Maint / Mgmt
- −$420
- Net cashflow
- $445
Break-even live
UW: 25.0% down · 7.5% · 30yr · 1.5% tax · 5.0% vac · 8.0% maint · 8.0% mgmt
Financing live
Cash to close
- Down payment
- $46,250
- Closing costs
- $5,550
- Reserves months
- —
- Total cash needed
- —
Loan-product check · same deal, 3 products live
Conventional
25% down · 7.5% · 30yr
- Down + closing
- —
- Monthly P&I
- —
- Monthly cashflow
- —
- DSCR
- —
- Eligible?
- —
Personal DTI + credit; lowest rate.
DSCR
20% down · 8.5% · 30yr
- Down + closing
- —
- Monthly P&I
- —
- Monthly cashflow
- —
- DSCR
- —
- Eligible?
- —
No personal income docs; deal must DSCR.
Hard money
10% down · 12.0% · 12mo
- Down + closing
- —
- Monthly P&I
- —
- Monthly cashflow
- —
- DSCR
- —
- Eligible?
- —
Short-term bridge; refi at stabilization.
Rent comps 1 comps
| Address | Beds | Baths | Sqft | Rent | $/sqft | DOM | Units | Dist |
|---|---|---|---|---|---|---|---|---|
| 2938 E Walnut St Unit 5 Port Angeles, WA | 2.0 | 1.0 | 740 | $2,000 | $2.70 | 43d | 1 | 1.05mi |
Listing history 13 events
-
2026-06-07statusdays on market $185,000 Pending 27 DOM
-
2026-06-03days on market $185,000 Active 25 DOM
-
2026-06-02pricedays on market $185,000 Active 24 DOM
-
2026-06-01days on market $192,000 Active 23 DOM
-
2026-05-31days on market $192,000 Active 22 DOM
-
2026-05-09$192,000 Active
-
2026-05-09$192,000 Active 886-char remark
-
2022-03-28soldstatus $172,000 Closed
Show marketing remark (339 chars)
Nice 2 bedroom, 1 bath, 728 sf. home on . 27 acre lot and an additional . 36 acre lot. There is a large living room and eat-in kitchen. Enjoy plenty of privacy and a rural setting, yet minutes from Port Angeles. Fishing and the Dungeness Trail is within walking distance. Plenty of room for RV Parking too! Don't miss this great property!
-
2022-03-28soldstatus $172,000 339-char remark
Show marketing remark (339 chars)
Nice 2 bedroom, 1 bath, 728 sf. home on . 27 acre lot and an additional . 36 acre lot. There is a large living room and eat-in kitchen. Enjoy plenty of privacy and a rural setting, yet minutes from Port Angeles. Fishing and the Dungeness Trail is within walking distance. Plenty of room for RV Parking too! Don't miss this great property!
-
2022-03-28soldstatus $172,000
Show marketing remark (339 chars)
Nice 2 bedroom, 1 bath, 728 sf. home on . 27 acre lot and an additional . 36 acre lot. There is a large living room and eat-in kitchen. Enjoy plenty of privacy and a rural setting, yet minutes from Port Angeles. Fishing and the Dungeness Trail is within walking distance. Plenty of room for RV Parking too! Don't miss this great property!
-
2021-11-04status Pending
-
2021-10-28$172,900 Active
-
2013-02-01soldstatus $38,000
ⓘ Source: listings_history table (triggers on properties + properties_extension) + one-shot
backfill from property_details.listing_events for pre-trigger history.
Tax reassessment forecast WA · Resets to sale price
- Current annual tax
- $1,048 · $87/mo
- Projected year-2 tax
- $1,813 · $151/mo
- Expected delta
- +$765/yr (+$64/mo · 73.1%)
ⓘ Screening estimate from a state-policy table — verify with the county assessor before closing.
Climate risk First Street
- Flood 1/10 Low FEMA zone X · 0% chance over 30 yrs
- Wildfire 2/10 Low
- Heat 1/10 Low 7 d/yr ≥83°F today · 14 d/yr by 30 yrs out
- Wind 1/10 Low
- Air quality 6/10 Major 8 unhealthy d/yr today · 9 by 30 yrs out
Nearby sold comps map
Loading sold comps map…
Walkable amenities ~0.75 mi
Loading nearby amenities…
Taxation est. · year 1
- Rental income
- $24,000
- − Mortgage interest
- −$10,363
- − Property taxes
- −$1,048
- − Insurance
- −$925
- − Repairs & maintenance
- −$1,920
- − Management
- −$1,920
- − Depreciation
- −$5,382
- Taxable income
- $2,443
- Est. tax owed @ 24.0%
- −$586
- After-tax cash flow
- $4,759/yr
For passive investors: Depreciation is non-cash, so a rental often shows a tax loss while cash-flowing — sheltering income. Rental losses are passive: they offset passive income freely, and up to $25,000/yr can offset ordinary (W-2) income if you actively participate and your MAGI is under $100k (phasing out to $0 by $150k); unused losses carry forward. On sale, claimed depreciation is recaptured at up to 25%, and gains may owe capital-gains tax (a 1031 exchange can defer both). Figures are a year-1 estimate at your 24.0% rate — not tax advice; consult a CPA.
Schools (NCES district)
- District
- Port Angeles School District
- NCES district ID
- 5306820
- Math proficiency
- 55% ▬ 0.00%
- Reading proficiency
- 65% ▲ 1.00%
- Median HH income
- $46,594
- Composite
- 52.34/100
- National rank
- #3432
- State rank
- #70 of 291 in WA
Livability — Port Angeles East
- Score
- 75/100
- State rank
- #162
- US rank
- #3899
Category grades
Schools grade is shown separately in the Schools card above.
Census & demographics
- Census place
- Port Angeles East, WA
- Population (ZIP)
- 23,907
Population outlook (Clallam County) Hauer SSP2
- Today (2025)
- 76,817 people
- By 2030
- 78,177 · +1.8%
- By 2040
- 79,795 · +3.9%
- By 2050
- 80,890 · +5.3%
- By 2075
- 83,933 · +9.3%
- By 2100
- 82,141 · +6.9%
Race, ethnicity, and origin ACS 2023
- Neighborhood character
- Predominantly White (84%)
- Race & ethnicity
- White 84% Two or more races 8% Hispanic / Latino 7% Native American 1% Asian 1%
- Hispanic origin (detail)
- Mexican 4%
- Common ancestry
- Italian 6% Portuguese 6% Lithuanian 4%
- Foreign-born
- 4% · Canada
- Languages at home
- 95% English-only · Spanish 3% German/W. Germanic 1%
Political lean MEDSL · Clallam
- 2024 margin
- Lean D (+7.9) · D 52.6% · R 44.7% · Other 2.7%
- 2008→2024 swing
- +4.6pp toward D · 2008: 3.3pp · 2024: 7.9pp
- All cycles
- 2024: D+7.9 2020: D+3.4 2016: R+1.6 2012: D+0.4 2008: D+3.3
Not yet ingested
- Civics
- —
Market trends
- HPI YoY
- ▼ -340.90%
- Current HPI
- 189.7112
- Rent YoY
- —
- Metro
- —
- State GDP YoY
- ▲ 4.65%
- F500 in state
- 22
Industry mix (Fortune 500 HQ in WA)
| Industry | F500 HQs | Revenue |
|---|---|---|
| Retail | 2 | $269B |
|
||
| Technology / Retail | 1 | $638B |
|
||
| Technology | 1 | $245B |
|
||
| Telecommunications | 1 | $38B |
|
||
| Food / Beverage | 1 | $36B |
|
||
| Automotive / Trucks | 1 | $34B |
|
||
Price history
+386.8% since first listed10 events — show timeline
- 2026-06-05 Pending — OLS
- 2026-06-02 Price Changed $185,000 OLS
- 2026-05-09 Listed — NWMLS as Distributed by MLS Grid
- 2026-05-09 Listed $192,000 OLS
- 2022-03-28 Sold (Public Records) $172,000 Public Records
- 2022-03-28 Sold (MLS) $172,000 NWMLS as Distributed by MLS Grid
- 2022-03-28 Sold (MLS) $172,000 OLS
- 2021-11-04 Pending — NWMLS as Distributed by MLS Grid
- 2021-10-28 Listed $172,900 NWMLS as Distributed by MLS Grid
- 2013-02-01 Sold (Public Records) $38,000 Public Records
Property tax history
+8.4%/yrLatest (2026): $1,048 · -0.3% YoY. Source: county tax records.
Cash-flow waterfall
monthlySold comps — $/sqft
last 12 mo · ≤1 miLoading sold comps…