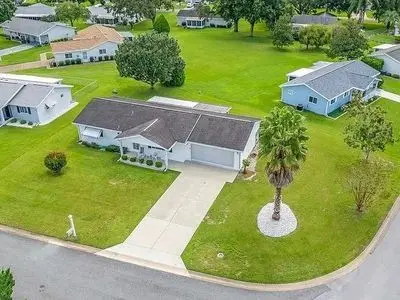
17624 SE 108th Ter · The Villages, FL
Flood risk 1/10 · Minimal
- FEMA flood zone
- X (unshaded)
- Chance of flooding over 30 yrs
- 0.0%
- Est. flood insurance / yr
- $507 – $1,088
Fire risk 3/10 · Minor
- Est. fire insurance / yr
- $947 – $1,759
Heat risk 9/10 · Severe
- Hot days now (above 109°F)
- 7 days/yr
- Hot days in 30 yrs
- 21 days/yr
Wind risk 9/10 · Severe
- Chance of severe wind over 30 yrs
- 99.0%
Air-quality risk 3/10 · Minor
- Unhealthy air days now
- 2 days/yr
- Unhealthy air days in 30 yrs
- 2 days/yr
Risk factors via First Street. Map © Google.
Why this score? — see what drove the D- grade
The composite is a weighted blend of 9 inputs, each scored 0–100. Each bar is that input's sub-score; the figure is the points it added to the 100-point composite (weight × sub-score).
- Cash flow +15.1/30.0
- DSCR +4.6/10.0
- 1% rule +3.6/10.0
- Schools +3.6/10.0
- Livability +3.5/5.0
- Rent growth +2.5/5.0
- Condition / age +2.5/5.0
- ARV discount +0.0/15.0
- Appreciation +0.0/10.0
$224,095
🖨 Deal sheet (PDF) 📄 Offer letter ✓ Due diligence
Listing remarks MLS
TAKE A LOOK AT THIS LOVELY HOME IN THIS GREAT LOCATION! This 2 BEDROOM, 2 BATHROOM HOUSE is conveniently located right in the beginning of SPRUCE CREEK SOUTH A Private Gated 55+Community, surrounded by all the amenities the city has to offer. It is the first house to your left as you go through the security gate right off the main HWY 441, easy quick entry and exit. You can also legally drive your Golf Cart not only throughout the neighborhood but also ACCROSS THE 441 MAIN GATE, as you exit the community taking you straight across to the other big plaza, easy access to Banks, Doctors, Dentists, Beauty Salons, Nail Spa's, Retail Store, Lowes, Supermarkets, which include Walmart, Dollar Store, Aldi, and the new BJ's. There are several Gas Stations, and much more, ALL BY GOLFCART. .. This home is also close to the back exit gate on the same road the house is situated on, turn to your right, as you leave the driveway and you are 2 minutes away, this gate takes you straight to Belle Meade Plaza which has several doctors, restaurants, drugstore, and specialty shops. This Property is about 2 miles north of The Villages, only a few minutes' drive to Spanish Springs Town Square by Car. You also have 2 hospitals nearby right on 441! This is a FANTASTIC LOCATION! The Home is a Very Comfortable 2/2/2 FIR Model. It has 2 bedrooms, each with a walk-in closet 2 bathrooms, The master bedroom has walk in shower, and guest bathroom has a tub. The Kitchen has an Eat in Kitchen Nook area. The living room as you enter includes a combination formal dining area (L SHAPED). The House also has an extended 2 Car Garage, Cabinetry and Washer and Dryer. The AC IS 2017, Newer Re-shingled roof, and newer windows throughout the house. SEPTIC JUST GOT PUMPED SEPT 2022! CARPET HAS BEEN PROFESSIONALLY STEAMED AND SANITIZED OCTOBER 2022 This Home has an enclosed Lanai with carpet, and an additional bonus enclosed room with a concrete floor. This is a corner lot with nice big Outdoor Yard Space and with lots of privacy, no kissing Lanais. You will notice, as you step to the back yard, away from the house you will see a beautiful, matured tree which provides generous shade. (A Furniture Package is Optional which can be discussed at time of purchase), Septic Tank Being Pumped on 9/22/22, Public Water, Cable, Satellite or High-Speed Internet Is Available, you can now get Verizon. .. There is additional gated parking for a low yearly fee within the community by the recycle dumpsters to park your RV, Extra Vehicle or Trailer! CONTACT ME TODAY FOR YOUR IN PERSON OR VIRTUAL TOUR!
Key facts
- Walk-in closet
- Fiberglass roof
- Elevated lot
Tags
Property features AI
Exterior
- Home design: Built in 2009
- Construction: Living area approximately 1,144
- Exterior features: Located in the Summerfield subdivision
Neighborhood map
What this means for you Summary
Snapshot
- This is a 2-bed/2.0-bath single-family listed at $224k.
Deal economics
- At list price, monthly cash flow is $73 ($872/yr) — positive.
- The deal already cash-flows at list — no discount required.
- To meet the 1% rule (rent ≥ 1% of price), the offer needs to be $192k (14.2% below list).
- Recommended offer: $192k (14.2% below list) — sets the bar for 1% rule.
- Cap rate 6.7% vs local median 5.0% in The Villages — top-decile yield for the area; either an underpriced asset or a hidden risk that comps aren't pricing in. Stress-test before assuming the spread holds.
Location & tenants
- Location reads 70/100 on livability (#431 in FL) — a middle-class / working-renter tenant base. Strengths: crime A+, housing A, employment B+; Watch: amenities F, commute F, health & safety F.
- Marion (rural): math 42% / reading 43% proficiency, ranked #61 of 73 in FL (top 84%) — families likely to look elsewhere, expect single-tenant / working-renter base with shorter leases; 61% free/reduced lunch — lower-income household profile, screen leases tightly.
- Zoned schools: Stanton-Weirsdale Elementary School (math 42% / reading 36%, grade F, #1,560 of 2,144 statewide, top 73%, 544 students, 70% FRL); Lake Weir Middle School (math 37% / reading 33%, grade F, #416 of 571 statewide, top 74%, 1,207 students, 76% FRL); Belleview High School (math 31% / reading 46%, grade F, #321 of 667 statewide, top 49%, 1,783 students, 56% FRL).
- Market conditions: 713 active listings in the ZIP; 12 comparable units currently listed for rent nearby; rentals at typical pace (median 23d on market — plan ~3-4 weeks tenant-placement turnaround); 7,071 units permitted in Marion County in 2024 (534 in 5+ unit buildings).
- This rent runs 35% of the median local income ($67k/yr) — at the standard rent-burdened threshold; future hikes will face affordability resistance.
Forward outlook
- Local home prices are declining (-3.0%/yr); year-one equity from $2k of loan paydown is wiped out by about $7k of value loss. Plan a longer hold.
- Marion County population projected at +13% by 2050 — modest demand growth; plan on rents tracking national, not racing it.
Negotiation context
- Only 11 days on market — expect competitive offers; lowballing is unlikely to land.
- 2 sale attempts since 4y ago with the ask held roughly flat each time — persistent listings suggest the price (not the market) is what's stuck; bring a comps-based counter.
Risks & watch-outs
- Climate carrying-cost: severe wind risk, 99% chance of damaging wind over 30y; extreme-heat days projected 7→21/yr by 2055 (HVAC capex compounding) — expect insurance premiums to compound above CPI over the hold.
Questions for the listing agent
- What does the HOA fee cover, when was the last increase, and are there any pending special assessments or reserve-fund shortfalls?
- Is there a deadline driving the sale (1031 exchange, divorce, estate, relocation)? That informs how much negotiation room exists.
- Schools are A-rated — typically a magnet for longer-tenancy family renters. What's the average tenant stay here, and is there a school-zone premium baked into asking?
- The area grade is low — what's the realistic commute time and amenity access for the typical tenant pool here? Any planned neighborhood developments (good or bad) we should know about?
- What's the average days-on-market for RENTAL listings here right now (not sales)? A rising rental-DOM trend means longer vacancies and softer asking-rent achievability than the comps imply.
- What's the recent tenant-quality profile in this submarket — average credit score on applications, eviction rate, late-payment / NSF rate, and stable-employment percentage? A property-management company in the area should have these aggregated.
- How much new for-sale + rental construction is in the pipeline within 1–3 miles? Heavy new supply typically softens prices + rents 12–24 months out; constrained supply supports both.
Investment metrics
- 1% rule
- 0.86% ✗
- Cap rate
- 6.68%
- Cash-on-cash
- 1.39%
- DSCR
- 1.06
- GRM
- 9.7
CMA / ARV
- ARV (on-the-fly)
- $186,472
- Comps found
- 8
Show comp detail 8 sales within ~0.75 mi
| Address | Dist | Beds/Ba | Sqft | Sold | Price | $/sf | Match |
|---|---|---|---|---|---|---|---|
| 10699 SE 178th St | 0.15mi | 2/2.0 | 1,248 (+9%) | 10mo | $179,000 | $143 | 69 |
| 10235 SE 179th Pl | 0.71mi | 2/2.0 | 1,144 (0%) | 2mo | $180,599 | $158 | 66 |
| 17963 SE 105th Ct | 0.33mi | 2/2.0 | 1,206 (+5%) | 20mo | $235,000 | $195 | 59 |
| 10221 SE 175th Pl | 0.67mi | 2/2.0 | 1,144 (0%) | 18mo | $200,000 | $175 | 54 |
| 10340 SE 177th Pl | 0.55mi | 2/2.0 | 1,296 (+13%) | 2mo | $207,000 | $160 | 50 |
| 13769 County Road 109f | 0.61mi | 3/2.0 (+1) | 1,152 (+1%) | 20mo | $140,000 | $122 | 49 |
| 17971 SE 105th Ct | 0.33mi | 2/2.0 | 1,296 (+13%) | 21mo | $242,000 | $187 | 45 |
| 8048 County Road 109 | 0.66mi | 3/2.0 (+1) | 1,056 (-8%) | 23mo | $172,000 | $163 | 32 |
Match score weights: distance 35% · size 25% · config 20% · recency 20%. Top-matched comps best support the ARV.
Projected returns pro-forma
-3.0% appreciation · 3.0% rent growth · sell at horizon
- IRR
- -14.1%
- Equity multiple
- 0.49×
- Total profit
- $-31,719
- Equity at exit
- $33,413
- IRR
- -5.3%
- Equity multiple
- 0.65×
- Total profit
- $-21,799
- Equity at exit
- $19,376
Cash invested: $62,747 (down + closing). Projections, not guarantees.
Landlord ↔ Tenant lean methodology
- Overall (STATE)
- 87 Strongly Landlord-Friendly
- State Florida
- 87 Strongly Landlord-Friendly · R+3
- County
- — inherits STATE
- City
- — inherits STATE
ZIP-level market 34491
- Home prices YoY
- -35.0%
- Active inventory
- 713
- Price-to-rent
- 9.7×
Monthly cashflow live
- Estimated rent
- $1,923 high interval (Pro) →
- Mortgage (P&I)
- −$1,175
- Tax from tax record
- −$43 /mo · $514/yr
- Insurance
- −$93
- HOA
- −$135
- Vacancy / Maint / Mgmt
- −$404
- Net cashflow
- $73
Break-even live
Sensitivity live
| Price | -10% $200 | -5% $136 | +0% $73 | +5% $9 | +10% $-54 |
|---|---|---|---|---|---|
| Rent | -10% $-79 | -5% $-3 | +0% $73 | +5% $149 | +10% $225 |
| Rate | -1.0pp $186 | -0.5pp $130 | base $73 | +0.5pp $15 | +1.0pp $-44 |
UW: 25.0% down · 7.5% · 30yr · 1.5% tax · 5.0% vac · 8.0% maint · 8.0% mgmt
Financing live
Cash to close
- Down payment
- $56,024
- Closing costs
- $6,723
- Reserves months
- —
- Total cash needed
- —
Loan-product check · same deal, 3 products live
Conventional
25% down · 7.5% · 30yr
- Down + closing
- —
- Monthly P&I
- —
- Monthly cashflow
- —
- DSCR
- —
- Eligible?
- —
Personal DTI + credit; lowest rate.
DSCR
20% down · 8.5% · 30yr
- Down + closing
- —
- Monthly P&I
- —
- Monthly cashflow
- —
- DSCR
- —
- Eligible?
- —
No personal income docs; deal must DSCR.
Hard money
10% down · 12.0% · 12mo
- Down + closing
- —
- Monthly P&I
- —
- Monthly cashflow
- —
- DSCR
- —
- Eligible?
- —
Short-term bridge; refi at stabilization.
Rent comps 12 comps
| Address | Beds | Baths | Sqft | Rent | $/sqft | DOM | Units | Dist |
|---|---|---|---|---|---|---|---|---|
| 10397 SE 176th St Summerfield, FL | 2.0 | 2.0 | 1296 | $2,150 | $1.66 | 23d | 1 | 0.48mi |
| 13957 County Road 109D Lady Lake, FL | 2.0 | 2.0 | 1482 | $1,650 | $1.11 | 23d | 1 | 0.52mi |
| 17532 SE 100th Ct Summerfield, FL | 2.0 | 2.0 | 1217 | $1,800 | $1.48 | 23d | 1 | 0.82mi |
| 1377 Camero Dr Lady Lake, FL | 3.0 | 2.0 | 1462 | $5,500 | $3.76 | 23d | 1 | 0.99mi |
| 13765 NE 136th Loop Lady Lake, FL | 1.0–3.0 | 1.0–2.0 | 1078 | $1,639 | $1.52 | 23d | 36 | 1.16mi |
| 17199 SE 97th Ter Summerfield, FL | 3.0 | 2.0 | 1404 | $1,990 | $1.42 | 23d | 1 | 1.17mi |
| 13740 Lead LN The Villages, FL | 1.0–3.0 | 1.0–2.0 | 1029 | $1,720 | $1.67 | 23d | 38 | 1.18mi |
| 17713 SE 95th Cir Summerfield, FL | 3.0 | 2.0 | 1450 | $2,000 | $1.38 | 23d | 1 | 1.35mi |
| 17472 SE 121st Cir Summerfield, FL | 3.0 | 2.0 | 1330 | $1,950 | $1.47 | 15d | 1 | 1.37mi |
| 2006 Cardona Way Lady Lake, FL | 2.0 | 2.0 | 1428 | $3,900 | $2.73 | 23d | 1 | 1.38mi |
| 9990 SE 166th St Summerfield, FL | 3.0 | 2.0 | 962 | $1,395 | $1.45 | 15d | 1 | 1.39mi |
| 11001 SE Sunset Harbor Rd Unit H52 Summerfield, FL | 2.0 | 2.5 | 1224 | $1,440 | $1.18 | 23d | 1 | 1.49mi |
HOA detail
- Monthly dues
- $135 · $1,620/yr
- Likely covers
- watergasinternetcablesecurity
Listing history 9 events
-
2026-06-21days on market $224,095 Active 11 DOM
-
2026-06-18days on market $224,095 Active 8 DOM
-
2026-06-17days on market $224,095 Active 7 DOM
-
2026-06-16days on market $224,095 Active 6 DOM
-
2026-06-15days on market $224,095 Active 5 DOM
-
2026-06-14days on market $224,095 Active 3 DOM
-
2026-06-13pricedays on market $224,095 Active 2 DOM
-
2026-06-10remarks 699-char remark
-
2026-06-10$229,498 Active 1 DOM
ⓘ Source: listings_history table (triggers on properties + properties_extension) + one-shot
backfill from property_details.listing_events for pre-trigger history.
Tax reassessment forecast FL · Resets to sale price
- Current annual tax
- $514 · $43/mo
- Projected year-2 tax
- $1,860 · $155/mo
- Expected delta
- +$1,346/yr (+$112/mo · 261.9%)
ⓘ Screening estimate from a state-policy table — verify with the county assessor before closing.
Climate risk First Street
- Flood 1/10 Low FEMA zone X (unshaded) · 0% chance over 30 yrs
- Wildfire 3/10 Moderate
- Heat 9/10 Extreme 7 d/yr ≥109°F today · 21 d/yr by 30 yrs out
- Wind 9/10 Extreme 99% chance of damaging wind over 30 yrs
- Air quality 3/10 Moderate 2 unhealthy d/yr today · 2 by 30 yrs out
Nearby sold comps map
Loading sold comps map…
Walkable amenities ~0.75 mi
Loading nearby amenities…
Taxation est. · year 1
- Rental income
- $23,074
- − Mortgage interest
- −$12,553
- − Property taxes
- −$514
- − Insurance
- −$1,120
- − Repairs & maintenance
- −$1,846
- − Management
- −$1,846
- − HOA
- −$1,620
- − Depreciation
- −$6,519
- Taxable loss
- −$2,944
- Est. tax savings @ 24.0%
- +$707
- After-tax cash flow
- $1,579/yr
For passive investors: Depreciation is non-cash, so a rental often shows a tax loss while cash-flowing — sheltering income. Rental losses are passive: they offset passive income freely, and up to $25,000/yr can offset ordinary (W-2) income if you actively participate and your MAGI is under $100k (phasing out to $0 by $150k); unused losses carry forward. On sale, claimed depreciation is recaptured at up to 25%, and gains may owe capital-gains tax (a 1031 exchange can defer both). Figures are a year-1 estimate at your 24.0% rate — not tax advice; consult a CPA.
Schools (NCES district)
- District
- Marion
- NCES district ID
- 1201260
- Math proficiency
- 42% ▼ -7.00%
- Reading proficiency
- 43% ▼ -4.00%
- Median HH income
- $40,015
- Composite
- 35.61/100
- National rank
- #4890
- State rank
- #61 of 73 in FL
Livability — The Villages
- Score
- 70/100
- State rank
- #431
- US rank
- #7363
Category grades
Schools grade is shown separately in the Schools card above.
Census & demographics
- County
- Marion County · 315,796 people
- City population
- 19,167
- Metro
- Ocala, FL
- Population (ZIP)
- 33,318
- Household income
- $66,679
- Rent vs Own
- Severe rent burden
- 256.0
Population outlook (Marion County) Hauer SSP2
- Today (2025)
- 365,905 people
- By 2030
- 376,768 · +3.0%
- By 2040
- 396,555 · +8.4%
- By 2050
- 412,723 · +12.8%
- By 2075
- 446,090 · +21.9%
- By 2100
- 436,193 · +19.2%
Race, ethnicity, and origin ACS 2023
- Neighborhood character
- Predominantly White (77%)
- Race & ethnicity
- White 77% Hispanic / Latino 14% Two or more races 9% Black 4% Asian 2%
- Hispanic origin (detail)
- Mexican 3% Puerto Rican 6% Cuban 1%
- Common ancestry
- Lithuanian 3% Slovak 2% Romanian 2%
- Foreign-born
- 8% · Canada, Vietnam, Jamaica
- Languages at home
- 85% English-only · Spanish 11% Vietnamese 1% French/Haitian/Cajun 1%
Political lean MEDSL · Marion
- 2024 margin
- Solid R (+31.6) · D 33.8% · R 65.5%
- 2008→2024 swing
- -20.0pp toward R · 2008: -11.6pp · 2024: -31.6pp
- All cycles
- 2024: R+31.6 2020: R+25.9 2016: R+26.2 2012: R+16.2 2008: R+11.6
Not yet ingested
- Civics
- —
Market trends
- HPI YoY
- ▼ -107.67%
- Current HPI
- 200.0792
- Rent YoY
- —
- Metro
- Ocala, FL
- State GDP YoY
- ▲ 3.28%
- F500 in state
- 36
Industry mix (Fortune 500 HQ in FL)
| Industry | F500 HQs | Revenue |
|---|---|---|
| Industrial Technology | 2 | $29B |
|
||
| Insurance | 2 | $17B |
|
||
| Retail | 1 | $60B |
|
||
| Technology Distribution | 1 | $58B |
|
||
| Homebuilding | 1 | $35B |
|
||
| Technology Manufacturing | 1 | $35B |
|
||
Price history
+227.9% since first listed8 events — show timeline
- 2026-06-10 Listed $229,498 FSBO.com
- 2023-01-05 Sold (Public Records) $230,000 Public Records
- 2023-01-04 Sold (MLS) $230,000 Stellar MLS as Distributed by MLS Grid
- 2022-12-07 Pending — Stellar MLS as Distributed by MLS Grid
- 2022-10-25 Price Changed $230,500 Stellar MLS as Distributed by MLS Grid
- 2022-09-16 Listed $235,000 Stellar MLS as Distributed by MLS Grid
- 1995-05-08 Sold (Public Records) $67,500 Public Records
- 1992-03-01 Sold (Public Records) $70,000 Public Records
Property tax history
-3.7%/yrLatest (2025): $514 · +70.2% YoY. Source: county tax records.
Cash-flow waterfall
monthlySold comps — $/sqft
last 12 mo · ≤1 miLoading sold comps…