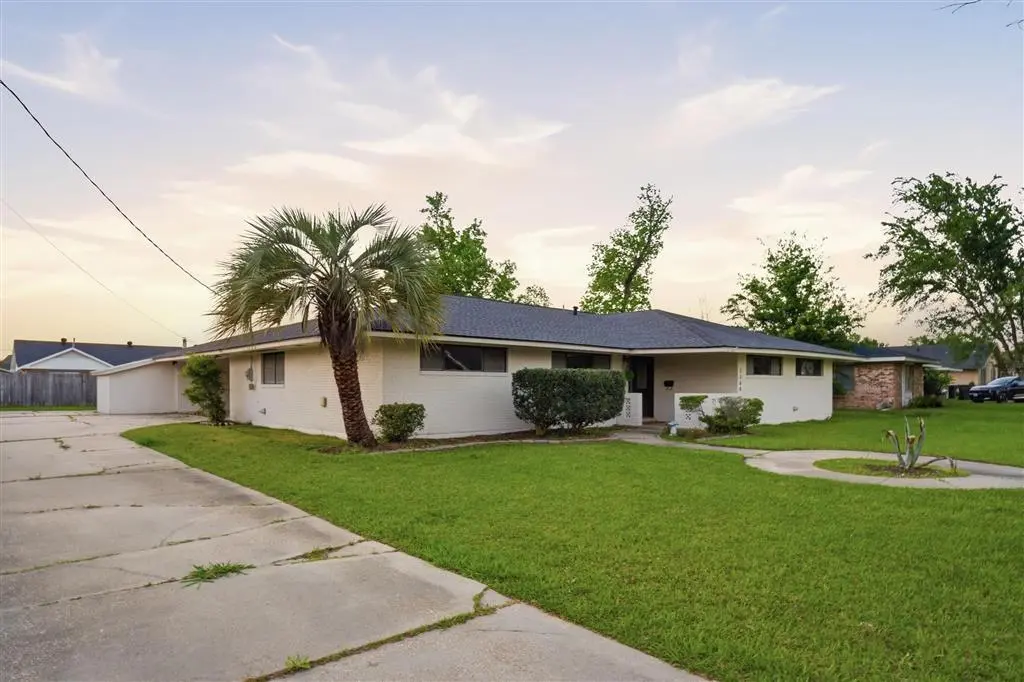
2200 Barbe Ct · Lake Charles, LA
Flood risk 6/10 · Moderate
- FEMA flood zone
- AE
- Chance of flooding over 30 yrs
- 0.57%
- Est. flood insurance / yr
- $1,737 – $8,500
Fire risk 1/10 · Minimal
- Est. fire insurance / yr
- $1,269 – $2,357
Heat risk 9/10 · Severe
- Hot days now (above 109°F)
- 7 days/yr
- Hot days in 30 yrs
- 23 days/yr
Wind risk 9/10 · Severe
- Chance of severe wind over 30 yrs
- 99.0%
Air-quality risk 2/10 · Minimal
- Unhealthy air days now
- 1 days/yr
- Unhealthy air days in 30 yrs
- 1 days/yr
Risk factors via First Street. Map © Google.
Why this score? — see what drove the C grade
The composite is a weighted blend of 9 inputs, each scored 0–100. Each bar is that input's sub-score; the figure is the points it added to the 100-point composite (weight × sub-score).
- Cash flow +18.5/30.0
- ARV discount +15.0/15.0
- DSCR +5.8/10.0
- Rent growth +4.0/5.0
- 1% rule +3.9/10.0
- Livability +3.4/5.0
- Schools +3.1/10.0
- Condition / age +2.5/5.0
- Appreciation +0.0/10.0
$250,000
🖨 Deal sheet (PDF) 📄 Offer letter ✓ Due diligence
Listing remarks MLS
Remodeled mid-century brick home encompassing approximately 2,200 square feet, offering 3 bedrooms and 2 full baths with a well-defined and functional layout. Interior spaces include multiple living areas, highlighted by an oversized family room adjoining a dedicated dining area, as well as a separate den with a fireplace that opens to the kitchen. The kitchen is appointed with stainless steel appliances, solid wood cabinetry, granite countertops, and a breakfast bar. Bedrooms are generously proportioned, and the home features consistent, low-maintenance flooring throughout with ceramic wood plank tile and wood laminate—no carpet. A fully enclosed, climate-controlled sunroom extends the interior footprint. Exterior improvements include a brick patio and covered carport. The property also includes a 30' x 10' climate-controlled workshop with a half bath. Conveniently situated just minutes from downtown amenities, shopping, and dining. Schedule your private showing today!
Key facts
- Solid wood cabinetry
- Granite countertops
- Den with fireplace
Tags
Neighborhood map
What this means for you Summary
Snapshot
- This is a 3-bed/2.5-bath single-family listed at $250k.
Deal economics
- At list price, monthly cash flow is $-189 ($-2k/yr) — negative.
- To cash-flow at today's rent, offer at most $217k (13.3% below list).
- To meet the 1% rule (rent ≥ 1% of price), the offer needs to be $222k (11.3% below list).
- Recommended offer: $217k (13.3% below list) — sets the bar for cash-flow.
- Cap rate 7.4% vs local median 4.2% in Lake Charles — top-decile yield for the area; either an underpriced asset or a hidden risk that comps aren't pricing in. Stress-test before assuming the spread holds.
Location & tenants
- Location reads 68/100 on livability (#95 in LA) — a middle-class / working-renter tenant base. Strengths: commute A+, cost of living A+, housing A+; Watch: crime F, amenities F, employment D-.
- Calcasieu Parish (other): math 30% / reading 44% proficiency, ranked #29 of 98 in LA (top 30%) — families likely to look elsewhere, expect single-tenant / working-renter base with shorter leases.
- Zoned schools: Barbe Elementary School (math 12% / reading 32%, grade F, #415 of 646 statewide, top 67%, 164 students, 84% FRL); S. J. Welsh Middle School (math 28% / reading 44%, grade F, #84 of 218 statewide, top 41%, 1,107 students, 49% FRL); Lagrange High School (math 9% / reading 22%, grade F, #217 of 265 statewide, top 82%, 907 students, 76% FRL) — zoned schools average 70% FRL vs 52% district-wide (18 pts higher); higher-poverty schools than district average — tighter screening recommended.
- Zoned-school proficiency averages 24% at this address vs 37% district-wide (-12 pts) — the specific schools serving this property underperform the Calcasieu Parish average; the district grade overstates school quality for this exact location.
- Market conditions: Rents rising fast (+6.2%/yr); 364 active listings in the ZIP; 6 comparable units currently listed for rent nearby; rentals lingering (median 46d on market — plan ~5-8 weeks vacancy on turnover, expect pricing pressure); 67% of comp listings sitting > 30 days — soft ceiling on asking rent; 1,298 units permitted in Calcasieu Parish in 2024 (526 in 5+ unit buildings).
- At $2,218/mo this rent would consume 53% of the median local household income ($50k/yr) (locally 1304% of renters already pay >50% of income on rent) — very limited rent-growth headroom before tenants either downsize or default.
Forward outlook
- Local home prices are declining (-3.0%/yr); year-one equity from $2k of loan paydown is wiped out by about $8k of value loss. Plan a longer hold.
- Calcasieu County population projected at +11% by 2050 — modest demand growth; plan on rents tracking national, not racing it.
Negotiation context
- It's been on market 81 days — a 6% lower offer ($235k) is reasonable based on typical stale-listing flexibility.
- 3 sale attempts since 9y ago with the ask held roughly flat each time — persistent listings suggest the price (not the market) is what's stuck; bring a comps-based counter.
Risks & watch-outs
- Watch-outs: flood insurance adds $427/mo.
- Climate carrying-cost: in FEMA flood zone AE (mandatory federal flood insurance); severe wind risk, 99% chance of damaging wind over 30y; extreme-heat days projected 7→23/yr by 2055 (HVAC capex compounding) — expect insurance premiums to compound above CPI over the hold.
Questions for the listing agent
- What do current leases actually rent for vs. the listed asking? Can we see a recent rent roll and the last 12 months of T-12 income?
- It's been on market 81 days. Have you received any prior offers? Is the seller open to a 13% concession, seller financing, or rate buy-down credit?
- Built in 1967 — when were the roof, HVAC, electrical panel, plumbing, and water heater last replaced?
- What's the actual annual flood-insurance premium (NFIP or private), and is the property in a SFHA with mandatory coverage?
- Why hasn't it sold? Are there any deal-killer items the seller is aware of (foundation, flood, title, zoning, code violations)?
- Is there a deadline driving the sale (1031 exchange, divorce, estate, relocation)? That informs how much negotiation room exists.
- Schools are B-rated — typically a magnet for longer-tenancy family renters. What's the average tenant stay here, and is there a school-zone premium baked into asking?
- Crime grade is F in this area — have there been break-ins, vandalism, or insurance claims at this property in the last 3 years? What carrier currently insures it and at what premium?
- What's the average days-on-market for RENTAL listings here right now (not sales)? A rising rental-DOM trend means longer vacancies and softer asking-rent achievability than the comps imply.
- What's the recent tenant-quality profile in this submarket — average credit score on applications, eviction rate, late-payment / NSF rate, and stable-employment percentage? A property-management company in the area should have these aggregated.
- How much new for-sale + rental construction is in the pipeline within 1–3 miles? Heavy new supply typically softens prices + rents 12–24 months out; constrained supply supports both.
Investment metrics
- 1% rule
- 0.89% ✗
- Cap rate
- 7.43%
- Cash-on-cash
- 4.08%
- DSCR
- 1.18
- GRM
- 9.4
CMA / ARV
- ARV (median comp)
- $326,765
- List price
- $250,000
- Delta
- -23.49%
- Verdict
- UNDERPRICED
- Comps
- 20 within 1.0 mi
Show comp detail 11 sales within ~0.75 mi
| Address | Dist | Beds/Ba | Sqft | Sold | Price | $/sf | Match |
|---|---|---|---|---|---|---|---|
| 801 St Anthony St Unit E | 0.36mi | 3/2.5 | 2,232 (+2%) | 4mo | $355,000 | $159 | 77 |
| 2111 St Joseph Ave | 0.14mi | 3/2.5 | 1,943 (-12%) | 9mo | $367,000 | $189 | 66 |
| 1939 Barbe St | 0.27mi | 3/2.5 | 1,980 (-10%) | 7mo | $329,500 | $166 | 65 |
| 2136 La Cache Dr | 0.12mi | 3/2.0 | 2,443 (+11%) | 14mo | $295,000 | $121 | 63 |
| 726 Rosalie St | 0.34mi | 3/1.5 | 2,031 (-8%) | 12mo | $97,500 | $48 | 58 |
| 819 Touchy St | 0.42mi | 4/2.0 (+1) | 2,180 (-1%) | 18mo | $275,000 | $126 | 57 |
| 2313 Lacache Dr | 0.14mi | 3/2.0 | 1,938 (-12%) | 20mo | $315,000 | $163 | 55 |
| 730 Louie St | 0.33mi | 3/1.5 | 1,878 (-15%) | 9mo | $70,000 | $37 | 49 |
| 1805 Riverside Dr | 0.53mi | 4/2.0 (+1) | 1,976 (-10%) | 7mo | $262,500 | $133 | 45 |
| 1015 Holly St | 0.70mi | 3/2.5 | 2,337 (+6%) | 23mo | $211,802 | $91 | 38 |
| 403 Louie St | 0.72mi | 2/2.0 (-1) | 1,893 (-14%) | 22mo | $205,400 | $109 | 18 |
Match score weights: distance 35% · size 25% · config 20% · recency 20%. Top-matched comps best support the ARV.
Projected returns pro-forma
-3.0% appreciation · 6.18% rent growth · sell at horizon
- IRR
- -17.7%
- Equity multiple
- 0.36×
- Total profit
- $-45,049
- Equity at exit
- $37,276
- IRR
- -4.1%
- Equity multiple
- 0.69×
- Total profit
- $-21,971
- Equity at exit
- $21,615
Cash invested: $70,000 (down + closing). Projections, not guarantees.
Landlord ↔ Tenant lean methodology
- Overall (STATE)
- 90 Strongly Landlord-Friendly
- State Louisiana
- 90 Strongly Landlord-Friendly · R+12
- County
- — inherits STATE
- City
- — inherits STATE
ZIP-level market 70601
- Rents YoY
- 6.2%
- Active inventory
- 364
- Price-to-rent
- 9.4×
Monthly cashflow live
- Estimated rent
- $2,218 high interval (Pro) →
- Mortgage (P&I)
- −$1,311
- Tax from tax record
- −$99 /mo · $1,186/yr
- Insurance
- −$104
- Flood insurance flood zone
- −$427 /mo · $5,118/yr
- HOA
- −$0
- Vacancy / Maint / Mgmt
- −$466
- Net cashflow
- $-189
Break-even live
Sensitivity live
| Price | -10% $-47 | -5% $-118 | +0% $-189 | +5% $-260 | +10% $-330 |
|---|---|---|---|---|---|
| Rent | -10% $-364 | -5% $-276 | +0% $-189 | +5% $-101 | +10% $-14 |
| Rate | -1.0pp $-63 | -0.5pp $-125 | base $-189 | +0.5pp $-254 | +1.0pp $-319 |
UW: 25.0% down · 7.5% · 30yr · 1.5% tax · 5.0% vac · 8.0% maint · 8.0% mgmt
Financing live
Cash to close
- Down payment
- $62,500
- Closing costs
- $7,500
- Reserves months
- —
- Total cash needed
- —
Loan-product check · same deal, 3 products live
Conventional
25% down · 7.5% · 30yr
- Down + closing
- —
- Monthly P&I
- —
- Monthly cashflow
- —
- DSCR
- —
- Eligible?
- —
Personal DTI + credit; lowest rate.
DSCR
20% down · 8.5% · 30yr
- Down + closing
- —
- Monthly P&I
- —
- Monthly cashflow
- —
- DSCR
- —
- Eligible?
- —
No personal income docs; deal must DSCR.
Hard money
10% down · 12.0% · 12mo
- Down + closing
- —
- Monthly P&I
- —
- Monthly cashflow
- —
- DSCR
- —
- Eligible?
- —
Short-term bridge; refi at stabilization.
Rent comps 6 comps
| Address | Beds | Baths | Sqft | Rent | $/sqft | DOM | Units | Dist |
|---|---|---|---|---|---|---|---|---|
| 1415 William St Lake Charles, LA | 3.0 | 2.5 | 2289 | $2,800 | $1.22 | 45d | 1 | 0.41mi |
| 2700 Ernest St Lake Charles, LA | 1.0–3.0 | 1.0–2.0 | 1054 | $1,598 | $1.52 | 15d | 1 | 0.96mi |
| 1812 Ethel St Lake Charles, LA | 3.0 | 2.0 | 1589 | $3,850 | $2.42 | 45d | 1 | 0.96mi |
| 1731 Elms St Lake Charles, LA | 3.0 | 2.0 | 1575 | $2,000 | $1.27 | 45d | 1 | 1.11mi |
| 1710 Granger St Lake Charles, LA | 3.0 | 2.5 | 1450 | $1,900 | $1.31 | 45d | 1 | 1.33mi |
| 3535 Knight Ln Unit 14 Lake Charles, LA | 3.0 | 2.5 | 1450 | $2,150 | $1.48 | 15d | 1 | 1.49mi |
Listing history 27 events
-
2026-06-21days on market $250,000 Active 81 DOM
-
2026-06-19days on market $250,000 Active 79 DOM
-
2026-06-18days on market $250,000 Active 78 DOM
-
2026-06-17days on market $250,000 Active 77 DOM
-
2026-06-16days on market $250,000 Active 76 DOM
-
2026-06-15days on market $250,000 Active 75 DOM
-
2026-06-14days on market $250,000 Active 73 DOM
-
2026-06-13days on market $250,000 Active 72 DOM
-
2026-06-10days on market $250,000 Active 70 DOM
-
2026-06-09days on market $250,000 Active 69 DOM
-
2026-06-08days on market $250,000 Active 68 DOM
-
2026-06-07days on market $250,000 Active 67 DOM
-
2026-06-05days on market $250,000 Active 64 DOM
-
2026-06-02days on market $250,000 Active 62 DOM
-
2026-06-01days on market $250,000 Active 61 DOM
-
2026-05-31days on market $250,000 Active 60 DOM
-
2026-05-30days on market $250,000 Active 59 DOM
-
2026-04-01$250,000 Active 990-char remark
Show marketing remark (990 chars)
Remodeled mid-century brick home encompassing approximately 2,200 square feet, offering 3 bedrooms and 2 full baths with a well-defined and functional layout. Interior spaces include multiple living areas, highlighted by an oversized family room adjoining a dedicated dining area, as well as a separate den with a fireplace that opens to the kitchen. The kitchen is appointed with stainless steel appliances, solid wood cabinetry, granite countertops, and a breakfast bar. Bedrooms are generously proportioned, and the home features consistent, low-maintenance flooring throughout with ceramic wood plank tile and wood laminate—no carpet. A fully enclosed, climate-controlled sunroom extends the interior footprint. Exterior improvements include a brick patio and covered carport. The property also includes a 30' x 10' climate-controlled workshop with a half bath. Conveniently situated just minutes from downtown amenities, shopping, and dining. Schedule your private showing today!
-
2025-06-30soldstatus Closed
-
2025-05-28historical
-
2025-04-15$1 Active
-
2017-06-19soldstatus $220,900
-
2017-06-16soldstatus
-
2017-05-11$224,900
-
2011-09-19soldstatus $200,000
-
2011-09-01soldstatus $170,000
-
1994-03-02soldstatus $96,700
ⓘ Source: listings_history table (triggers on properties + properties_extension) + one-shot
backfill from property_details.listing_events for pre-trigger history.
Tax reassessment forecast LA · Resets to sale price
- Current annual tax
- $1,186 · $99/mo
- Projected year-2 tax
- $1,375 · $115/mo
- Expected delta
- +$189/yr (+$16/mo · 15.9%)
ⓘ Screening estimate from a state-policy table — verify with the county assessor before closing.
Climate risk First Street
- Flood 6/10 Major FEMA zone AE · 57% chance over 30 yrs
- Wildfire 1/10 Low
- Heat 9/10 Extreme 7 d/yr ≥109°F today · 23 d/yr by 30 yrs out
- Wind 9/10 Extreme 99% chance of damaging wind over 30 yrs
- Air quality 2/10 Low 1 unhealthy d/yr today · 1 by 30 yrs out
Nearby sold comps map
Loading sold comps map…
Walkable amenities ~0.75 mi
Loading nearby amenities…
Taxation est. · year 1
- Rental income
- $26,610
- − Mortgage interest
- −$14,004
- − Property taxes
- −$1,186
- − Insurance
- −$6,368
- − Repairs & maintenance
- −$2,129
- − Management
- −$2,129
- − Depreciation
- −$7,273
- Taxable loss
- −$6,479
- Est. tax savings @ 24.0%
- +$1,555
- After-tax cash flow
- $-710/yr
For passive investors: Depreciation is non-cash, so a rental often shows a tax loss while cash-flowing — sheltering income. Rental losses are passive: they offset passive income freely, and up to $25,000/yr can offset ordinary (W-2) income if you actively participate and your MAGI is under $100k (phasing out to $0 by $150k); unused losses carry forward. On sale, claimed depreciation is recaptured at up to 25%, and gains may owe capital-gains tax (a 1031 exchange can defer both). Figures are a year-1 estimate at your 24.0% rate — not tax advice; consult a CPA.
Schools (NCES district)
- District
- Calcasieu Parish
- NCES district ID
- 2200330
- Math proficiency
- 30% ▼ -39.00%
- Reading proficiency
- 44% ▼ -33.00%
- Median HH income
- $44,700
- Composite
- 31.45/100
- National rank
- #5979
- State rank
- #29 of 98 in LA
Livability — Lake Charles
- Score
- 68/100
- State rank
- #95
- US rank
- #9820
Category grades
Schools grade is shown separately in the Schools card above.
Census & demographics
- Census place
- Lake Charles, LA
- County
- Calcasieu Parish · 170,889 people
- City population
- 133,538
- Metro
- Lake Charles, LA
- Population (ZIP)
- 30,872
- Household income
- $49,992
- Rent vs Own
- Severe rent burden
- 1304.0
Population outlook (Calcasieu County) Hauer SSP2
- Today (2025)
- 212,179 people
- By 2030
- 218,199 · +2.8%
- By 2040
- 228,486 · +7.7%
- By 2050
- 236,208 · +11.3%
- By 2075
- 251,696 · +18.6%
- By 2100
- 247,848 · +16.8%
Race, ethnicity, and origin ACS 2023
- Neighborhood character
- Diverse neighborhood (Simpson 0.55)
- Race & ethnicity
- Black 59% White 31% Two or more races 7% Hispanic / Latino 5%
- Common ancestry
- Lithuanian 7% Iranian 1% Serbian 1%
- Foreign-born
- 3% · Canada
- Languages at home
- 95% English-only · Spanish 2% French/Haitian/Cajun 1%
Political lean MEDSL · Calcasieu
- 2024 margin
- Solid R (+39.6) · D 29.5% · R 69.0% · Other 1.5%
- 2008→2024 swing
- -15.0pp toward R · 2008: -24.6pp · 2024: -39.6pp
- All cycles
- 2024: R+39.6 2020: R+35.2 2016: R+33.3 2012: R+28.7 2008: R+24.6
Not yet ingested
- Civics
- —
Market trends
- HPI YoY
- ▼ -109.32%
- Current HPI
- 55.6127
- Rent YoY
- ▲ 6.18%
- Metro
- Lake Charles, LA
- State GDP YoY
- ▲ 3.29%
- F500 in state
- 10
Industry mix (Fortune 500 HQ in LA)
| Industry | F500 HQs | Revenue |
|---|---|---|
| Telecommunications | 2 | $23B |
|
||
| Utilities | 1 | $12B |
|
||
| Wholesale / Distribution | 1 | $5B |
|
||
| Advertising | 1 | $2B |
|
||
Price history
+158.5% since first listed10 events — show timeline
- 2026-04-01 Listed $250,000 SWLAR
- 2025-06-30 Sold (MLS) — GFPAR
- 2025-05-28 Delisted — GFPAR
- 2025-04-15 Listed $1 GFPAR
- 2017-06-19 Sold (Public Records) $220,900 Public Records
- 2017-06-16 Sold (MLS) — SWLAR
- 2017-05-11 Listed $224,900 SWLAR
- 2011-09-19 Sold (Public Records) $200,000 Public Records
- 2011-09-01 Sold (Public Records) $170,000 Public Records
- 1994-03-02 Sold (Public Records) $96,700 Public Records
Property tax history
+0.2%/yrLatest (2025): $1,186 · +2.4% YoY. Source: county tax records.
Cash-flow waterfall
monthlySold comps — $/sqft
last 12 mo · ≤1 miLoading sold comps…