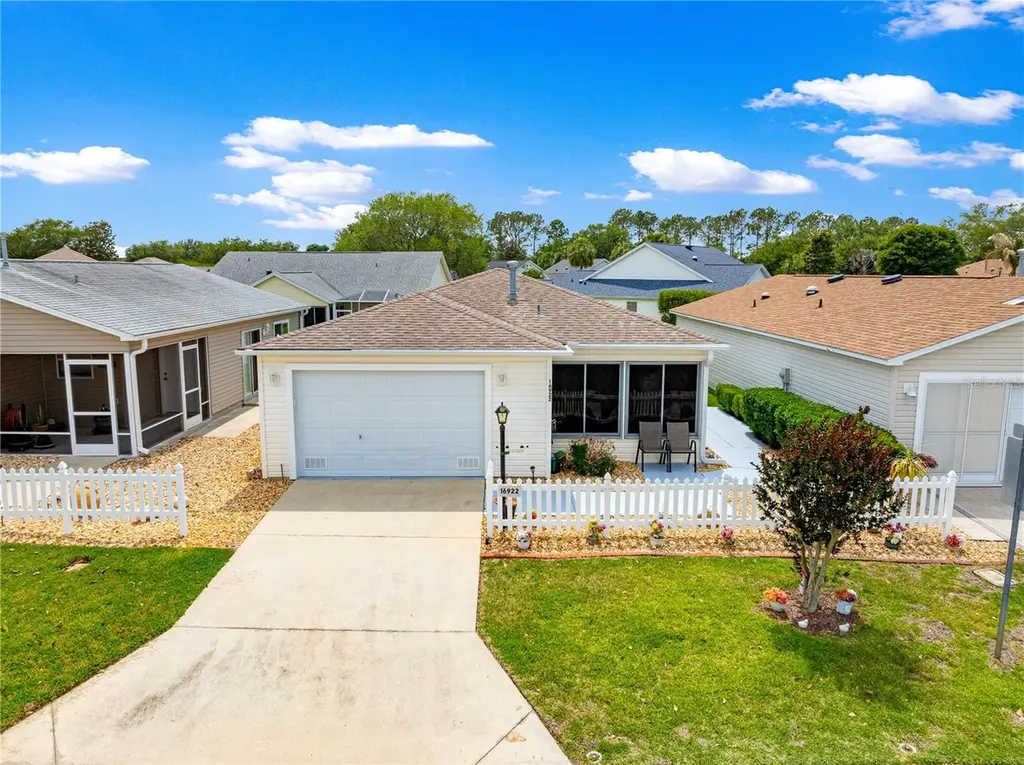
16922 SE 81st Charlesfort Ave · The Villages, FL
Flood risk 4/10 · Minor
- FEMA flood zone
- X (unshaded)
- Chance of flooding over 30 yrs
- 0.22%
- Est. flood insurance / yr
- $507 – $1,088
Fire risk 4/10 · Minor
- Est. fire insurance / yr
- $947 – $1,759
Heat risk 9/10 · Severe
- Hot days now (above 109°F)
- 7 days/yr
- Hot days in 30 yrs
- 22 days/yr
Wind risk 9/10 · Severe
- Chance of severe wind over 30 yrs
- 99.0%
Air-quality risk 3/10 · Minor
- Unhealthy air days now
- 2 days/yr
- Unhealthy air days in 30 yrs
- 2 days/yr
Risk factors via First Street. Map © Google.
Why this score? — see what drove the D grade
The composite is a weighted blend of 9 inputs, each scored 0–100. Each bar is that input's sub-score; the figure is the points it added to the 100-point composite (weight × sub-score).
- ARV discount +15.0/15.0
- Cash flow +7.9/30.0
- Schools +3.6/10.0
- 1% rule +3.5/10.0
- Rent growth +3.5/5.0
- Livability +3.5/5.0
- Condition / age +2.5/5.0
- DSCR +2.0/10.0
- Appreciation +0.0/10.0
$245,000
🖨 Deal sheet (PDF) 📄 Offer letter ✓ Due diligence
Listing remarks
* * * TURNKEY * * * BOND PAID! * * * HVAC 2022 * * * * * * ROOF 2018 * * * Discover this charming 2-bedroom, 2-bath Colony Patio Villa nestled in the sought-after Village of Calumet Grove. This home is fully furnished and TURNKEY making it the perfect Florida retreat for stress-free living. From the curb, you’ll appreciate the established landscaping and decorative painted walkway that leads to a welcoming lanai with updated flooring—an ideal spot for relaxing or gathering with guests. Inside, the home opens to a spacious layout with vaulted ceilings that enhance the light and open atmosphere. The main living areas feature updated luxury vinyl plank flooring fo
Key facts
- 3,485 sq ft lot
- Garage
- Community pool
Property features AI
Finance
- Other: Turnkey furnished; Living area approximately 1183 square feet; Building area total approximately 1667 square feet; Lot about 0.08 acre (approx. 40 x 88)
- Financial info: Total monthly fees: $204; Total annual fees: $2,448; Other annual assessment: $972; Lease restrictions apply
- HOA & community: Monthly association fee of $204; Association amenities include golf course, pool, recreation facilities, tennis courts and trails; Community features include deed restrictions, golf carts allowed, park, playground, and senior community
Exterior
- Parking: Attached garage; 1-car garage
- Utilities: Public water; Public sewer; Electricity connected; Natural gas connected; Cable available; Broadband/high-speed internet available; Water connected; Sewer connected
- Home design: Residential villa; Single-story (One level); Northeast facing; PUD zoning; CDD present; Homestead status
- Construction: Vinyl siding and frame construction; Shingle roof; Slab foundation; Built as COLONY model
- Exterior features: Lighting; Rain gutters; Sliding doors; Paved lot
Interior
- Kitchen: Dishwasher; Range; Microwave; Refrigerator
- Bedrooms: 2 bedrooms
- Bathrooms: 2 full bathrooms
- Heating & cooling: Central heating; Central air conditioning
- Interior features: Eat-in kitchen; High ceilings; Kitchen/family room combo; Living room/dining room combo; Open floorplan; Walk-in closet(s); Blinds
- Laundry & utility: Washer; Dryer; Inside laundry in a laundry closet
Neighborhood map
What this means for you Summary
Snapshot
- This is a 2-bed/2.0-bath single-family listed at $245k.
Deal economics
- At list price, monthly cash flow is $-256 ($-3k/yr) — negative.
- To cash-flow at today's rent, offer at most $200k (18.5% below list).
- To meet the 1% rule (rent ≥ 1% of price), the offer needs to be $209k (14.7% below list).
- Recommended offer: $200k (18.5% below list) — sets the bar for cash-flow.
Location & tenants
- Location reads 70/100 on livability (#431 in FL) — a middle-class / working-renter tenant base. Strengths: crime A+, housing A, employment B+; Watch: amenities F, commute F, health & safety F.
- Marion (rural): math 42% / reading 43% proficiency, ranked #61 of 73 in FL (top 84%) — families likely to look elsewhere, expect single-tenant / working-renter base with shorter leases; 61% free/reduced lunch — lower-income household profile, screen leases tightly.
- Zoned schools: Harbour View Elementary School (math 41% / reading 38%, grade F, #1,513 of 2,144 statewide, top 73%, 819 students, 71% FRL); Lake Weir Middle School (math 37% / reading 33%, grade F, #416 of 571 statewide, top 74%, 1,207 students, 76% FRL); Belleview High School (math 31% / reading 46%, grade F, #321 of 667 statewide, top 49%, 1,783 students, 56% FRL).
- Market conditions: Rents rising (+3.9%/yr); 551 active listings in the ZIP; 11 comparable units currently listed for rent nearby; rentals at typical pace (median 23d on market — plan ~3-4 weeks tenant-placement turnaround); 7,071 units permitted in Marion County in 2024 (534 in 5+ unit buildings).
- This rent runs 34% of the median local income ($74k/yr) — at the standard rent-burdened threshold; future hikes will face affordability resistance.
Forward outlook
- Local home prices are declining (-3.0%/yr); year-one equity from $2k of loan paydown is wiped out by about $7k of value loss. Plan a longer hold.
- Marion County population projected at +13% by 2050 — modest demand growth; plan on rents tracking national, not racing it.
Negotiation context
- It's been on market 46 days — a 3% lower offer ($238k) is reasonable based on typical stale-listing flexibility.
- 5 sale attempts since 19y ago; this cycle's ask has dropped $20k (8%) from the opening price — seller is motivated, your offer sets the floor, not the list.
- Current owner paid $203k; 21% above their basis — modest negotiation headroom, anchor on the comps not their cost.
Risks & watch-outs
- Climate carrying-cost: severe wind risk, 99% chance of damaging wind over 30y; extreme-heat days projected 7→22/yr by 2055 (HVAC capex compounding) — expect insurance premiums to compound above CPI over the hold.
Questions for the listing agent
- What do current leases actually rent for vs. the listed asking? Can we see a recent rent roll and the last 12 months of T-12 income?
- It's been on market 46 days. Have you received any prior offers? Is the seller open to a 18% concession, seller financing, or rate buy-down credit?
- What does the HOA fee cover, when was the last increase, and are there any pending special assessments or reserve-fund shortfalls?
- Is there a deadline driving the sale (1031 exchange, divorce, estate, relocation)? That informs how much negotiation room exists.
- Schools are A-rated — typically a magnet for longer-tenancy family renters. What's the average tenant stay here, and is there a school-zone premium baked into asking?
- The area grade is low — what's the realistic commute time and amenity access for the typical tenant pool here? Any planned neighborhood developments (good or bad) we should know about?
- What's the average days-on-market for RENTAL listings here right now (not sales)? A rising rental-DOM trend means longer vacancies and softer asking-rent achievability than the comps imply.
- What's the recent tenant-quality profile in this submarket — average credit score on applications, eviction rate, late-payment / NSF rate, and stable-employment percentage? A property-management company in the area should have these aggregated.
- How much new for-sale + rental construction is in the pipeline within 1–3 miles? Heavy new supply typically softens prices + rents 12–24 months out; constrained supply supports both.
Investment metrics
- 1% rule
- 0.85% ✗
- Cap rate
- 5.04%
- Cash-on-cash
- -4.48%
- DSCR
- 0.80
- GRM
- 9.8
CMA / ARV
- ARV (median comp)
- $318,560
- List price
- $245,000
- Delta
- -23.09%
- Verdict
- UNDERPRICED
- Comps
- 20 within 1.0 mi
Show comp detail 8 sales within ~0.75 mi
| Address | Dist | Beds/Ba | Sqft | Sold | Price | $/sf | Match |
|---|---|---|---|---|---|---|---|
| 16952 SE 81st Charlesfort Ave | 0.02mi | 2/2.0 | 1,163 (-2%) | 20mo | $245,000 | $211 | 80 |
| 17395 SE 82nd Pecan Ter | 0.51mi | 2/2.0 | 1,202 (+2%) | 1mo | $229,900 | $191 | 73 |
| 17126 SE 78th Larchmont Ct | 0.33mi | 2/2.0 | 1,229 (+4%) | 14mo | $352,000 | $286 | 66 |
| 8385 SE 173rd Hendricks Ln | 0.54mi | 2/2.0 | 1,177 (-0%) | 10mo | $295,000 | $251 | 66 |
| 17400 SE 77th Sycamore Ave | 0.57mi | 2/2.0 | 1,198 (+1%) | 8mo | $239,000 | $199 | 65 |
| 17107 SE 78th Parlange Ter | 0.23mi | 3/2.0 (+1) | 1,359 (+15%) | 6mo | $385,000 | $283 | 54 |
| 17385 SE 76th Champion Ave | 0.62mi | 2/2.0 | 1,125 (-5%) | 13mo | $305,000 | $271 | 52 |
| 17415 SE 82nd Pecan Ter | 0.52mi | 2/1.0 | 1,071 (-10%) | 10mo | $229,900 | $215 | 47 |
Match score weights: distance 35% · size 25% · config 20% · recency 20%. Top-matched comps best support the ARV.
Projected returns pro-forma
-3.0% appreciation · 3.92% rent growth · sell at horizon
- IRR
- -22.6%
- Equity multiple
- 0.21×
- Total profit
- $-53,906
- Equity at exit
- $36,530
- IRR
- -14.3%
- Equity multiple
- 0.14×
- Total profit
- $-59,130
- Equity at exit
- $21,183
Cash invested: $68,600 (down + closing). Projections, not guarantees.
Landlord ↔ Tenant lean methodology
- Overall (STATE)
- 87 Strongly Landlord-Friendly
- State Florida
- 87 Strongly Landlord-Friendly · R+3
- County
- — inherits STATE
- City
- — inherits STATE
ZIP-level market 32162
- Home prices YoY
- -6.9%
- Rents YoY
- 3.9%
- Active inventory
- 551
- Price-to-rent
- 9.8×
Monthly cashflow live
- Estimated rent
- $2,090 high interval (Pro) →
- Mortgage (P&I)
- −$1,285
- Tax from tax record
- −$317 /mo · $3,802/yr
- Insurance
- −$102
- HOA
- −$204
- Vacancy / Maint / Mgmt
- −$439
- Net cashflow
- $-256
Break-even live
Sensitivity live
| Price | -10% $-118 | -5% $-187 | +0% $-256 | +5% $-326 | +10% $-395 |
|---|---|---|---|---|---|
| Rent | -10% $-421 | -5% $-339 | +0% $-256 | +5% $-174 | +10% $-91 |
| Rate | -1.0pp $-133 | -0.5pp $-194 | base $-256 | +0.5pp $-320 | +1.0pp $-384 |
UW: 25.0% down · 7.5% · 30yr · 1.5% tax · 5.0% vac · 8.0% maint · 8.0% mgmt
Financing live
Cash to close
- Down payment
- $61,250
- Closing costs
- $7,350
- Reserves months
- —
- Total cash needed
- —
Loan-product check · same deal, 3 products live
Conventional
25% down · 7.5% · 30yr
- Down + closing
- —
- Monthly P&I
- —
- Monthly cashflow
- —
- DSCR
- —
- Eligible?
- —
Personal DTI + credit; lowest rate.
DSCR
20% down · 8.5% · 30yr
- Down + closing
- —
- Monthly P&I
- —
- Monthly cashflow
- —
- DSCR
- —
- Eligible?
- —
No personal income docs; deal must DSCR.
Hard money
10% down · 12.0% · 12mo
- Down + closing
- —
- Monthly P&I
- —
- Monthly cashflow
- —
- DSCR
- —
- Eligible?
- —
Short-term bridge; refi at stabilization.
Rent comps 11 comps
| Address | Beds | Baths | Sqft | Rent | $/sqft | DOM | Units | Dist |
|---|---|---|---|---|---|---|---|---|
| 17324 SE 82nd Pecan Ter The Villages, FL | 2.0 | 2.0 | 1358 | $2,500 | $1.84 | 23d | 1 | 0.42mi |
| 17400 SE 82nd Roslyn Ct The Villages, FL | 2.0 | 2.0 | 1138 | $4,700 | $4.13 | 23d | 1 | 0.46mi |
| 17442 SE 79th Lovewood Ave The Villages, FL | 2.0 | 2.0 | 1148 | $4,500 | $3.92 | 23d | 1 | 0.48mi |
| 7630 SE 174th Gaillard Pl The Villages, FL | 2.0 | 2.0 | 1265 | $4,500 | $3.56 | 23d | 1 | 0.67mi |
| 8544 SE 177th Bartram Loop The Villages, FL | 2.0 | 2.0 | 1265 | $1,900 | $1.50 | 23d | 1 | 0.93mi |
| 8352 SE 158th Pl Summerfield, FL | 3.0 | 2.0 | 1232 | $2,000 | $1.62 | 15d | 1 | 1.14mi |
| 8364 SE 158th Pl Summerfield, FL | 3.0 | 2.0 | 1374 | $2,000 | $1.46 | 15d | 1 | 1.15mi |
| 9195 SE 163rd St Summerfield, FL | 3.0 | 2.0 | 1410 | $1,800 | $1.28 | 23d | 1 | 1.29mi |
| 16962 SE 94th Sunnybrook Cir The Villages, FL | 2.0 | 2.0 | 1160 | $2,000 | $1.72 | 23d | 1 | 1.29mi |
| 9523 SE 168th Maplesong Ln The Villages, FL | 3.0 | 2.0 | 1265 | $1,975 | $1.56 | 23d | 1 | 1.43mi |
| 8721 SE 157th St Summerfield, FL | 3.0 | 2.0 | 1236 | $1,650 | $1.33 | 23d | 1 | 1.45mi |
HOA detail
- Monthly dues
- $204 · $2,448/yr
- Likely covers
- landscaping
Listing history 29 events
-
2026-06-21days on market $245,000 Active 46 DOM
-
2026-06-18days on market $245,000 Active 43 DOM
-
2026-06-17days on market $245,000 Active 42 DOM
-
2026-06-16days on market $245,000 Active 41 DOM
-
2026-06-15days on market $245,000 Active 40 DOM
-
2026-06-14days on market $245,000 Active 38 DOM
-
2026-06-13days on market $245,000 Active 37 DOM
-
2026-06-10days on market $245,000 Active 35 DOM
-
2026-06-09days on market $245,000 Active 34 DOM
-
2026-06-09price $245,000 Active 33 DOM
-
2026-06-08days on market $255,000 Active 33 DOM
-
2026-06-07days on market $255,000 Active 32 DOM
-
2026-06-03days on market $255,000 Active 28 DOM
-
2026-06-02days on market $255,000 Active 27 DOM
-
2026-06-01days on market $255,000 Active 26 DOM
-
2026-05-31days on market $255,000 Active 25 DOM
-
2026-05-30days on market $255,000 Active 24 DOM
-
2026-05-06$265,000 Active 1612-char remark
-
2026-03-30historical
-
2026-03-19$275,000 Active
-
2025-05-12historical
-
2025-05-08$259,900 Active
-
2021-07-01soldstatus $203,000
-
2009-10-30soldstatus $134,000
-
2008-08-13soldstatus $139,000
-
2007-09-15historical
-
2007-08-15historical
-
2007-03-15$175,000
-
2007-03-15$175,000
ⓘ Source: listings_history table (triggers on properties + properties_extension) + one-shot
backfill from property_details.listing_events for pre-trigger history.
Tax reassessment forecast FL · Resets to sale price
- Current annual tax
- $3,802 · $317/mo
- Projected year-2 tax
- $3,802 · $317/mo
- Expected delta
- $0/yr ($0/mo · 0.0%)
ⓘ Screening estimate from a state-policy table — verify with the county assessor before closing.
Climate risk First Street
- Flood 4/10 Moderate FEMA zone X (unshaded) · 22% chance over 30 yrs
- Wildfire 4/10 Moderate
- Heat 9/10 Extreme 7 d/yr ≥109°F today · 22 d/yr by 30 yrs out
- Wind 9/10 Extreme 99% chance of damaging wind over 30 yrs
- Air quality 3/10 Moderate 2 unhealthy d/yr today · 2 by 30 yrs out
Nearby sold comps map
Loading sold comps map…
Walkable amenities ~0.75 mi
Loading nearby amenities…
Taxation est. · year 1
- Rental income
- $25,085
- − Mortgage interest
- −$13,724
- − Property taxes
- −$3,802
- − Insurance
- −$1,225
- − Repairs & maintenance
- −$2,007
- − Management
- −$2,007
- − HOA
- −$2,448
- − Depreciation
- −$7,127
- Taxable loss
- −$7,254
- Est. tax savings @ 24.0%
- +$1,741
- After-tax cash flow
- $-1,334/yr
For passive investors: Depreciation is non-cash, so a rental often shows a tax loss while cash-flowing — sheltering income. Rental losses are passive: they offset passive income freely, and up to $25,000/yr can offset ordinary (W-2) income if you actively participate and your MAGI is under $100k (phasing out to $0 by $150k); unused losses carry forward. On sale, claimed depreciation is recaptured at up to 25%, and gains may owe capital-gains tax (a 1031 exchange can defer both). Figures are a year-1 estimate at your 24.0% rate — not tax advice; consult a CPA.
Schools (NCES district)
- District
- Marion
- NCES district ID
- 1201260
- Math proficiency
- 42% ▼ -7.00%
- Reading proficiency
- 43% ▼ -4.00%
- Median HH income
- $40,015
- Composite
- 35.61/100
- National rank
- #4890
- State rank
- #61 of 73 in FL
Livability — The Villages
- Score
- 70/100
- State rank
- #431
- US rank
- #7363
Category grades
Schools grade is shown separately in the Schools card above.
Census & demographics
- Census place
- The Villages, FL
- County
- Sumter County · 110,591 people
- City population
- 83,973
- Metro
- The Villages, FL
- Population (ZIP)
- 55,424
- Household income
- $74,119
- Rent vs Own
- Severe rent burden
- 987.0
Population outlook (Marion County) Hauer SSP2
- Today (2025)
- 365,905 people
- By 2030
- 376,768 · +3.0%
- By 2040
- 396,555 · +8.4%
- By 2050
- 412,723 · +12.8%
- By 2075
- 446,090 · +21.9%
- By 2100
- 436,193 · +19.2%
Race, ethnicity, and origin ACS 2023
- Neighborhood character
- Predominantly White (95%)
- Race & ethnicity
- White 95% Two or more races 2% Hispanic / Latino 2% Asian 1% Black 1%
- Common ancestry
- Romanian 7% Slovak 4% Lithuanian 4%
- Foreign-born
- 5% · Canada
- Languages at home
- 96% English-only · Spanish 1% Tagalog/Filipino 1%
Political lean MEDSL · Marion
- 2024 margin
- Solid R (+31.6) · D 33.8% · R 65.5%
- 2008→2024 swing
- -20.0pp toward R · 2008: -11.6pp · 2024: -31.6pp
- All cycles
- 2024: R+31.6 2020: R+25.9 2016: R+26.2 2012: R+16.2 2008: R+11.6
Not yet ingested
- Civics
- —
Market trends
- HPI YoY
- ▼ -16.16%
- Current HPI
- 218.1956
- Rent YoY
- ▲ 3.92%
- Metro
- The Villages, FL
- State GDP YoY
- ▲ 3.28%
- F500 in state
- 36
Industry mix (Fortune 500 HQ in FL)
| Industry | F500 HQs | Revenue |
|---|---|---|
| Industrial Technology | 2 | $29B |
|
||
| Insurance | 2 | $17B |
|
||
| Retail | 1 | $60B |
|
||
| Technology Distribution | 1 | $58B |
|
||
| Homebuilding | 1 | $35B |
|
||
| Technology Manufacturing | 1 | $35B |
|
||
Price history
+40.0% since first listed14 events — show timeline
- 2026-06-08 Price Changed $245,000 Stellar MLS as Distributed by MLS Grid
- 2026-05-20 Price Changed $255,000 Stellar MLS as Distributed by MLS Grid
- 2026-05-06 Listed $265,000 Stellar MLS as Distributed by MLS Grid
- 2026-03-30 Listing Removed — Stellar MLS as Distributed by MLS Grid
- 2026-03-19 Listed $275,000 Stellar MLS as Distributed by MLS Grid
- 2025-05-12 Listing Removed — Stellar MLS as Distributed by MLS Grid
- 2025-05-08 Listed $259,900 Stellar MLS as Distributed by MLS Grid
- 2021-07-01 Sold (Public Records) $203,000 Public Records
- 2009-10-30 Sold (Public Records) $134,000 Public Records
- 2008-08-13 Sold (Public Records) $139,000 Public Records
- 2007-09-15 Listing Removed — Stellar MLS as Distributed by MLS Grid
- 2007-08-15 Listing Removed — Stellar MLS as Distributed by MLS Grid
- 2007-03-15 Listed $175,000 Stellar MLS as Distributed by MLS Grid
- 2007-03-15 Listed $175,000 Stellar MLS as Distributed by MLS Grid
Property tax history
+4.6%/yrLatest (2025): $3,802 · +6.2% YoY. Source: county tax records.
Cash-flow waterfall
monthlySold comps — $/sqft
last 12 mo · ≤1 miLoading sold comps…