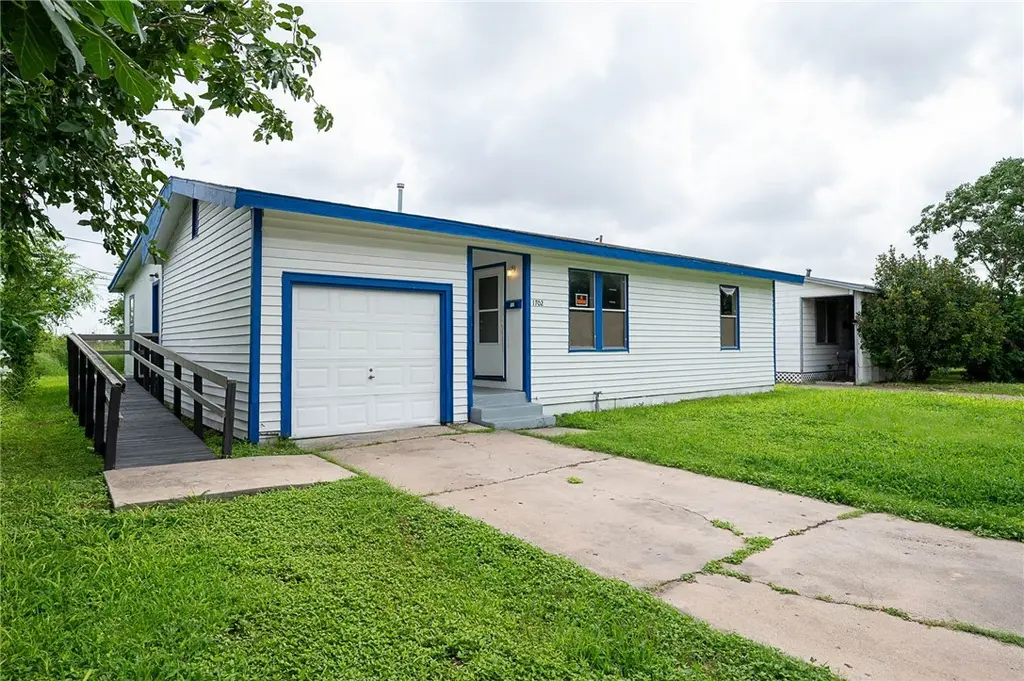
1702 Sycamore Pl · Corpus Christi, TX
Flood risk 4/10 · Minor
- FEMA flood zone
- X (shaded)
- Chance of flooding over 30 yrs
- 0.2%
- Est. flood insurance / yr
- $507 – $1,088
Fire risk 1/10 · Minimal
- Est. fire insurance / yr
- $1,222 – $2,270
Heat risk 10/10 · Severe
- Hot days now (above 107°F)
- 6 days/yr
- Hot days in 30 yrs
- 21 days/yr
Wind risk 9/10 · Severe
- Chance of severe wind over 30 yrs
- 99.0%
Air-quality risk 1/10 · Minimal
- Unhealthy air days now
- 0 days/yr
- Unhealthy air days in 30 yrs
- 0 days/yr
Risk factors via First Street. Map © Google.
Why this score? — see what drove the C- grade
The composite is a weighted blend of 9 inputs, each scored 0–100. Each bar is that input's sub-score; the figure is the points it added to the 100-point composite (weight × sub-score).
- Cash flow +18.6/30.0
- Appreciation +7.2/10.0
- DSCR +5.8/10.0
- 1% rule +5.2/10.0
- Livability +3.9/5.0
- ARV discount +3.1/15.0
- Schools +2.8/10.0
- Rent growth +2.5/5.0
- Condition / age +2.5/5.0
$175,000
🖨 Deal sheet (PDF) 📄 Offer letter ✓ Due diligence
Listing remarks MLS
INVESTORS SPECIAL, HOME IS BEING SOLD "AS IS. "
Key facts
- Utility room
- Real hardwood floors
- Walk-in closet
Tags
Property features AI
Finance
- HOA & community: Short-term rentals allowed
Exterior
- Parking: Attached garage with front entry
- Utilities: Public water; Public sewer; Sewer available; Water available
- Home design: Single-story home; Frame construction; Shingle roof; Pillar/post/pier foundation
- Construction: Frame construction; Shingle roof; Pillar/post/pier foundation
- Exterior features: Handicap accessible; Chain link and partial fencing; Interior lot
Interior
- Flooring: Hardwood; Laminate
- Bathrooms: 2 full bathrooms; 1 half bathroom
- Heating & cooling: Central heating (gas); Central air conditioning
- Interior features: Split bedrooms; Hardwood and laminate flooring
- Laundry & utility: Washer hookup; Dryer hookup; Range hood
Neighborhood map
What this means for you Summary
Snapshot
- This is a 4-bed/2.5-bath single-family listed at $175k.
Deal economics
- At list price, monthly cash flow is $169 ($2k/yr) — positive.
- The deal already cash-flows at list — no discount required.
- Meets the 1% rule at list price ($2k rent vs $175k).
- Cap rate 7.4% vs local median 3.6% in Corpus Christi — top-decile yield for the area; either an underpriced asset or a hidden risk that comps aren't pricing in. Stress-test before assuming the spread holds.
Location & tenants
- Location reads 78/100 on livability (#66 in TX, #2,404 nationally) — a middle-class / working-renter tenant base. Strengths: commute A+, cost of living A+, housing A+; Watch: crime F.
- Corpus Christi ISD (urban): math 31% / reading 35% proficiency, ranked #562 of 826 in TX (top 68%) — families likely to look elsewhere, expect single-tenant / working-renter base with shorter leases; 63% free/reduced lunch — lower-income household profile, screen leases tightly.
- Market conditions: 45 active listings in the ZIP; 6 comparable units currently listed for rent nearby; rentals at typical pace (median 15d on market — plan ~3-4 weeks tenant-placement turnaround); lower-income renter base — watch delinquency; 1,397 units permitted in Nueces County in 2024 (47 in 5+ unit buildings).
- At $1,791/mo this rent would consume 50% of the median local household income ($43k/yr) (locally 386% of renters already pay >50% of income on rent) — very limited rent-growth headroom before tenants either downsize or default.
Forward outlook
- In year one you build about $9k of equity ($1k loan paydown + $8k appreciation (4.4% local appreciation)).
- Nueces County population projected at +36% by 2050 — long-run rental-demand tailwind backs the buy-and-hold thesis.
- At projected returns (4.4% appreciation + 3.0% rent growth), your $49k cash investment doubles in ~5 years — after that, you're playing with house money.
- By year 5, paydown + projected appreciation supports a ~$38k cash-out refi (75% LTV) — recoverable capital for the next deal without selling this one.
Negotiation context
- Only 5 days on market — expect competitive offers; lowballing is unlikely to land.
- 3 sale attempts since 27y ago with the ask held roughly flat each time — persistent listings suggest the price (not the market) is what's stuck; bring a comps-based counter.
Risks & watch-outs
- Watch-outs: built in 1955 — expect roof / HVAC / electrical / plumbing capex.
- Climate carrying-cost: severe wind risk, 99% chance of damaging wind over 30y; extreme-heat days projected 6→21/yr by 2055 (HVAC capex compounding) — expect insurance premiums to compound above CPI over the hold.
Questions for the listing agent
- Built in 1955 — when were the roof, HVAC, electrical panel, plumbing, and water heater last replaced?
- Is there a deadline driving the sale (1031 exchange, divorce, estate, relocation)? That informs how much negotiation room exists.
- Crime grade is F in this area — have there been break-ins, vandalism, or insurance claims at this property in the last 3 years? What carrier currently insures it and at what premium?
- What's the average days-on-market for RENTAL listings here right now (not sales)? A rising rental-DOM trend means longer vacancies and softer asking-rent achievability than the comps imply.
- What's the recent tenant-quality profile in this submarket — average credit score on applications, eviction rate, late-payment / NSF rate, and stable-employment percentage? A property-management company in the area should have these aggregated.
- How much new for-sale + rental construction is in the pipeline within 1–3 miles? Heavy new supply typically softens prices + rents 12–24 months out; constrained supply supports both.
Investment metrics
- 1% rule
- 1.02% ✓
- Cap rate
- 7.45%
- Cash-on-cash
- 4.13%
- DSCR
- 1.18
- GRM
- 8.1
CMA / ARV
- ARV (on-the-fly)
- $159,274
- Comps found
- 8
Show comp detail 8 sales within ~0.75 mi
| Address | Dist | Beds/Ba | Sqft | Sold | Price | $/sf | Match |
|---|---|---|---|---|---|---|---|
| 1621 Birch Pl | 0.09mi | 4/2.0 | 1,699 (+4%) | 16mo | $67,000 | $39 | 75 |
| 1806 Juarez St | 0.22mi | 4/3.0 | 1,704 (+4%) | 18mo | $169,900 | $100 | 67 |
| 1526 Madrid Dr | 0.15mi | 3/3.0 (-1) | 1,730 (+5%) | 15mo | $110,000 | $64 | 64 |
| 937 W Point | 0.50mi | 4/2.0 | 1,629 (-1%) | 14mo | $100,000 | $61 | 62 |
| 1401 Barcelona Dr | 0.37mi | 4/1.0 | 1,507 (-8%) | 3mo | $161,000 | $107 | 61 |
| 1805 Sherman St | 0.66mi | 5/2.0 (+1) | 1,680 (+2%) | 22mo | $168,000 | $100 | 40 |
| 4621 Bluebelle Ln | 0.54mi | 3/2.0 (-1) | 1,492 (-9%) | 23mo | $115,000 | $77 | 33 |
| 1609 Sherman St | 0.63mi | 5/2.5 (+1) | 1,874 (+14%) | 14mo | $181,600 | $97 | 31 |
Match score weights: distance 35% · size 25% · config 20% · recency 20%. Top-matched comps best support the ARV.
Projected returns pro-forma
4.38% appreciation · 3.0% rent growth · sell at horizon
- IRR
- 14.9%
- Equity multiple
- 1.92×
- Total profit
- $44,977
- Equity at exit
- $92,633
- IRR
- 15.8%
- Equity multiple
- 3.65×
- Total profit
- $129,934
- Equity at exit
- $154,710
Cash invested: $49,000 (down + closing). Projections, not guarantees.
Landlord ↔ Tenant lean methodology
- Overall (STATE)
- 87 Strongly Landlord-Friendly
- State Texas
- 87 Strongly Landlord-Friendly · R+5
- County
- — inherits STATE
- City
- — inherits STATE
ZIP-level market 78416
- Home prices YoY
- 3.2%
- Active inventory
- 45
- Price-to-rent
- 8.1×
Monthly cashflow live
- Estimated rent
- $1,791 high interval (Pro) →
- Mortgage (P&I)
- −$918
- Tax from tax record
- −$256 /mo · $3,070/yr
- Insurance
- −$73
- HOA
- −$0
- Vacancy / Maint / Mgmt
- −$376
- Net cashflow
- $169
Break-even live
Sensitivity live
| Price | -10% $268 | -5% $218 | +0% $169 | +5% $119 | +10% $70 |
|---|---|---|---|---|---|
| Rent | -10% $27 | -5% $98 | +0% $169 | +5% $239 | +10% $310 |
| Rate | -1.0pp $257 | -0.5pp $213 | base $169 | +0.5pp $123 | +1.0pp $77 |
UW: 25.0% down · 7.5% · 30yr · 1.5% tax · 5.0% vac · 8.0% maint · 8.0% mgmt
Financing live
Cash to close
- Down payment
- $43,750
- Closing costs
- $5,250
- Reserves months
- —
- Total cash needed
- —
Loan-product check · same deal, 3 products live
Conventional
25% down · 7.5% · 30yr
- Down + closing
- —
- Monthly P&I
- —
- Monthly cashflow
- —
- DSCR
- —
- Eligible?
- —
Personal DTI + credit; lowest rate.
DSCR
20% down · 8.5% · 30yr
- Down + closing
- —
- Monthly P&I
- —
- Monthly cashflow
- —
- DSCR
- —
- Eligible?
- —
No personal income docs; deal must DSCR.
Hard money
10% down · 12.0% · 12mo
- Down + closing
- —
- Monthly P&I
- —
- Monthly cashflow
- —
- DSCR
- —
- Eligible?
- —
Short-term bridge; refi at stabilization.
Rent comps 6 comps
| Address | Beds | Baths | Sqft | Rent | $/sqft | DOM | Units | Dist |
|---|---|---|---|---|---|---|---|---|
| 1618 Birch Pl Corpus Christi, TX | 3.0 | 1.0 | 1558 | $1,500 | $0.96 | 14d | 1 | 0.08mi |
| 2041 Harvard St Corpus Christi, TX | 3.0 | 2.0 | 1230 | $1,400 | $1.14 | 14d | 1 | 0.73mi |
| 1837 Horne Rd Corpus Christi, TX | 3.0 | 2.0 | 1226 | $1,800 | $1.47 | 44d | 1 | 0.79mi |
| 1070 Golden Gate Cir Corpus Christi, TX | 3.0 | 2.0 | 1644 | $1,700 | $1.03 | 45d | 1 | 1.21mi |
| 1610 La Joya St Corpus Christi, TX | 3.0 | 1.5 | 1784 | $1,825 | $1.02 | 14d | 1 | 1.38mi |
| 2709 Milo St Corpus Christi, TX | 3.0 | 2.0 | 1122 | $1,700 | $1.52 | 14d | 1 | 1.45mi |
Listing history 4 events
-
2026-06-14days on market $175,000 Active 5 DOM
-
2026-06-10days on market $175,000 Active 2 DOM
-
2026-06-09remarks 569-char remark
-
2026-06-09$175,000 Active 1 DOM
ⓘ Source: listings_history table (triggers on properties + properties_extension) + one-shot
backfill from property_details.listing_events for pre-trigger history.
Tax reassessment forecast TX · Resets to sale price
- Current annual tax
- $3,070 · $256/mo
- Projected year-2 tax
- $3,202 · $267/mo
- Expected delta
- +$133/yr (+$11/mo · 4.3%)
ⓘ Screening estimate from a state-policy table — verify with the county assessor before closing.
Climate risk First Street
- Flood 4/10 Moderate FEMA zone X (shaded) · 20% chance over 30 yrs
- Wildfire 1/10 Low
- Heat 10/10 Extreme 6 d/yr ≥107°F today · 21 d/yr by 30 yrs out
- Wind 9/10 Extreme 99% chance of damaging wind over 30 yrs
- Air quality 1/10 Low 0 unhealthy d/yr today · 0 by 30 yrs out
Nearby sold comps map
Loading sold comps map…
Walkable amenities ~0.75 mi
Loading nearby amenities…
Taxation est. · year 1
- Rental income
- $21,494
- − Mortgage interest
- −$9,803
- − Property taxes
- −$3,070
- − Insurance
- −$875
- − Repairs & maintenance
- −$1,720
- − Management
- −$1,720
- − Depreciation
- −$5,091
- Taxable loss
- −$783
- Est. tax savings @ 24.0%
- +$188
- After-tax cash flow
- $2,211/yr
For passive investors: Depreciation is non-cash, so a rental often shows a tax loss while cash-flowing — sheltering income. Rental losses are passive: they offset passive income freely, and up to $25,000/yr can offset ordinary (W-2) income if you actively participate and your MAGI is under $100k (phasing out to $0 by $150k); unused losses carry forward. On sale, claimed depreciation is recaptured at up to 25%, and gains may owe capital-gains tax (a 1031 exchange can defer both). Figures are a year-1 estimate at your 24.0% rate — not tax advice; consult a CPA.
Schools (NCES district)
- District
- Corpus Christi ISD
- NCES district ID
- 4815270
- Math proficiency
- 31% ▼ -18.00%
- Reading proficiency
- 35% ▼ -7.00%
- Median HH income
- $45,672
- Composite
- 28.27/100
- National rank
- #6793
- State rank
- #562 of 826 in TX
Livability — Corpus Christi
- Score
- 78/100
- State rank
- #66
- US rank
- #2404
Category grades
Schools grade is shown separately in the Schools card above.
Census & demographics
- Census place
- Corpus Christi, TX
- County
- Nueces County · 296,836 people
- City population
- 296,836
- Metro
- Corpus Christi, TX
- Population (ZIP)
- 12,480
- Household income
- $43,198
- Rent vs Own
- Severe rent burden
- 386.0
Population outlook (Nueces County) Hauer SSP2
- Today (2025)
- 418,037 people
- By 2030
- 447,123 · +7.0%
- By 2040
- 505,911 · +21.0%
- By 2050
- 567,522 · +35.8%
- By 2075
- 729,686 · +74.6%
- By 2100
- 847,087 · +102.6%
Race, ethnicity, and origin ACS 2023
- Neighborhood character
- Predominantly Hispanic (79%)
- Race & ethnicity
- Hispanic / Latino 79% Two or more races 38% Black 16% White 4%
- Hispanic origin (detail)
- Mexican 72%
- Foreign-born
- 12% · Canada
- Languages at home
- 50% English-only · Spanish 49%
Political lean MEDSL · Nueces
- 2024 margin
- R (+11.5) · D 43.8% · R 55.3%
- 2008→2024 swing
- -7.1pp toward R · 2008: -4.4pp · 2024: -11.5pp
- All cycles
- 2024: R+11.5 2020: R+2.9 2016: R+1.5 2012: R+3.2 2008: R+4.4
Not yet ingested
- Civics
- —
Market trends
- HPI YoY
- ▲ 4.38%
- Current HPI
- 139.6557
- Rent YoY
- —
- Metro
- Corpus Christi, TX
- State GDP YoY
- ▲ 3.95%
- F500 in state
- 110
Industry mix (Fortune 500 HQ in TX)
| Industry | F500 HQs | Revenue |
|---|---|---|
| Energy | 16 | $1,198B |
|
||
| Technology | 5 | $198B |
|
||
| Engineering / Construction | 4 | $72B |
|
||
| Energy Services | 3 | $60B |
|
||
| Utilities | 3 | $41B |
|
||
| Healthcare | 2 | $330B |
|
||
Price history
+268.4% since first listed6 events — show timeline
- 2026-06-07 Listed $175,000 CBMLS
- 2008-05-16 Sold (Public Records) — Public Records
- 2008-05-13 Sold (MLS) — CBMLS
- 2007-12-06 Listed $59,000 CBMLS
- 2000-02-15 Sold (Public Records) — Public Records
- 1999-02-04 Listed $47,500 CBMLS
Property tax history
+4.5%/yrLatest (2025): $3,070 · +2.9% YoY. Source: county tax records.
Cash-flow waterfall
monthlySold comps — $/sqft
last 12 mo · ≤1 miLoading sold comps…